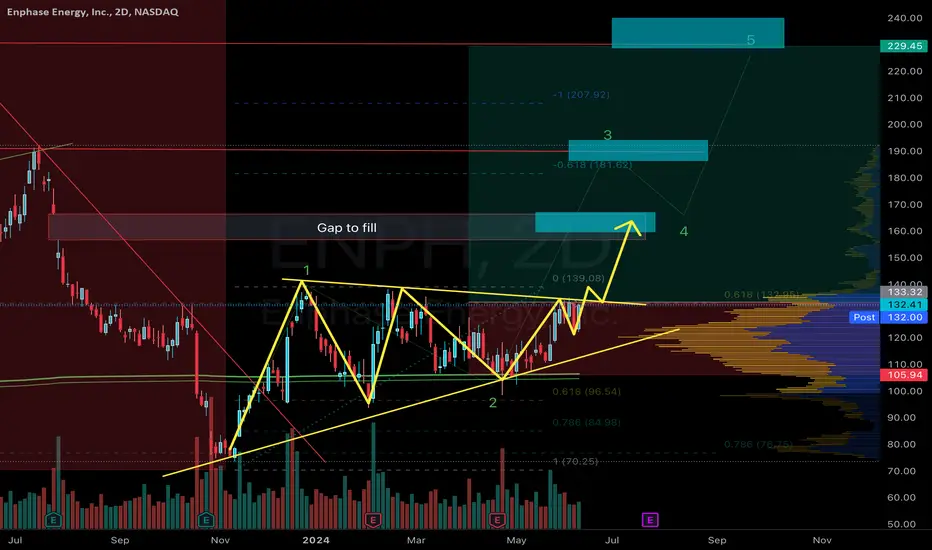
ENPH-Bullish Harami Pattern at Trendline- Explosive Rally Ahead?Enphase has erased most of its vertical rally with a swift V-shaped correction, bringing price right back to a technically important area.
The chart is now testing the previously broken descending trendline, which has the potential to flip from former resistance into new support. At the same time,
Compare with Enphase Energy, Inc.
1.02 USD
172.13 M USD
1.47 B USD
128.11 M
Next report date
—
Report period
—
EPS estimate
—
Revenue estimate
—
Company info
Sector
Industry
CEO
Badrinarayanan Kothandaraman
Website
Headquarters
Fremont
Founded
2006
IPO date
Mar 30, 2012
ISIN
US29355A1079
CUSIP
29355A107
FIGI
BBG001R3MNY9
Identifiers
ISIN US29355A1079
Enphase Energy, Inc. is a global energy technology company, which engages in the business of designing, developing, manufacturing, and selling home energy solutions that manage energy generation, energy storage, control, and communications on one intelligent platform. It operates through the following geographical segments: the United States, the Netherlands, and Others. The company was founded by Raghuveer R. Belur and Martin Fornage in March 2006 and is headquartered in Fremont, CA.
$ENPH [Enphase Energy] TECHNICAL ANALYSIS MONTHLY TF EWP FIB TCENPH: The Market Is Pricing in Failure—But What If It Is Wrong?
Enphase Energy has spent more than three years trapped inside a well-defined descending channel, erasing nearly all of the gains from its 2020–2022 bull market. Sentiment has become overwhelmingly bearish, and price continues to respe
$ENPH , Idea (Update)ENPH - Daily : The Break Happened. Now Comes The Test.
The previous idea focused on a potential structural reversal after years of decline.
The market has since delivered the first piece of evidence.
The break of structure occurred.
After establishing a major low and reclaiming key levels, ENPH
$ENPH - Bowl Pattern and 50 SMA Support Check💡 Swing setup idea
Bowl pattern completion / 50 SMA support retest
🔎 Analysis summary:
The stock crossed above the 50 SMA and closed a bowl structure. It pushed higher and has since come back to check support, forming a bullish hammer candle supported by rising, above-average volume.
👀 Levels
ENPH Turned BullishENPH, has clearly reversed its trend. After hitting 73.7, it has now retested the breakout. Price is taking support in fib golden pocket. Overall healthy correction and rebound.
Should return back and test 73.7 again. Breakout above 74 would mean trend continuation. for now SL 48 on daily closing
Strong Reclaim Bar at Rising 10EMA After First WaveNASDAQ:ENPH This chart shows a strong reclaim structure after a sharp First Wave and a pullback into the rising 10EMA.
Price first formed a clear First Wave from the lows,
showing a clear shift in short-term momentum.
After that move, price started to pull back, but the pullback did not deeply dam
$ENPH , IdeaENPH · 4H · Decision Point
Enphase sitting at a critical junction right now.
Price bounced off multi-month lows and is now pressing into a dense resistance cluster — $32.20 / $33.17 / $34.20 overhead. The reaction here sets up two very different stories.
Scenario 1 → Buyers hold, momentum builds,
WOLF WATCH — ENPHENPH is currently trading around 64.00 and is beginning to show signs of breaking out from a prolonged accumulation phase. Momentum and volume are starting to expand as bullish order flow steps back into the market.
The wolf is picking up a strong scent trail here. Institutional positioning and dev
See all ideas
Summarizing what the indicators are suggesting.
Neutral
SellBuy
Strong sellStrong buy
Strong sellSellNeutralBuyStrong buy
Neutral
SellBuy
Strong sellStrong buy
Strong sellSellNeutralBuyStrong buy
Neutral
SellBuy
Strong sellStrong buy
Strong sellSellNeutralBuyStrong buy
An aggregate view of professional's ratings.
Neutral
SellBuy
Strong sellStrong buy
Strong sellSellNeutralBuyStrong buy
Neutral
SellBuy
Strong sellStrong buy
Strong sellSellNeutralBuyStrong buy
Neutral
SellBuy
Strong sellStrong buy
Strong sellSellNeutralBuyStrong buy
Displays a symbol's price movements over previous years to identify recurring trends.
Maturity dateMar 1, 2028
Coupon0% (Zero)
See all ENPH bonds
Frequently asked questions
The current price of ENPH is 39.15 USD — it has decreased by −0.74% in the past 24 hours. Watch Enphase Energy, Inc. stock price performance more closely on the chart.
Depending on the exchange, the stock ticker may vary. For instance, on NASDAQ exchange Enphase Energy, Inc. stocks are traded under the ticker ENPH.
ENPH stock has fallen by −1.63% compared to the previous week, the month change is a −10.24% fall, over the last year Enphase Energy, Inc. has showed a 21.55% increase.
We've gathered analysts' opinions on Enphase Energy, Inc. future price: according to them, ENPH price has a max estimate of 85.00 USD and a min estimate of 24.47 USD. Watch ENPH chart and read a more detailed Enphase Energy, Inc. stock forecast: see what analysts think of Enphase Energy, Inc. and suggest that you do with its stocks.
ENPH reached its all-time high on Dec 5, 2022 with the price of 339.92 USD, and its all-time low was 0.65 USD and was reached on May 18, 2017. View more price dynamics on ENPH chart.
See other stocks reaching their highest and lowest prices.
ENPH stock is 4.44% volatile and has beta coefficient of 1.44. Track Enphase Energy, Inc. stock price on the chart and check out the list of the most volatile stocks — is Enphase Energy, Inc. there?
Today Enphase Energy, Inc. has the market capitalization of 5.35 B, it has decreased by −8.24% over the last week.
Yes, you can track Enphase Energy, Inc. financials in yearly and quarterly reports right on TradingView.
Enphase Energy, Inc. is going to release the next earnings report on Oct 27, 2026. Keep track of upcoming events with our Earnings Calendar.
ENPH earnings for the last quarter are 0.46 USD per share, whereas the estimation was 0.47 USD resulting in a −2.36% surprise. The estimated earnings for the next quarter are 0.51 USD per share. See more details about Enphase Energy, Inc. earnings.
Enphase Energy, Inc. revenue for the last quarter amounts to 291.85 M USD, despite the estimated figure of 289.76 M USD. In the next quarter, revenue is expected to reach 305.16 M USD.
ENPH net income for the last quarter is 36.08 M USD, while the quarter before that showed −7.41 M USD of net income which accounts for 0.00% change. Track more Enphase Energy, Inc. financial stats to get the full picture.
No, ENPH doesn't pay any dividends to its shareholders. But don't worry, we've prepared a list of high-dividend stocks for you.
As of Aug 17, 2026, the company has 2.87 K employees. See our rating of the largest employees — is Enphase Energy, Inc. on this list?
EBITDA measures a company's operating performance, its growth signifies an improvement in the efficiency of a company. Enphase Energy, Inc. EBITDA is 422.17 M USD, and current EBITDA margin is 32.34%. See more stats in Enphase Energy, Inc. financial statements.
Like other stocks, ENPH shares are traded on stock exchanges, e.g. Nasdaq, Nyse, Euronext, and the easiest way to buy them is through an online stock broker. To do this, you need to open an account and follow a broker's procedures, then start trading. You can trade Enphase Energy, Inc. stock right from TradingView charts — choose your broker and connect to your account.
Investing in stocks requires a comprehensive research: you should carefully study all the available data, e.g. company's financials, related news, and its technical analysis. So Enphase Energy, Inc. technincal analysis shows the sell today, and its 1 week rating is sell. Since market conditions are prone to changes, it's worth looking a bit further into the future — according to the 1 month rating Enphase Energy, Inc. stock shows the sell signal. See more of Enphase Energy, Inc. technicals for a more comprehensive analysis.