Why Did Natural Gas Fall by 50 % in One Day ? - AnalysisWhat you’re seeing is not a real 50% collapse in natural gas prices, but a futures contract rollover effect. Natural gas trades in monthly contracts, and each month has its own price based on expected supply, demand, and especially weather risk. The February contract often carries a big premium in winter because of heating demand and cold-weather risks, while the March contract can trade much lower if those risks are expected to ease. When trading platforms switch from showing the expiring February contract to the March one, it can look like a massive price drop, but in reality, it’s just a shift from one contract to another with different fundamentals.
If you had an open position, you would not automatically lose 50% just because of this chart change. Your profit or loss is calculated based on the specific contract you traded (e.g., February gas), not the new one displayed. A large loss would only occur if your position was actually closed and reopened in the new contract at the lower price, which is a rollover transaction, not a market crash. So the dramatic percentage drop you see is mostly a visual effect of switching contracts, not natural gas suddenly becoming half as valuable.
Disclaimer:
This analysis is for informational and educational purposes only and does not constitute financial advice, investment recommendation, or an offer to buy or sell any securities. Asset prices, valuations, and performance metrics are subject to change and may be outdated. Always conduct your own due diligence and consult with a licensed financial advisor before making investment decisions. The information presented may contain inaccuracies and should not be solely relied upon for financial decisions. I am not a licensed financial advisor or professional trader. I am not personally liable for your own losses; this is not financial advice.
Natgas

Natural Gas Stock Forecast | Oil | Dollar | Silver | GoldNatural Gas Stock Forecast | Oil | Dollar | Silver | Gold
Catch the latest commodities trading insights! This week's market analysis includes a look at both sides of the coin for oil, gold and silver. Plus, get some helpful technical analysis and trading tips to guide your decisions.
0:00 Intro & Commodities Overview
0:38 Natural Gas AMEX:UNG
8:23 Oil NYMEX:CL1!
9:51 US Dollar (DXY)
11:55 Gold & Silver COMEX:GC1! COMEX:SI1!
19:15 Outro
Natural Gas stock Bulls PEPPERSTONE:NATGAS Support & Resistance Guide
AMEX:USO Oil Stock price Forecast
TVC:DXY US dollar Stock analysis
Gold OANDA:XAUUSD Stock price Forecast
Silver OANDA:XAGUSD stock analysis

NATGAS LOCAL SHORT|
✅NATGAS reacts from a higher-timeframe supply after an aggressive bullish impulse. Buy-side liquidity appears tapped, with weakening structure suggesting a corrective pullback toward the marked target zone. Time Frame 6H.
SHORT🔥
✅Like and subscribe to never miss a new idea!✅

NATGAS The Target Is DOWN! SELL!
My dear friends,
My technical analysis for NATGAS is below:
The market is trading on 5.353 pivot level.
Bias - Bearish
Technical Indicators: Both Super Trend & Pivot HL indicate a highly probable Bearish continuation.
Target - 5.041
Recommended Stop Loss - 5.541
About Used Indicators:
A pivot point is a technical analysis indicator, or calculations, used to determine the overall trend of the market over different time frames.
Disclosure: I am part of Trade Nation's Influencer program and receive a monthly fee for using their TradingView charts in my analysis.
———————————
WISH YOU ALL LUCK

Why Did Natural Gas Explode by 88% ? - AnalysisWhy it spiked so hard
1) Forecasts flipped colder → demand repriced immediately. The biggest mechanical driver was a rapid shift to much colder weather forecasts across key consuming regions, which instantly implies:
-higher residential/commercial heating demand, and higher power-sector gas burn (especially when wind/renewables are weak).
2) Short covering / squeeze dynamics amplified the move
When a market is positioned short and fundamentals suddenly tighten, price doesn’t just rise, it jumps as shorts rush to buy back contracts. Multiple market writeups for that week explicitly point to short covering as fuel for the outsized daily gains.
3) “Freeze-offs” risk (supply disruption from extreme cold)
Extreme cold can reduce production and disrupt operations (“freeze-offs”), especially if it pushes into producing regions and infrastructure bottlenecks. That risk premium is exactly the kind that gets priced fast because it can change balances overnight.
4) Europe: low storage + cold + geopolitics added an extra premium
In Europe, TTF/UK hubs were also reacting to: colder forecasts and storage draw concerns, and added supply-security/geopolitical anxiety (some coverage linked this to fears around U.S.–EU tensions and LNG leverage). Those helped push European benchmarks to their highest levels in months during the same window.
Disclaimer:
This analysis is for informational and educational purposes only and does not constitute financial advice, investment recommendation, or an offer to buy or sell any securities. Asset prices, valuations, and performance metrics are subject to change and may be outdated. Always conduct your own due diligence and consult with a licensed financial advisor before making investment decisions. The information presented may contain inaccuracies and should not be solely relied upon for financial decisions. I am not a licensed financial advisor or professional trader. I am not personally liable for your own losses; this is not financial advice.

Long Idea on Natural Gas (NG1!)Based on :
- Quantitative analysis
- Propietary temperature shock european model
- Vp and Avwap

Natutal Gas (Possible to build long bias positions)Natgas
$3 region is playing good defense.
Likely to rise higher..
As long as the level hold. we can rise higher and possible to build long bias positions slowly.
DYODD
@TradewithSonic

Is Natural Gas Bottoming? Natural gas continues to remain at the lower end of support.
Intra day nat gas is potentially forming a bullish inverse heads and shoulder pattern.
As long as Nat gas keeps giving is some higher lows - we should see a near term pop to the upside.
Failure to break out in the coming sessions could send us to 2.75.
I remain net long nat gas at these levels.

Natural Gas Stock Forecast | Oil | Dollar | Silver | Gold0:00 Intro
0:27 Natural Gas
6:15 Oil
7:56 US Dollar
9:19 Gold & Silver
12:47 Outro
AMEX:UNG AMEX:BOIL AMEX:KOLD COMEX:GC1!

$APA: Inverse Head & Shoulders Breakout coming soon.APA Corporation ( NASDAQ:APA ) showing a classic Inverse Head and Shoulders pattern, which is a major bullish reversal signal typically found at the end of a downtrend
The "AI-Energy" Narrative: NASDAQ:APA surged over 8% on January 9, 2026, following reports linking increased LNG demand to the massive power needs of AI data centres.
Institutional Support: JPMorgan Chase and other institutions recently increased their stakes, signalling professional confidence in the stock's 2026 prospects.
Technical "Strong Buy": Moving averages (MA5, MA50, MA200) are currently in a "Strong Buy" alignment, providing a systematic tailwind for this trade.

NATGAS The Target Is UP! BUY!
My dear subscribers,
NATGAS looks like it will make a good move, and here are the details:
The market is trading on 3.141 pivot level.
Bias - Bullish
Technical Indicators: Both Super Trend & Pivot HL indicate a highly probable Bullish continuation.
Target - 3.304
About Used Indicators:
The average true range (ATR) plays an important role in 'Supertrend' as the indicator uses ATR to calculate its value. The ATR indicator signals the degree of price volatility.
Disclosure: I am part of Trade Nation's Influencer program and receive a monthly fee for using their TradingView charts in my analysis.
———————————
WISH YOU ALL LUCK

NATGAS Local Short! Sell!
Hello,Traders!
NATGAS is trading below a key horizontal supply, confirming bearish market structure after a strong sell-side displacement. Smart money distribution is evident, with price likely to retest the supply for mitigation before continuing toward lower liquidity pools. Time Frame 12H.
Sell!
Comment and subscribe to help us grow!
Check out other forecasts below too!
Disclosure: I am part of Trade Nation's Influencer program and receive a monthly fee for using their TradingView charts in my analysis.

NAT GAS Long SignalSee chart for details:
Technicals = Price inside Monthly/Weekly levels of demand. Longs are valid with confirmation.
Sentiment = Price just reached HTF technical demand, so traders will be trading against, but that's to be expected as price is just reaching HTF demand and reports are delayed.
Fundamentals = not available.
Valid for longs with confirmation, or wait a couple of weeks and still can catch longs as price leaves and COT suggests buying.

Natural Gas Stock Forecast | Oil | Dollar | Silver | GoldNatural Gas Stock Forecast | Oil | Dollar | Silver | Gold
NYMEX:NG1! NYMEX:CL1! COMEX:GC1! COMEX:SI1!
Catch the latest commodities trading insights! This week's market analysis includes a look at both sides of the coin for oil, gold and silver. Plus, get some helpful technical analysis and trading tips to guide your decisions.
0:00 Intro
0:22 Natural Gas
7:25 Oil
9:31 US Dollar (DXY)
11:25 Gold & Silver

The Natural Gas Will Jump from a Support LevelHello Traders
In This Chart Natural Gas HOURLY Forex Forecast By FOREX PLANET
today Natural Gas analysis 👆
🟢This Chart includes_ (Natural Gas market update)
🟢What is The Next Opportunity on Natural Gas Market
🟢how to Enter to the Valid Entry With Assurance Profit
This CHART is For Trader's that Want to Improve Their Technical Analysis Skills and Their Trading By Understanding How To Analyze The Market Using Multiple Timeframes and Understanding The Bigger Picture on the Charts
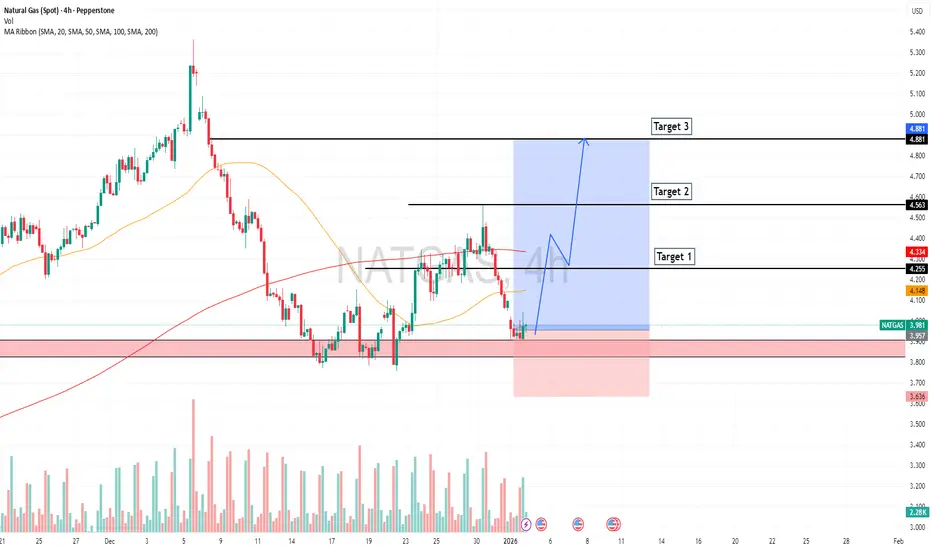
Back in the game baby!I think we are nearly in the clear and back in the game. There will most likely be a pullback, I’m thinking as low as 3.75 in the next 2 days but we may be shifting fully into bull control. With such a huge discrepancy between contracts it is impossible that the next one won’t at least hit $4.2. Winter is here stay warm. Buy all dips from hear until Feb, good luck all.

Natural Gas Stock Forecast | Oil | Dollar | Silver | GoldCatch the latest commodities trading insights! This week's market analysis includes a look at both sides of the coin for oil, gold and silver. Plus, get some helpful technical analysis and trading tips to guide your decisions.
AMEX:UNG Natural Gas stock Bulls NatGas Support & Resistance Guide
NYMEX:CL1! USO Oil Stock price Forecast
DXY US dollar Stock analysis
COMEX:GC1! Gold XAUUSD Stock price Forecast
COMEX:SI1! Silver XAGUSD stock analysis

The Natural Gas Will Jump from a Support LevelHello Traders
In This Chart Natural Gas HOURLY Forex Forecast By FOREX PLANET
today Natural Gas analysis 👆
🟢This Chart includes_ (Natural Gas market update)
🟢What is The Next Opportunity on Natural Gas Market
🟢how to Enter to the Valid Entry With Assurance Profit
This CHART is For Trader's that Want to Improve Their Technical Analysis Skills and Their Trading By Understanding How To Analyze The Market Using Multiple Timeframes and Understanding The Bigger Picture on the Charts

NATGAS Will Grow! Buy!
Hello,Traders!
NATGAS reacted strongly from a higher-timeframe demand zone, showing clear absorption of sell-side liquidity. The impulsive bullish displacement suggests smart money accumulation, with structure now favoring a continuation toward the next upside liquidity pool.Time Frame 3H.
Buy!
Comment and subscribe to help us grow!
Check out other forecasts below too!
Disclosure: I am part of Trade Nation's Influencer program and receive a monthly fee for using their TradingView charts in my analysis.

Weekly Hammer, 2026 Channel Exitthere are two critical levels that must be confirmed. The first is the baseline of the last three months, which represents the structural foundation of the current market phase. The second is the formation of a new baseline for the next three months, a level that will be validated and confirmed later in 2026.
A green hammer candle forming next week is expected to act as the ignition point of this cycle, signaling the start of the move and providing the momentum for the broader formation. This setup points to a strong continuation, with a significant bullish push anticipated in the following week, culminating in a clearly confirmed, strong green candle on the first Monday of 2026.

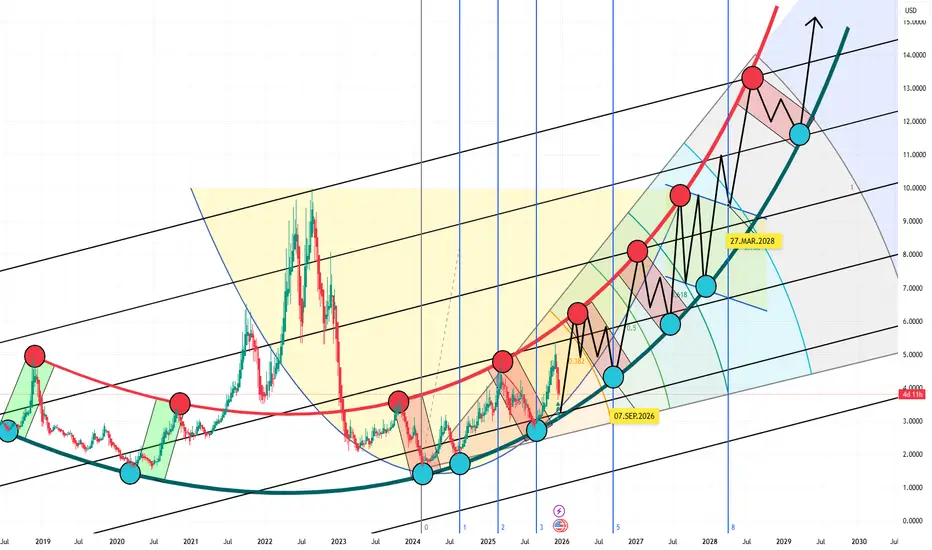
Fibonacci Train Final Boarding: The 2026 RideA decade-long channel of unchanged width explodes into view like a living Fibonacci spiral, price carving its path with surgical precision. It feels as if a master artist is sketching a priceless masterpiece while accelerating his own train—fully in control, no brakes, no hesitation. This is not abstract art; this is pure momentum with intent. Miss a station and you are not late you are gone.
This is the CUP scenario in its raw form: the channel holds its width, at the very least, through 2028, locked in structure and discipline. Every buying stop is irreversible, a one-way decision point. Fibonacci numbers are not guiding this move they are drawing a priceless master piece in real time.
its an absolute not trading advice just a personal imaginary thoughts
Natural Gas Stock Forecast | Oil | Dollar | Silver | GoldCatch the latest commodities trading insights! This week's market analysis includes a look at both sides of the coin for oil, gold and silver. Plus, get some helpful technical analysis and trading tips to guide your decisions.
AMEX:UNG Natural Gas stock Bulls NatGas Support & Resistance Guide
NYMEX:CL1! USO Oil Stock price Forecast
DXY US dollar Stock analysis
COMEX:GC1! Gold XAUUSD Stock price Forecast
COMEX:SI1! Silver XAGUSD stock analysis

The Natural Gas Will Jump from a Support LevelHello Traders
In This Chart Natural Gas HOURLY Forex Forecast By FOREX PLANET
today Natural Gas analysis 👆
🟢This Chart includes_ (Natural Gas market update)
🟢What is The Next Opportunity on Natural Gas Market
🟢how to Enter to the Valid Entry With Assurance Profit
This CHART is For Trader's that Want to Improve Their Technical Analysis Skills and Their Trading By Understanding How To Analyze The Market Using Multiple Timeframes and Understanding The Bigger Picture on the Charts
