USOIL - Bullish Reversal Brewing?Hello Traders!👋
As we close out 2025 and head into the New Year, I'm turning bullish on USOIL (WTI Crude Oil). After a tough year of downside pressure, I see clear signs of a potential trend reversal—here's why:
Technical Overview (Daily/Weekly Timeframe):
Price has firmly bounced from the critical $55 support zone—a multi-year low and psychological floor that's held multiple times this year.
We're seeing fresh buying momentum: Higher lows forming, potential bullish divergence on RSI (oversold conditions easing), and volume picking up on the rebound.
Historically, crude often shifts direction around year-end/New Year—I've observed this pattern over many years, with bounces turning into larger moves as new trends emerge.
Key resistance to watch: $58–60 (recent highs and 50% Fib retracement). A clean break above could confirm bullish continuation.
Why Bullish Now? (My View):
The world is stabilizing: Geopolitical tensions easing (progress on peace talks), which could boost global growth and oil demand in 2026 without extreme risk premiums.
Recent U.S. sanctions on Venezuelan/Russian tankers adding short-term supply tightness, fueling the rebound from lows.
Oversupply fears are priced in at these depressed levels—any positive demand surprise or inventory draws could spark a sharp squeeze higher.
Holding this $55 base feels like a classic bottom, with new buyers stepping in aggressively.
Trade Idea (Bullish Scenario):
Long bias as long as price holds above $55.00.
Potential targets: $58.30 (near-term, 61.8% Fib), $59.20–$60.00 (mid-term), $60.42+ if breaks higher.
Stop Loss: Below $54.90 (recent low) for risk control.
Risk/Reward looks favorable here for swings into the New Year.
Is this the start of a real reversal, or just a temporary bounce in the bear trend? Bulls charging or still cautious on the glut? I will be happy if you will share me your thoughts.
Always make your research!!! This is not financial advice!!!
Natural

Natural Gas (NG): The Freestyle Framework Natural Gas: The Freestyle Landscape
This is not a forecast. It is a dynamic structural map.
Designed for the discretionary trader, this "Freestyle" framework deconstructs Natural Gas into its core technical components: cyclical rhythms, evolving Elliott Wave structures, adaptive price channels, and multi-layered zones of confluence.
We provide the architecture; you dictate the strategy.
Within This Framework, You Will Identify:
- Cyclical Turning Nodes: Time-based projections where trend exhaustion or acceleration is statistically heightened.
- Price Channel Evolution: Visualizing the market's breathing pattern through expanding and contracting volatility corridors.
- Confluence Zones: High-Probability regions where support/resistance, Fibonacci projections, and channel boundaries cluster, defining the market's true decision points.
- Momentum & Risk Gradients: Areas shaded for potential trend acceleration or reversal, framing asymmetric risk/reward opportunities.
The Core Philosophy: Trade Context, Not Clarity.
This map eliminates the noise of directional bias. Instead, it provides a professional-grade canvas to:
Plan high-probability setups within predefined zones.
Anticipate volatility shifts before they occur.
Objectively manage risk by highlighting invalidation levels.
Align your unique strategy (swing, position) with the market's inherent structure.
Disclaimer: This analysis is for informational and educational purposes only. It is a framework for context, not a substitute for independent analysis. All trading decisions and risk management are solely the responsibility of the individual. Past performance is not indicative of future results.
Trade The Reaction. Navigate The Structure.

Natural Gas Week 50: -183 BCF Draw – Coldest Start in Years*Due to the platform's features, the charts are arranged in sequence from left to right, from the first to the ninth chart. The charts were created by our team and based on an analysis from Bloomberg and the EIA data. This analysis was conducted in cooperation with Anastasia Volkova, analyst of LSE.
Natural gas entered Week 50 with a historic shift, as the EIA reports a record 183 BCF storage withdrawal for Week 49 (December 5), crushing the 5-year average draw of -72 BCF and leaving inventories at 3,740 BCF-34 BCF below 2024 but still 56 BCF above the median. Cold weather and peak LNG exports earlier drove January futures above $5/MMBtu, but softening forecasts for mid-December have triggered profit-taking, easing near-term prices while 2026-27 contracts hold above the interquartile range.
Current prices compared to price dispersion 10 days before expiration by month since 2010
Last week, cold weather and record LNG flows provided strong support for prices. The situation has now evolved, with signs of a correction due to profit-taking and a softening of weather forecasts for the second half of December. However, fundamental drivers (a prolonged cold spell in key regions, peak LNG exports, and growing demand from the energy sector) remain in place and are keeping 2026 and 2027 contract prices above the interquartile range.
Forward curve compared to 2020-2025
The shape of the 2025 forward curve on nearby contracts is once again approaching the 2023–2024 ranges. Despite high volatility on nearby contracts, contracts with delivery in two years and beyond continue to show clear price stabilization at historically stable levels.
Current stocks and forecast for next week compared to 2020-2024
According to the forecast for week 49 (EIA report dated December 5), gas reserves in underground storage facilities will decrease by a record 183 BCF, which is 111 BCF below the average for the past five years. At the same time, reserves will reach 3,740 BCF, which is 34 BCF lower than in 2024, but 56 BCF higher than the five-year average.
HDD+CDD based on current NOAA data and forecast for the next two weeks compared to 1994-2024
Currently, the total HDD + CDD (heating and cooling degree days) indicators for all climatic regions of the United States are within the moderate range relative to the 30-year climate norm. According to meteorological model forecasts, degree days are expected to increase after December 11, reaching maximum levels by December 14-15, after which they will begin to decline, and by December 17-19, values may fall below seasonal norms.
HDD+CDD based on current NOAA data and forecast compared to 1994-2024 by region
As of December 10, another peak in degree days is expected in the coming week, with values exceeding the upper interquartile range in the central regions of EN, ES, WN, WS, and South Atlantic. After December 18, the weather is expected to stabilize and return to average levels and below.
Daily supply/demand difference compared to 2014-2024
On December 10, the difference between supply and demand in 2025 declines after abnormal growth and approaches the upper interquartile range for 2014–2024.
Number of days for delivery from warehouses
The graph shows the number of days of supply based solely on storage reserves, at current consumption levels. As of December 10, reserves are sufficient for approximately 27 days, which is three days less than in 2024, seven days below the average, and at the lower end of the 10-year range. With this level of reserves and consumption, even minor disruptions in production or spikes in demand could cause sharp price reactions, especially in late winter and early spring.
Filling level of European storage facilities
The overall fill rate of European gas storage facilities as of December 10 continues to decline and stands at 71.5% (-4.4% over the week), which is 10.5% below the average fill rate and 10% lower than last year.
Electricity generation by source
Compared to last week, gas generation in the US48 energy balance fell to 38.4% of the total (-5% over the week) on December 10, 2025. The share of nuclear generation remains around 18-19% and is below the 5-year low. The share of coal generation has grown and remains at an average of 19-20%. The share of wind (11.3%) and solar (4.0%) has increased slightly compared to last week.

Hitting prior highs…Ok so I’m thinking we break this top as a fake out for bulls to get momentarily trapped. We will break the high earlier this month then bulls will pile in, price will pullback over the next day or two then we will continue our way toward $5 and above. Major move happened last week and I think there may be some refuel and exhaustion at the start of the week. I started a short to scalp but will be closing it immediately upon profit. Looking to pile in and rebuy when this contract retraces to 4.6ish.

A lot happening…Greater uptrend channel still in tact. New downtrend channel in formation but will probably be negated due to the shifting 4 hour timeframe. I think this contract will settle around 4.5 at expiration and the next contract (Jan) will drop like a rock on the switch. I am buying shorts for Jan 4.7 and above. And buying longs for this contract anything below 4.3

The Natural Gas Will Jump from a Support LevelHello Traders
In This Chart Natural Gas HOURLY Forex Forecast By FOREX PLANET
today Natural Gas analysis 👆
🟢This Chart includes_ (Natural Gas market update)
🟢What is The Next Opportunity on Natural Gas Market
🟢how to Enter to the Valid Entry With Assurance Profit
This CHART is For Trader's that Want to Improve Their Technical Analysis Skills and Their Trading By Understanding How To Analyze The Market Using Multiple Timeframes and Understanding The Bigger Picture on the Charts
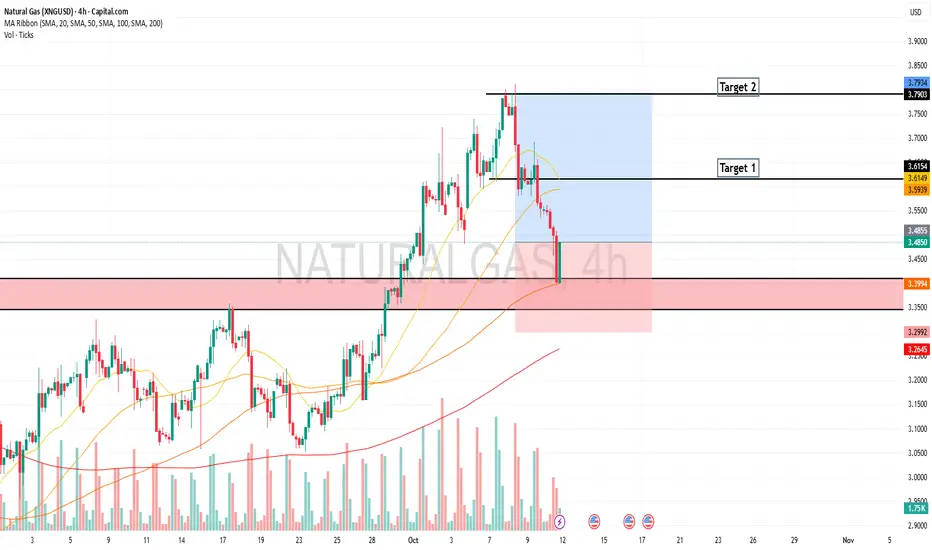
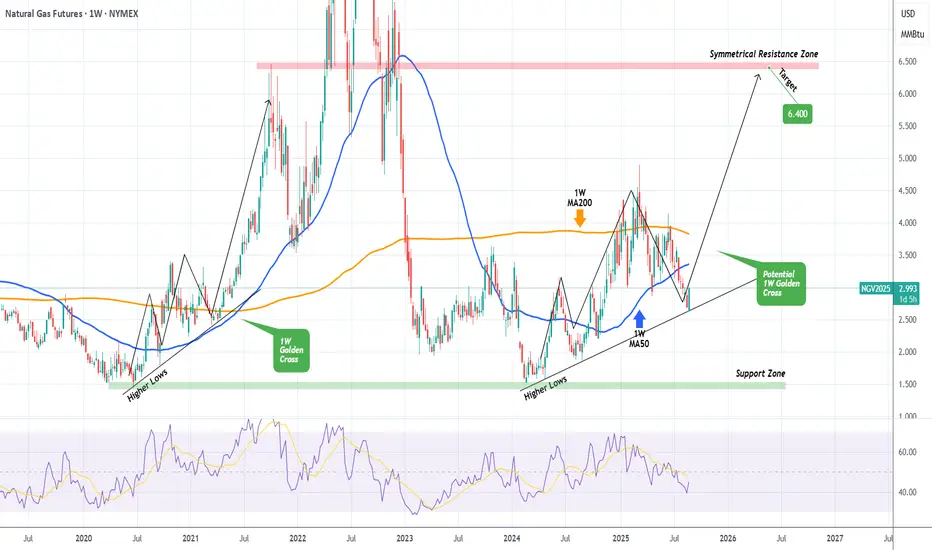
NATURAL GAS rebounding on a 1.5-year Support! Bullish.Natural Gas (NG1!) is having a strong green 1W candle, coming off a 2-month decline. It is highly likely that this correction has come to an end as the price hit this hit (and thus rebounding on) the Higher Lows trend-line that started all the way back since the February 20 2024 market bottom.
Technically the whole pattern from that day until now looks similar to the June 22 2020 - March 15 2021 sequence, which initiated a stronger 3rd Bullish Leg all the way to the Symmetrical Resistance Zone.
A potential 1W Golden Cross would confirm this upward break-out, just like it did on June 14 2021.
If that takes place, our long-term Target would be 6.400 (Symmetrical Resistance Zone).
-------------------------------------------------------------------------------
** Please LIKE 👍, FOLLOW ✅, SHARE 🙌 and COMMENT ✍ if you enjoy this idea! Also share your ideas and charts in the comments section below! This is best way to keep it relevant, support us, keep the content here free and allow the idea to reach as many people as possible. **
-------------------------------------------------------------------------------
💸💸💸💸💸💸
👇 👇 👇 👇 👇 👇
NATGAS Risky Short! Sell!
Hello,Traders!
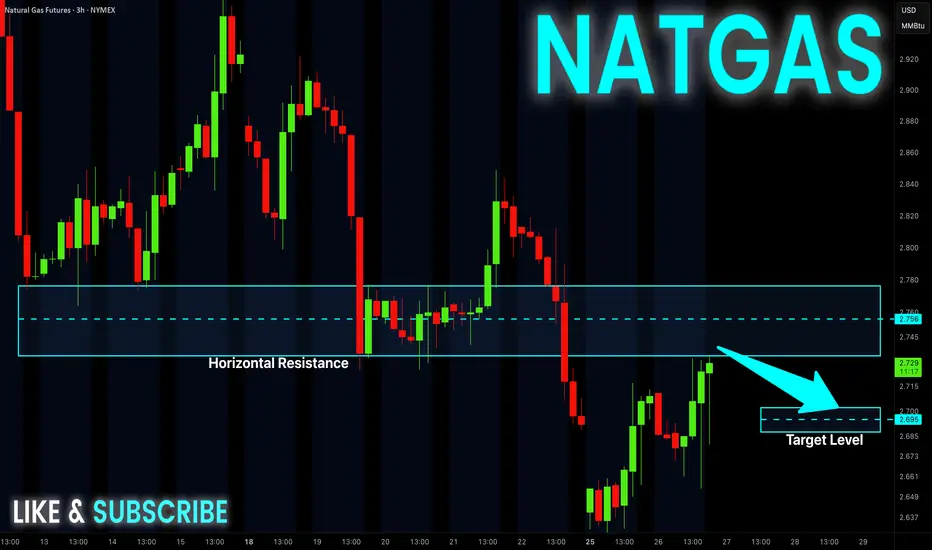
NATGAS is trading in a
Downtrend and the price
Is making a local rebound
And will soon hit a horizontal
Resistance of 2.76$ from where
A local bearish correction
Is to be expected
Sell!
Comment and subscribe to help us grow!
Check out other forecasts below too!
Disclosure: I am part of Trade Nation's Influencer program and receive a monthly fee for using their TradingView charts in my analysis.
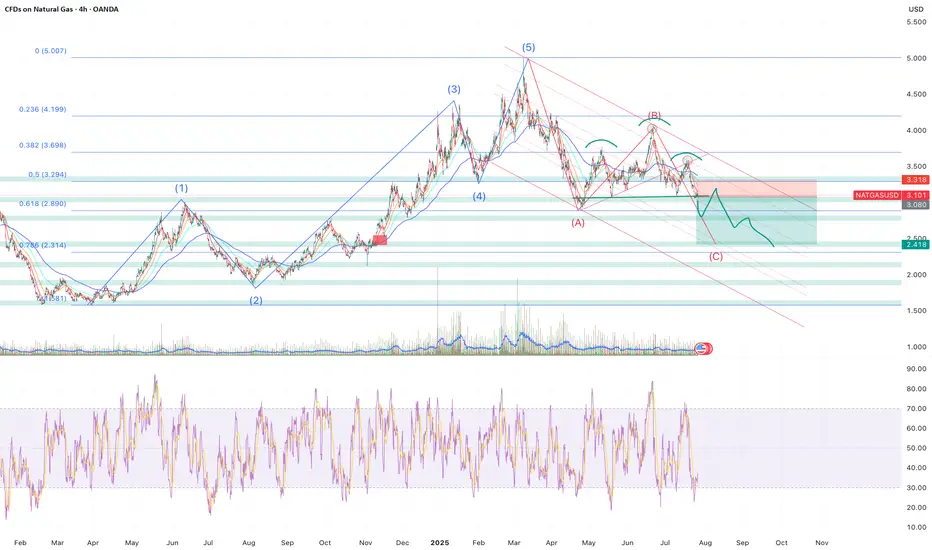
Sell NATGAS into OCT/NOVNatalie has fromed a H&S and has broke through all of the supporting EMAs leading to most of the indicators turning bearish.
My approach for the forseeable is seeling bounces until the winter season approaches.
Of course Natalie is extremely susceptible to trend changes due to economical data and has to be monitored closely. Currenlty I'm a bear.
Only selling once it breaks and retests, where I will once again reasses based on economics such as storage, production, imports and demand.
Target around $2.5 where interestingly a gap (red rectangle) sits from Nov - 24.
Elliot Wave (although not a great fan) kind of aligns as well as the 0.786 fib level which began forming at the beginning of 2024.
Storage | Volatility | Price Outlook
U.S. natural gas markets are stabilizing as volatility trends back toward seasonal norms.
📉 Volatility has dropped from 81% in Q4 2024 to 69% in mid-2025
🏪 Storage is currently at 3,075 Bcf,
🔻 4.7% lower YoY
🔺 5.9% higher than the 5-year average
🚢 LNG exports remain strong—up 22% YoY and 74% above the 5-year average
🔌 Domestic demand is seasonally weaker but steady
➡️ Despite being below last year’s levels, storage surplus vs. the 5-year average acts as a soft ceiling on price.
➡️ Historical analogs suggest a fair value range between $2.50–$3.20/MMBtu in the short term.
📊 Current price action around $3.00–$3.40 looks slightly overheated unless a fresh catalyst emerges (heatwave, export spike, etc.).
🧭 Watching for:
Injection trends over the next few weeks
Cooling demand in power sector
Resistance around $3.40
Support near $2.80
Crude Oil Spikes - Russia / Ukraine / USA sanction? Concerns about the possibility of tighter global oil supplies are supporting crude prices after President Trump warned of "secondary sanctions" if Russia fails to reach a ceasefire in Ukraine within 10 to 12 days.
These sanctions have absolutely burned the shorts in oil and can cause a 3 bar surge on the daily chart if crude breaks this channel.
Keep you eye on the daily 200 MA...if it holds above we should push higher on crude.
FOMC RATE DECISION TOMORROW - Tune into our live stream.

Navigating a Pullback in Natural GasNatural gas prices have been on a wild ride lately, with a recent pullback raising questions about the future of this energy source. This video provides insights into navigating this market volatility, offering actionable strategies for live trading in the midst of uncertainty.
Current weather forecasts for the U.S. show neither extreme heat nor cold—limiting heating or cooling demand. This typical spring-to-summer lull supports low prices .
Although rig counts in the U.S. are falling—the latest count shows an 8‑week decline—production remains ample. Storage levels remain healthy, and oversupply worries persist .
Natural gas rallied earlier today but faced resistance at the $4/mmBtu mark—a major psychological barrier. After hitting that ceiling, prices gave back gains, a typical sign of "rally exhaustion"

Bearish Forecast for the Dow Jones Starting May 15, 2025Bearish Forecast for the Dow Jones Starting May 15, 2025
The Dow Jones Industrial Average is poised to begin a significant decline, potentially as early as today, May 15, 2025, targeting a retest of the price low from April 7, 2025 (~36,611.78), and possibly lower. This movement is driven by renewed trade tensions, disappointing economic data, and bearish market sentiment.
1. Fundamental Factors Driving Potential Decline
Fundamental factors provide the macroeconomic and policy-driven rationale for the anticipated downturn in the Dow Jones.
1.1. Renewed Uncertainty in Trade Policy
The Dow’s rally on May 12–13, 2025, was fueled by optimism over a temporary U.S.-China tariff reduction agreement (90-day truce) announced after talks in Switzerland on May 11, 2025. However, as of May 15, 2025, investor confidence is faltering due to a lack of progress in ongoing U.S.-China trade negotiations.
Trigger for May 15: A Reuters report from May 14, 2025, notes that U.S. Trade Representative Jamieson Greer and Treasury Secretary Scott Bessent are meeting with Chinese officials, but no new agreements have been confirmed. If today’s talks fail to deliver positive outcomes or if President Trump escalates tariff rhetoric, the Dow could plummet, as seen in early April when tariffs triggered a 5.5% single-day drop. The Dow, with its heavy weighting of multinational corporations, is particularly vulnerable to trade war fears, which could drive it toward the April 7 low as investors price in higher costs and slower global growth.
1.2. Disappointments in Economic Data
CPI Reaction: The April 2025 Consumer Price Index (CPI), released on May 14, 2025, showed inflation at 2.3% annually, below the expected 2.4%. However, the Dow’s decline (-0.6%) on May 14 suggests investors expected a lower figure to support Federal Reserve rate cuts, reflecting skepticism about inflation cooling further.
Producer Price Index (PPI) Release on May 15: The PPI for April 2025, due at 8:30 AM ET (2:30 PM CEST) on May 15, 2025, is critical. A higher-than-expected PPI, potentially driven by tariff-related cost pressures, could signal rising consumer prices, reducing hopes for Fed easing and triggering a sell-off. Consensus expects a 0.2% monthly increase; a reading above 0.3% could echo the April market reaction when GDP contraction fears pushed the Dow to 36,611.78.
Consumer Sentiment: The University of Michigan Consumer Sentiment Index for May 2025, released on May 14, likely showed continued weakness (April: 52.2, a multi-year low). A further decline could heighten concerns about reduced consumer spending, impacting Dow components like Walmart and Home Depot.
1.3. Concerns Over Federal Reserve Policy
On May 7, 2025, Fed Chair Jerome Powell cited “elevated uncertainty” due to trade policies, with markets expecting 75 basis points of rate cuts in 2025, starting in July. If today’s PPI or Initial Jobless Claims (8:30 AM ET) indicate persistent inflation or economic weakness, rate cut expectations could fade, increasing borrowing costs and pressuring Dow valuations, mirroring the April 7 recession fears.
2. Technical Analysis
The Dow’s initial decline in April was approximately -19.00%, with a second impulse of similar magnitude. Technical indicators suggest a bearish setup for May 15, 2025:
Current Level: The Dow closed at 42,051.06 on May 14, 2025, down 0.6%, testing support at 42,000.
Bearish Signals: A 12-hour timeframe analysis indicates alignment for a decline, with potential bearish candlestick patterns (e.g., bearish engulfing) and overbought RSI (70). A break below 42,000 could target the 200-day moving average (40,500) and the April 7 low of 36,611.78.
Price Targets:
Retest of April 7, 2025, low: ~36,611.78
Secondary target: ~35,970.70 (based on Fibonacci extensions and prior support zones).
3. Market Sentiment and Behavioral Factors
Fragile Optimism: The Dow’s 15% recovery from April lows was driven by trade truce hopes and select stock strength. Bloomberg’s May 14, 2025, report notes Wall Street’s rebound is “showing signs of exhaustion” due to trade risks. The Dow’s May 14 weakness, led by an 18% UnitedHealth drop, could spread if negative news emerges today.
Global Correlation: Mixed Asian market performance on May 14 (e.g., Nikkei up 1.43%, India’s Nifty 50 down 1.27%) suggests vulnerability. A lower Asian open on May 15, driven by U.S. declines or trade news, could amplify selling pressure on the Dow.
4. Evidence-Based Framework for the Forecast
4.1. Catalysts for Today’s Decline (May 15, 2025)
PPI Data (8:30 AM ET): A PPI reading above 0.3% could signal sticky inflation, reducing Fed rate cut odds and sparking a sell-off.
Trade Talk Updates: Negative U.S.-China trade comments (e.g., no Geneva deal) could reignite fears, mirroring April 7.
Initial Jobless Claims (8:30 AM ET): Claims above 220,000 (vs. prior 211,000) could signal labor market weakness, fueling recession concerns.
4.2. Dow Scenario
Expect a wave-like decline with corrections. The Dow could fall below 36,611.78, potentially reaching ~35,970.70 if trade and economic pressures intensify. Extreme caution is advised in 2025.
4.3. Global Scenario for S&P 500
I anticipate a wave-like decline with intermittent corrections. I wouldn’t be surprised if the S&P 500 falls below 4,700, potentially reaching 4,200. Extreme caution is warranted this year. There’s even a theory that, starting in 2025, the U.S. dollar could lose 50% of its purchasing power.
Idea:
New Screenshot:
4.4. Oil and Geopolitical Outlook
I expect oil (Brent) to decline to the $50+/- range, from which an upward trend may begin, potentially tied to future military conflicts:
· Europe vs. Russia
· India vs. Pakistan
· Iran vs. Israel
Brent (UKOIL):
Natural Gas:

E-cutieAll year EQT, an unloved natural gas producer has been a swing trader's paradise. I've harvested so many gains from these E-cutie trees I thought I'd make a thread just for it and post trading updates.
The macro technical picture is clear. Years of being battered by shorts ended with capitulation in 2020, followed by a swift rebound. Fundamentals are tightening. According to analysts, $25 is fair price for $2.50 NG price. Goldman Sachs has a $23ish target. Price action is showing signs of bottoming. It's lining up but this is much more profitable short term swings.
Currently, price is building a base at previous long term support around $18. More downside is certainly a possibility given that NG prices look overvalued. But, EQT is in a channel and fundamentally undervalued. Investors might front run this sector as demand picks up in later in the year, in which EQT will likely be closer to $25.
s3.tradingview.com
Long EQT
+200 @ 18.10

NATGAS Will Grow! Buy!
Hello,Traders!
NATGAS made a retest of
The horizontal support level
Of 3.00$ and we are already
Seeing a local bullish rebound
So we will be expecting a
Further bullish move up
Buy!
Comment and subscribe to help us grow!
Check out other forecasts below too!

NATGAS REBOUND AHEAD|LONG|
✅NATGAS is approaching a demand level around 3.00$
So according to our strategy
We will be looking for the signs of the reversal in the trend
To jump onto the bearish bandwagon just on time to get the best
Risk reward ratio for us
LONG🚀
✅Like and subscribe to never miss a new idea!✅

Will the Perfect Storm in Natural Gas Markets Lead to a New EnerIn an era of unprecedented global energy transformation, the natural gas market stands at a critical juncture where geopolitical tensions, technological advancement, and infrastructure development converge to create a potentially game-changing scenario. The ongoing Middle East crisis, particularly the Israel-Iran tensions threatening the Strait of Hormuz, could reshape energy flows and trigger a cascade of effects across interconnected global energy markets, potentially forcing a fundamental reassessment of natural gas's role in the global energy mix.
A seismic shift is approaching in North American markets with LNG Canada's anticipated 2025 launch, which promises to revolutionize Canadian gas pricing dynamics and global market access. This transformation coincides with an extraordinary surge in potential demand from AI and data centers, projected to consume between 3 and 30 billion cubic feet per day of additional North American gas. Such technological evolution, coupled with Asia's growing appetite for cleaner energy sources, suggests a structural reformation of traditional gas flow patterns and pricing mechanisms.
The convergence of these factors presents both challenges and opportunities for market participants. While weather patterns and storage dynamics continue to influence short-term price formation, longer-term strategic considerations are increasingly dominated by infrastructure development, market access, and geopolitical risk management. As the industry adapts through strategic hedging, infrastructure investment, and consolidation, the natural gas market appears poised for a period of dynamic evolution that could fundamentally alter its global value proposition and establish a new paradigm in energy markets.

UNG to $60 ...... is the idea...... UNG is the way to play Nat Gas.
Nat Gas traders fir under production costs at $6.5 to $7.5 per BTU - UNG at $6.5 per BTU will trade above $60
Nat Gas is cyclical, it moves in 4 year intervals, perfect to start the move Up now.
Please research my findings.
Cyclicality of the NAt Gas Market
Nat Gas is industry's energy
Nat Gas is the cleanest form of fossil fuel energy.
Nat Gas goes for $67 per BTU in Europe, the USA needs to be selling Nat Gas.
Many other positive things about NAT GAS and its required expansion.
We need Nat Gas and plenty of it.

NATGAS - Descending Triangle Hello Traders !
On Tuesday 11 June, The NATGAS reached a resistance level (3.006 - 3.046).
The price formed a descending triangle pattern.
At the moment, The support level is broken !
So, I expect a bearish move📉
______________
TARGET: 2.440

Natural Gas Trade IdeaNG - Natural Gas is approaching a sell zone.
Let the GAP close and look for a price near the 88.6 FIB level for a retracement down.
As always, secure 20 PIPS!
Share your thoughts.
The Professor

NATTY down for a breather NATTY is extremely overextended and finds itself on the 0.5 Fib retracement after accumulating a substantial bearish divergence on the 4hr.
After breaking out of the cup & handle, it has yet retested those areas which it will IMHO.
NATTY often peaks in the middle of May which is often followed my strong consolidation into May, before it really gets going in June/July.

✅NATGAS SHORT FROM RESISTANCE🔥
✅NATGAS made a massive
Gap up from the support
But after the gap the price
Immediately hit a horizontal
Resistance level of 2.00$
From where we are already
Seeing a bearish reaction
And I think that we will see
A further move down next week
SHORT🔥
✅Like and subscribe to never miss a new idea!✅

NATGAS Swing Long Trade! Buy!
Hello,Traders!
NATGAS has retested a massive
Horizontal support level of 1.450$
And already made a rebound
So we will be expecting a
Further move up
Buy!
Like, comment and subscribe to help us grow!
Check out other forecasts below too!

NATURAL GAS - WEEKLY - READY FOR A BREAKOUT?NATURAL GAS - WEEKLY - READY FOR A BREAKOUT?
TF-WEEKLY.
More bullish after breakout and confirmation.
