Natural Gas Volatility Compression Precedes Breakdown🔻 NATURAL GAS (XNG/USD) – Bearish Breakdown Setup | Day & Swing Trade
Asset: XNG/USD – Natural Gas vs U.S. Dollar (Commodities CFD)
Market Type: Energy Commodities
Timeframe: Intraday → Swing
📉 Trade Bias
Primary Bias: Bearish continuation
Market structure shows distribution near resistance, with sellers defending the upper zone. Momentum remains capped below dynamic averages.
🧠 Technical Plan
Setup Type: Trend continuation (Break & Hold)
Indicator Focus: TMA (Triangular Moving Average)
Price is waiting for confirmation via TMA breakdown
Volatility compression hints at an expansion move lower
🎯 Entry Strategy
🟢 Entry Method:
Sell AFTER confirmed TMA moving-average breakout
Trigger Zone: Around 3.200
Execution: Market or pullback entry after MA break
(No forced entries — patience = edge)
🎯 Profit Target
🎯 Primary Target: 2.800
🛑 Why this level?
Acts as a “police force” resistance-turned-support
Previous overbought & bull-trap zone
Smart money likely to book profits here
⚠️ Partial profits recommended — scale out, don’t be greedy.
🛑 Stop Loss (Risk Control)
🔴 Protective Stop: 3.600
This is a defensive SL, not financial advice.
Capital protection comes first — survival beats hero trades.
🔗 Correlated Markets to Watch
Keep an eye on these instruments for confirmation or divergence:
DXY ( AMEX:USD Index) – Strong USD = pressure on commodities
WTI Crude Oil (USOIL) – Energy sector sentiment spillover
XAU/USD (Gold) – Risk-off flows vs commodity demand
S&P 500 ( SP:SPX ) – Risk appetite correlation
US10Y Treasury Yield ( TVC:TNX ) – Macro pressure on energy pricing
📌 If USD strengthens + yields rise → bearish NATGAS bias strengthens.
🌍 Fundamental & Economic Drivers (Key Focus)
Bearish factors currently influencing Natural Gas:
Seasonal demand normalization (post-peak heating demand)
High storage levels vs historical averages
Stable to increasing U.S. production output
USD strength weighing on dollar-denominated commodities
Upcoming catalysts traders should monitor:
🗓 U.S. Natural Gas Storage (EIA Weekly Report)
🗓 U.S. CPI / PPI inflation data
🗓 Federal Reserve policy tone & rate expectations
🗓 Weather outlook updates (temperature deviations)
⚠️ Volatility spikes expected around EIA release days — manage exposure accordingly.
🧾 Final Notes
This setup is confirmation-based, not prediction-based
Trade what the market shows, not what you hope
Risk management > entry precision
💬 If the TMA breaks — sellers take control.
👍 Like | 💬 Comment | 🔁 Share if this plan adds value to your trading playbook.
Naturalgasanalysis

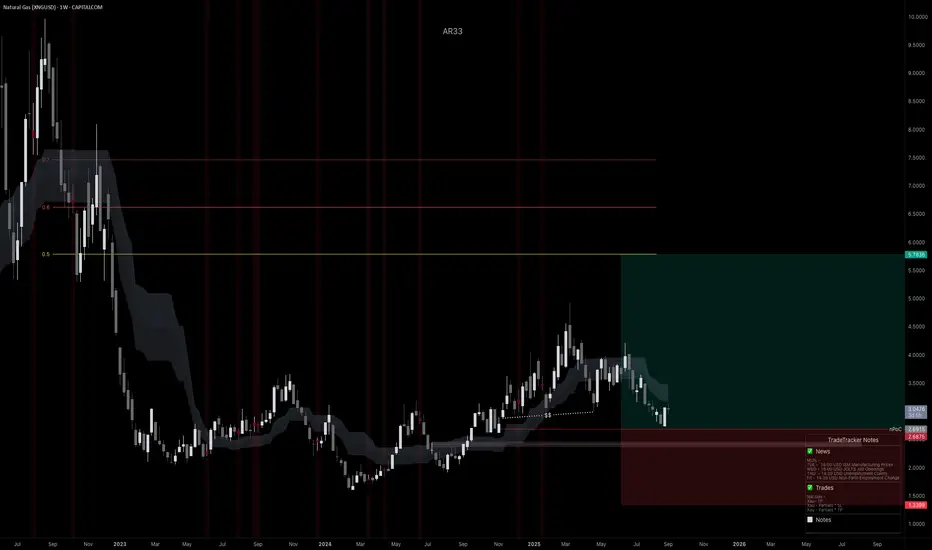
Weekly Hammer, 2026 Channel Exitthere are two critical levels that must be confirmed. The first is the baseline of the last three months, which represents the structural foundation of the current market phase. The second is the formation of a new baseline for the next three months, a level that will be validated and confirmed later in 2026.
A green hammer candle forming next week is expected to act as the ignition point of this cycle, signaling the start of the move and providing the momentum for the broader formation. This setup points to a strong continuation, with a significant bullish push anticipated in the following week, culminating in a clearly confirmed, strong green candle on the first Monday of 2026.

Natural Gas Market Signaling a Fresh Bullish Opportunity?🔥 XNG/USD – Natural Gas Bullish Swing Trade Play | Energy Momentum Setup 🔥
📌 Asset
XNG/USD – NATURAL GAS
Energies & Commodities Market
⏳ Trade Type: Swing Trade
🧭 Market Plan
📈 Bullish Bias Active
Natural Gas is showing upside continuation potential, supported by energy-sector momentum and price acceptance above key demand zones. Bulls are currently in control while volatility expands.
🎯 Entry Strategy
🟢 Flexible Entry Allowed
You may enter from any favorable price level, aligned with your own execution model.
This setup supports scaling or single-entry styles, depending on risk preference.
🛑 Stop Loss
🔻 Reference SL: 3.500
⚠️ Risk Note:
Dear Ladies & Gentlemen (Thief OG’s),
This is not a mandatory stop loss. Always adjust your SL based on:
Position size
Volatility
Personal risk management rules
💡 Capital protection comes first.
🏆 Profit Targets
🎯 Target 1: 4.500
🎯 Target 2: 5.200
📊 Why Take Profits Here?
Strong historical resistance zones
Overbought conditions likely near targets
Liquidity traps often appear at these levels
➡️ Book profits smartly and don’t get greedy.
⚠️ TP Disclaimer:
This is a guideline, not a command. Secure profits based on your own strategy.
👀 Related Assets to Watch (Correlation Check)
⛽ WTI Crude Oil (USOIL / WTI)
Positive sentiment in energy markets often supports Natural Gas
Rising oil prices can lift overall energy demand expectations
🛢️ Brent Crude (UKOIL)
Global energy benchmark
Strength in Brent usually confirms broad energy-sector bullishness
🇺🇸 DXY – U.S. Dollar Index
Natural Gas is USD-denominated
Weak USD = tailwind for commodities
Strong USD may slow upside momentum
📊 Energy Sector Index / Energy Stocks
Institutional flows into energy equities often precede commodity strength
Watch for sector-wide risk-on behavior
🧠 Final Notes
✅ Trade with confirmation
✅ Respect volatility
✅ Manage risk aggressively
✅ Profits > Ego
If this idea adds value, hit 👍 Like, 💬 Comment, and ⭐ Follow to stay ahead of smart money moves.
Trade safe & trade sharp. 🚀💰

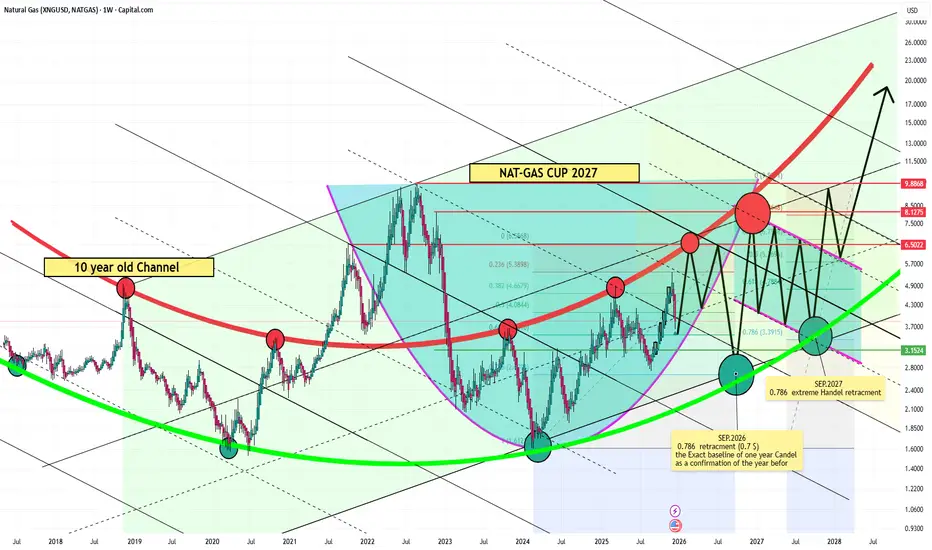
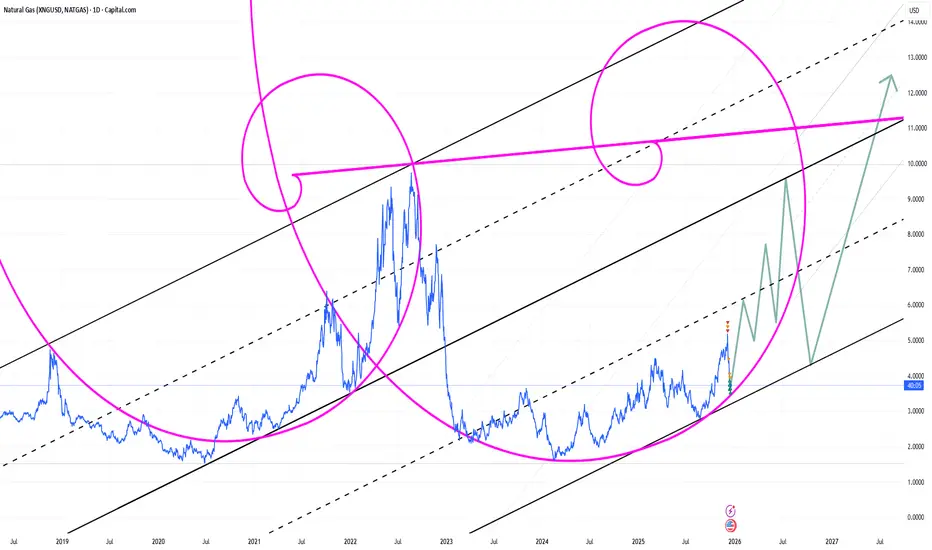
Fibonacci Train Final Boarding: The 2026 RideA decade-long channel of unchanged width explodes into view like a living Fibonacci spiral, price carving its path with surgical precision. It feels as if a master artist is sketching a priceless masterpiece while accelerating his own train—fully in control, no brakes, no hesitation. This is not abstract art; this is pure momentum with intent. Miss a station and you are not late you are gone.
This is the CUP scenario in its raw form: the channel holds its width, at the very least, through 2028, locked in structure and discipline. Every buying stop is irreversible, a one-way decision point. Fibonacci numbers are not guiding this move they are drawing a priceless master piece in real time.
its an absolute not trading advice just a personal imaginary thoughts
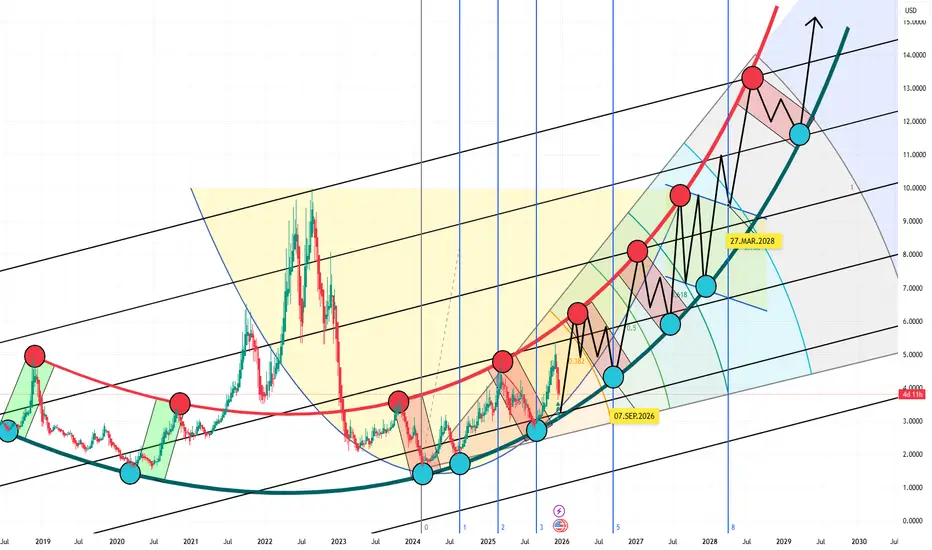
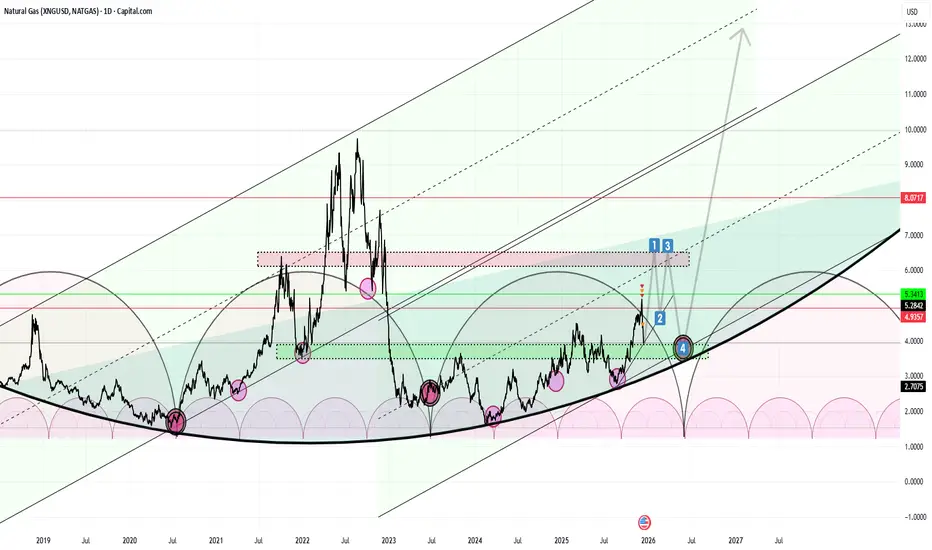
Fibonacci Time Zone Confirmation ((07.SEP.2026 and 27.MAR.2028))Fibonacci Time Zone confirmation of the optimal and lowest buying opportunities within the extended 10-year bullish channel, aligned with the formation of a cup pattern that is projected to complete in 2028, with 27.March.2028 appearing to represent the absolute low, the launch point, and a level from which price is not expected to return.

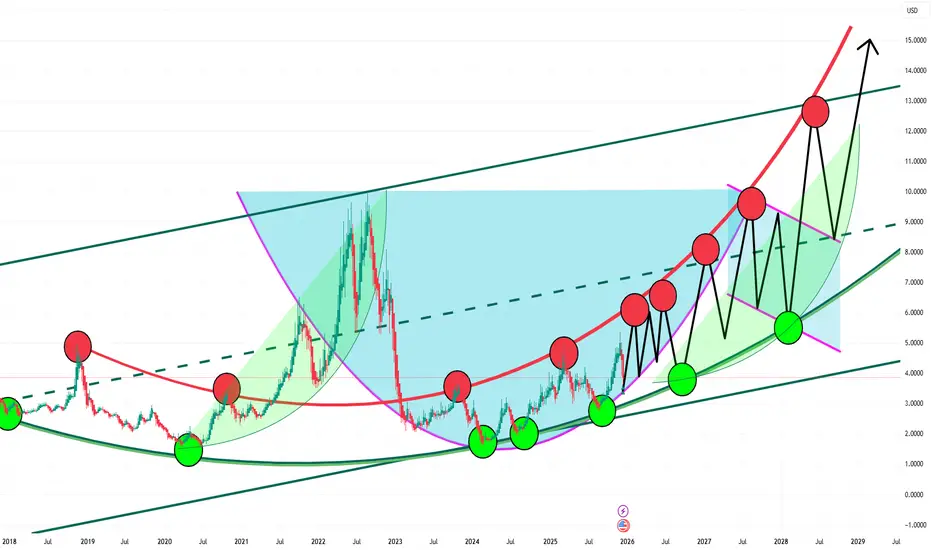
0.5 Fibonacci Retracment version of the Cup0.5 Fibonacci Retracment version of the Cup within the limits of the extended blulish Channel
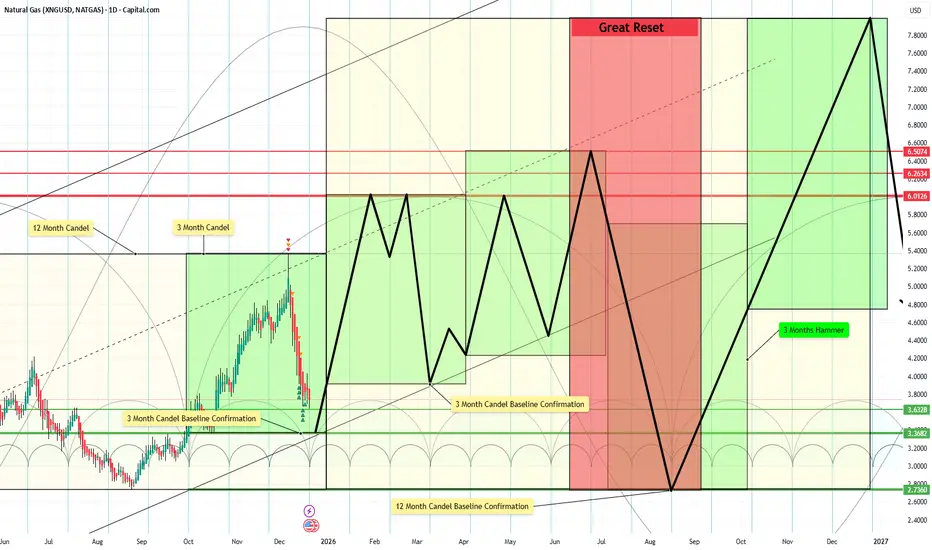
3Month and 12 Month Candels retest and RetrecmentThe 3-month and 12-month candle retest and retracement concept is a higher-timeframe market analysis approach that focuses on how price reacts after forming major quarterly and yearly candles. The high, low, open, and midpoint of these candles function as critical structural levels that often act as magnets for price.
After a candle closes, price frequently retests these levels in subsequent periods before continuing in the prevailing trend, reflecting institutional participation and liquidity rebalancing. Retracements toward these higher-timeframe levels are considered a natural and necessary process within trending markets.
At the end of major sell cycles, a strong retracement is expected, as selling pressure becomes exhausted and liquidity conditions shift. These deeper retracements often target the candle open or midpoint and may mark the transition from distribution to accumulation, preceding trend stabilization or reversal. This behavior provides valuable context for identifying high-probability zones for long-term positioning and risk control.
A 10 Year Old Structural Roadmap to the 2027 BreakoutExecutive Market Thesis: Structural Regime Shift & Multi-Year Cycle Alignment
The market is completing a transition from a multi-year consolidation regime into a confirmed bullish expansion phase. This conclusion is derived from the confluence of long-term structural integrity, institutional footprint analysis, and precise technical invalidation levels.
1. Primary Trend Confirmation & Structural Validation
A decade-long series of higher lows has established a durable demand baseline, confirming sustained institutional accumulation and validating the underlying long-term bullish trend structure. This is not a speculative rally, but the maturation of a prolonged re-accumulation cycle.
2. High-Confluence Inflection Zone
The current breakout originates from a high-confluence technical node: the intersection of a long-term descending channel resistance with key Fibonacci extension clusters. This zone represents a clear inflection point, denoting a confirmed shift in market control from supply to demand.
3. Fibonacci Validation of the Accumulation Base
Deep Fibonacci retracement levels (notably the 0.618 and 0.786) have held across multiple cycle tests. This price action confirms the existence of a robust institutional accumulation base, providing a structurally sound foundation for the next expansion phase.
4. Critical Threshold: The 2026 Annual Candle
The 2026 annual candle close relative to the 2025 baseline is paramount. It serves as the primary structural confirmatory signal. A decisive weekly close below this level would invalidate the bullish structure, likely triggering an accelerated downward move as major distribution cycles align. The 0.786 Fibonacci retracement level is the key technical level to monitor for this potential breakdown.
5. Institutional Footprint at the Cycle Low
Volume-profile analysis and price action at the "cup" formation low exhibit classic institutional accumulation signatures—characterized by elevated volume on absorption, not distribution. This indicates "smart money" positioning ahead of the public trend transition.
6. Forward Projection: The 2027 Handle & Breakout Thesis
2027 is projected to finalize the multi-year "handle" formation—a period of controlled consolidation designed to:
Absorb residual overhang from late-cycle entrants.
Allow for the distribution of trapped supply.
Enable institutional conviction to build beneath the surface.
7. Strategic Entry Zone: Q3-Q4 2027
SEP 2027, concurrent with the 0.786 Fibonacci retracement level, is identified as the final strategic accumulation zone before the anticipated structural breakout. This level represents the last high-probability, high-reward entry point for aligning with the new cycle.
8. Anticipated Resolution: The 2027 Expansion Trigger
A decisive weekly close above the multi-year consolidation range in late 2027 is expected to signal the exhaustion of available supply and full institutional demand dominance. This event should catalyze the next validated expansion phase, marking the beginning of a clear, momentum-driven leg in the broader cycle.
Risk Management Note: The thesis is invalidated by a sustained loss of the 2026 annual baseline (monitored via weekly closes). The 0.786 Fib serves as the final defensive line for long-term positioning.
Remember the Septembers (( SEP.2026 and SEP 2027 ))SEP.2026 and SEP 2027 two no turning points in the most timely correct virsion of the Cub and Handel formation till now.
This observation has crossed a threshold.
It is no longer merely "trading ideas" or speculative commentary.
We are witnessing the most structurally significant formation of the cycle a multi-stage Handle and Channel Convergence setting the stage for a historic move.
The alignment of a historic Cup & Handle replication, within a 10-year Fibonacci framework, at the meeting point of macro channels, creates a scenario that demands a higher level of consideration. It presents a probability that is now too significant to ignore.
Phase 1: The Final Exhaustion Drop
Price is rejected from the massive 7.5-8.0 resistance wall. This isn't just a normal pullback.
Why it drops fast: This sell-off represents the final liquidation wave of the previous bear cycle. Weak hands capitulate, and late sellers scramble for the exit, creating a sharp, high-volume descent into the formation. This rapid drop is necessary to flush out the last remnants of selling pressure.
Phase 2: The Energy Channel (The "No-Return" Zone)
The price enters the Handle channel, a defined equilibrium zone where the final sell orders are absorbed.
This is where the major trend channels converge. Once price consolidates here and breaks north, there is no logical support left to retest—it becomes a one-way trajectory. The "no-return point."
Phase 3: The Launchpad
This entire structure acts as a rocket launch base, compressing energy for the next macro leg up confirming a bogger Fibonacci. The completion of this base targets a powerful ignition in SEP. 2027 with a total confirmation of the Channel.
This is not trading advice or signal at all
This is the identification of a mathematical and structural precedent that now stands, clear and present, on the chart. The responsibility for any action taken—or not taken—rests solely with the individual.
The market is a mechanism.
This is how its gears are aligning.

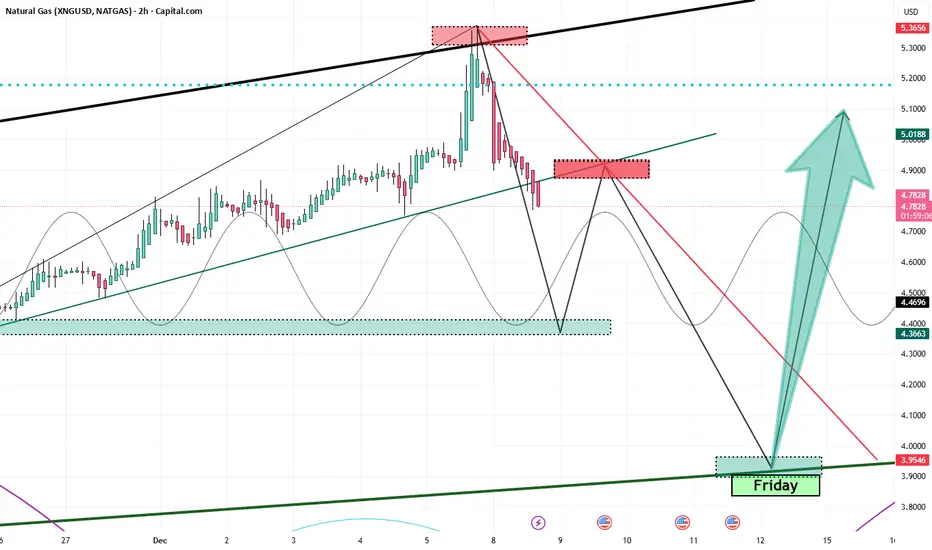
Wild Friday and the Weekly HammerFrom a technical-geometric standpoint, Natural Gas is approaching a high-confidence inflection zone. The weekly hammer forming into Friday’s close (12.12.2025) signals potential exhaustion of the recent downside leg and early signs of demand stepping back in.
Descending from 5.33 as expected, the move has unfolded cleanly, and the red candle opening on Monday—exactly in line with the anticipated flow—reinforces the directional bias of the current retracement phase
The end-goal for this corrective leg is anchored at 3.90, which stands out as the dominant liquidity objective. The structure shows a high—if not near-certain—probability of a retracement into that zone, consistent with the broader technical roadmap already outlined.
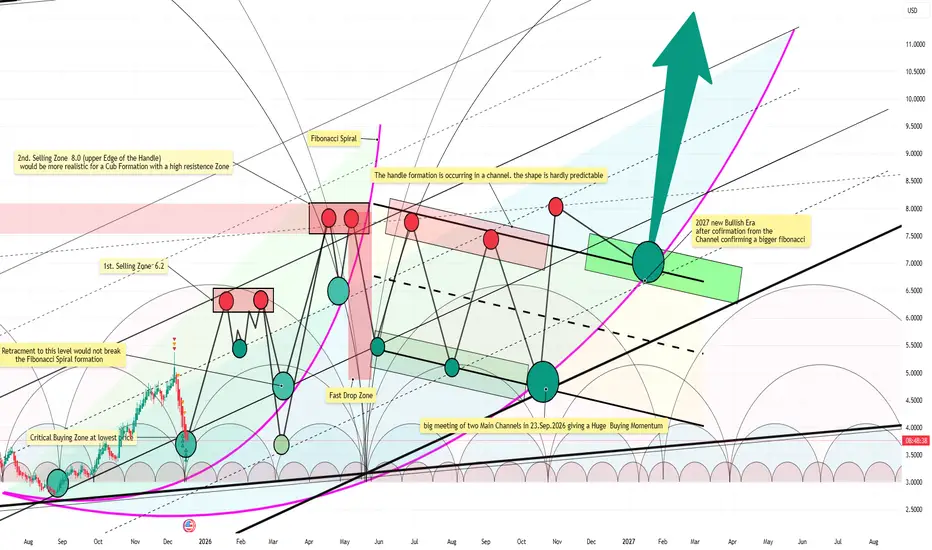
THE SETUP: 2026 CUP and Handel Formation (most realistic)This observation has crossed a threshold.
It is no longer merely "trading ideas" or speculative commentary.
We are witnessing the most structurally significant formation of the cycle a multi-stage Handle and Channel Convergence setting the stage for a historic move.
The alignment of a historic Cup & Handle replication, within a 10-year Fibonacci framework, at the meeting point of macro channels, creates a scenario that demands a higher level of consideration. It presents a probability that is now too significant to ignore.
Phase 1: The Final Exhaustion Drop
Price is rejected from the massive 8.0 resistance wall. This isn't just a normal pullback.
Why it drops fast: This sell-off represents the final liquidation wave of the previous bear cycle. Weak hands capitulate, and late sellers scramble for the exit, creating a sharp, high-volume descent into the formation. This rapid drop is necessary to flush out the last remnants of selling pressure.
Phase 2: The Energy Channel (The "No-Return" Zone)
The price enters the Handle channel, a defined equilibrium zone where the final sell orders are absorbed.
This is where the major trend channels converge. Once price consolidates here and breaks north, there is no logical support left to retest—it becomes a one-way trajectory. The "no-return point."
Phase 3: The Launchpad
This entire structure acts as a rocket launch base, compressing energy for the next macro leg up confirming a bogger Fibonacci. The completion of this base targets a powerful ignition in January 2027.
This is not trading advice or signal at all
This is the identification of a mathematical and structural precedent that now stands, clear and present, on the chart. The responsibility for any action taken—or not taken—rests solely with the individual.
The market is a mechanism.
This is how its gears are aligning.
What Fibonacci trying to tell us !!!!!!In the markets, the Fibonacci spiral isn't just a pattern—it's an engine of momentum. It reveals where price action compresses, aligns, and ultimately explodes.
Think of a consolidation near a key Fibonacci level (like the 61.8% or 38.2% retracement) as the spiral winding tighter. This isn't random noise; it's energy being stored, a structural reformation where the market's natural growth geometry reasserts itself.
The moment price breaks decisively from this zone, it triggers the spiral's accelerating phase. This is why Fibonacci structures are powerful tools for identifying the launch point of sharp, impulsive moves—not for forecasting slow, grinding trends. They pinpoint where potential energy converts to kinetic momentum, offering a high-probability entry for capturing rapid expansion.
The Great Channel: The Great Reset from 9.5A Once-in-a-Decade Market Opportunity
The Great Channel thesis presents a compelling long-term market structure that is becoming increasingly difficult to ignore. From a macro-technical perspective, current price action suggests we may be trading at, or extremely close to, the lowest valuation level we are likely to witness over the next decade. Even the next cyclical low, should it occur, may still print at levels higher than today’s price.
This outcome is not guaranteed, but it represents one of the most probable scenarios on the table and one that now carries more conviction than ever before. The concept of the Great Channel first emerged in 2024 as a theoretical framework; however, evolving market behavior indicates that it may now be transitioning from hypothesis into structural reality. If confirmed, this channel has the potential to reprice the market into entirely new regimes.
Importantly, this structure does not conflict with the broader cup-and-handle formation that many long-term participants are tracking. On the contrary, the two patterns may be complementary, with the cup-and-handle reaching full maturity only after a potential Great Reset event. Such a reset could occur near the extreme boundaries of the Great Channel, precisely where asymmetric risk-to-reward conditions are most favorable.
From this vantage point, current levels may represent the most attractive strategic accumulation zone we are likely to see for many years to come. For patient, long-term traders and investors, this region offers a rare alignment of macro structure, technical positioning, and cyclical timing—an opportunity that may not present itself again for a very long time.

Natural Gas (NG): The Freestyle Framework Natural Gas: The Freestyle Landscape
This is not a forecast. It is a dynamic structural map.
Designed for the discretionary trader, this "Freestyle" framework deconstructs Natural Gas into its core technical components: cyclical rhythms, evolving Elliott Wave structures, adaptive price channels, and multi-layered zones of confluence.
We provide the architecture; you dictate the strategy.
Within This Framework, You Will Identify:
- Cyclical Turning Nodes: Time-based projections where trend exhaustion or acceleration is statistically heightened.
- Price Channel Evolution: Visualizing the market's breathing pattern through expanding and contracting volatility corridors.
- Confluence Zones: High-Probability regions where support/resistance, Fibonacci projections, and channel boundaries cluster, defining the market's true decision points.
- Momentum & Risk Gradients: Areas shaded for potential trend acceleration or reversal, framing asymmetric risk/reward opportunities.
The Core Philosophy: Trade Context, Not Clarity.
This map eliminates the noise of directional bias. Instead, it provides a professional-grade canvas to:
Plan high-probability setups within predefined zones.
Anticipate volatility shifts before they occur.
Objectively manage risk by highlighting invalidation levels.
Align your unique strategy (swing, position) with the market's inherent structure.
Disclaimer: This analysis is for informational and educational purposes only. It is a framework for context, not a substitute for independent analysis. All trading decisions and risk management are solely the responsibility of the individual. Past performance is not indicative of future results.
Trade The Reaction. Navigate The Structure.

NAT-GAS World Cup 2027. ist Possible ??The chart was created purely out of curiosity to determine whether it might be possible. An idea that may seem unusual or unprecedented does not, in itself, invalidate its potential.
First time i have sugested the idea was in 2024 was also so crazy. but is it ?

Extended Scinario to Fall Zone from 8.5This scenario appears more plausible to me personally, and confirmation of it should emerge in March 2026 if the critical buying zone is reached. The period from March to April could represent a very strong buying opportunity, potentially serving as the final upward move toward the 8.5 area.
This reflects a personal opinion and general market perspective only. It is not investment, trading, or financial advice, and should not be interpreted as a recommendation to buy or sell any asset.

The Undeniable Chart of EverythingJune 2026 – A New Era: $3.2, the Price of No Return
This chart speaks for itself. Based on my experience and a clear reading of market dynamics, the rapidly accelerating demand for natural gas represents a structural shift rather than a temporary cycle. Natural gas is no longer merely a bridge fuel; it is becoming a foundational pillar of future energy systems, technological expansion, and global economic stability.
Natural gas is essential for powering next-generation data centers and AI infrastructure, where uninterrupted, high-density energy supply is non-negotiable. It plays a critical role in stabilizing renewable energy grids, providing rapid-load backup for wind and solar as electrification accelerates worldwide. In hydrogen production, natural gas remains the primary feedstock for blue hydrogen, enabling large-scale decarbonization of heavy industry long before green hydrogen reaches economic viability.
Beyond electricity, natural gas is indispensable in advanced manufacturing, petrochemicals, fertilizer production, and clean steel technologies. LNG continues to reshape global energy security, particularly in Europe and Asia, where long-term supply contracts are locking in demand well into the next decade.
Against this backdrop, a price level of $3.2 is not just undervalued — it represents a historical inflection point. As supply constraints tighten and demand growth becomes embedded, this is a price the market is unlikely to revisit. The era ahead is defined by scarcity, strategic relevance, and repricing.
The three highlighted danger zones mark areas where multiple sell cycles converge. These zones are historically risky for initiating long positions and instead represent optimal regions for identifying potential short or sell setups. A reversal from the darkest zone can unfold rapidly, often materializing as a single large bearish candle or two consecutive bearish candles on the weekly timeframe.
This reflects a personal opinion and general market perspective only. It is not investment, trading, or financial advice, and should not be interpreted as a recommendation to buy or sell any asset.

Long-Cycle Market Observation-4 steps all we needThis discussion is intended as a personal analytical framework rather than financial or trading advice. Its purpose is to highlight rare, high-impact market opportunities and to avoid unnecessary conflicts between competing scenarios, particularly around the potential double-top region near 6 to 6.4.
The focus is on four specific, numbered time windows:
1-January
2-February
3-March
4-June
These four periods alone are considered sufficient, from a purely hypothetical and educational perspective, to capture major market movements through 2026, without the need for frequent activity.
The underlying idea emphasizes restraint rather than constant engagement. Overexposure and excessive activity are viewed as the primary risks, while patience is regarded as the key factor. Upon reaching the fourth phase, the concept shifts away from short-term realization and toward a long-term, multi-year approach, allowing positions to evolve across multiple cycles instead of being closed prematurely.
This framework reflects a personal market philosophy focused on discipline, timing, and long-term perspective, and should be understood solely as a conceptual discussion.
XNGUSD, Accumulation to Expansion? Weekly Long Into Winter RiskI’ve initiated a long on Natural Gas from weekly structure. Price has rotated inside this area since ’23 and is now reacting at a confluence of trendline support + prior demand. The plan is to hold into Q4, when seasonality (heating demand + potential hurricane/LNG disruptions) often provides upside tailwinds. Risk is defined on the weekly chart; I’ll manage around swings and let the position work.
Technicals (Weekly)
• Range base reclaimed: Price is bouncing from the same 2023–2024 accumulation zone (roughly 2.5–3.0).
• Multi-touch trendline support: Current candle is reacting at the rising base trendline; wicks show responsive buying.
• Structure targets: First objective is a move back into mid-range supply; extension aims toward the upper band shown on the chart.
Fundamentals Supporting Long Bias
• Seasonality: Q4 typically brings rising Heating Degree Days across the Northern Hemisphere; winter risk premia often get priced ahead of the draw season.
• LNG pull: Ongoing ramp in global LNG demand + incremental U.S. export capacity tends to tighten the domestic balance on cold forecasts or unplanned outages elsewhere.
• Supply discipline: Gas rig counts have lagged after the 2024 price slump; that slower supply response can tighten later-year balances if weather cooperates.
• Weather & Gulf risk: Peak hurricane season can interrupt Gulf production and processing, periodically supporting price.
• Europe draw season: As EU storage transitions from injection to draws, import needs rise, keeping a bid under seaborne gas.
Trade Plan:
• Entry: From weekly support (see chart).
• Management: Trail below fresh higher lows on the daily; take partials at fib/structure levels; let a runner target the upper band if momentum broadens.
What Breaks the Thesis
• A persistently warm Q4, outsized storage overhang into winter, major LNG outages/delays, or a renewed surge in production that swamps demand.
Note: Please remember to adjust this trade idea according to your individual trading conditions, including position size, broker-specific price variations, and any relevant external factors. Every trader’s situation is unique, so it’s crucial to tailor your approach to your own risk tolerance and market environment.
2026 retirement plan.The broader market structure suggests that 2026 could mark the lowest price level ever observed in natural gas, driven not by weakness, but by extraordinary global demand—particularly the explosive energy requirements of large-scale AI data infrastructures.
A double-top formation appears increasingly inevitable, supported by highly precise geometric alignment across multiple resistance and support zones.
This is not a trading call, but the result of a multifaceted, rigorously detailed market analysis viewed from several technical and structural angles.

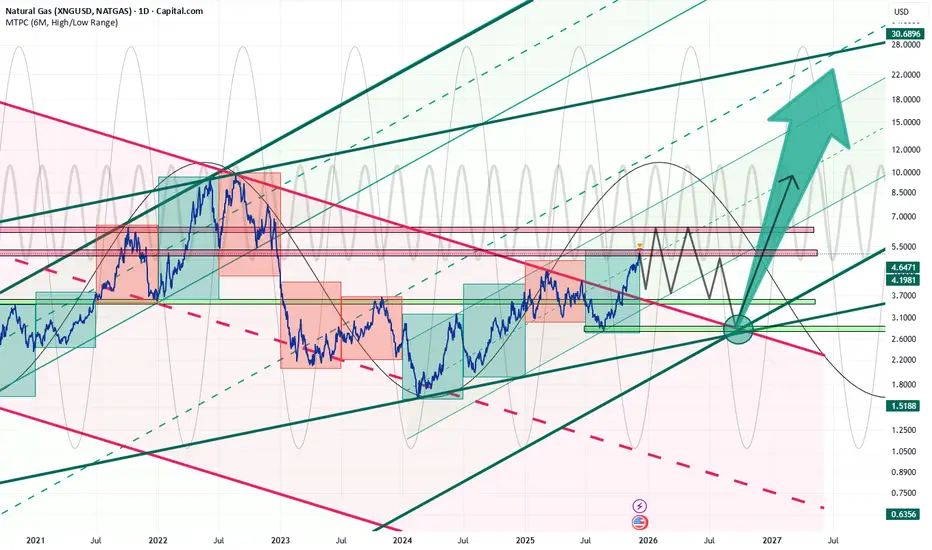
Geometrical Projection 2026: a New Bullish Era Sep.2026By early 2026, we anticipate the emergence of a new six-month green candle. Following this, a downward correction is expected, with the possibility—though not certainty—of forming a second peak in May. Ultimately, the projection points toward a retest of the bottom of the current six-month candle, signaling an exit from the five-year descending channel and defining the lower boundary of a new ascending channel. By September 2026, geometric patterns and buyer alignment suggest the potential onset of a new bullish era.
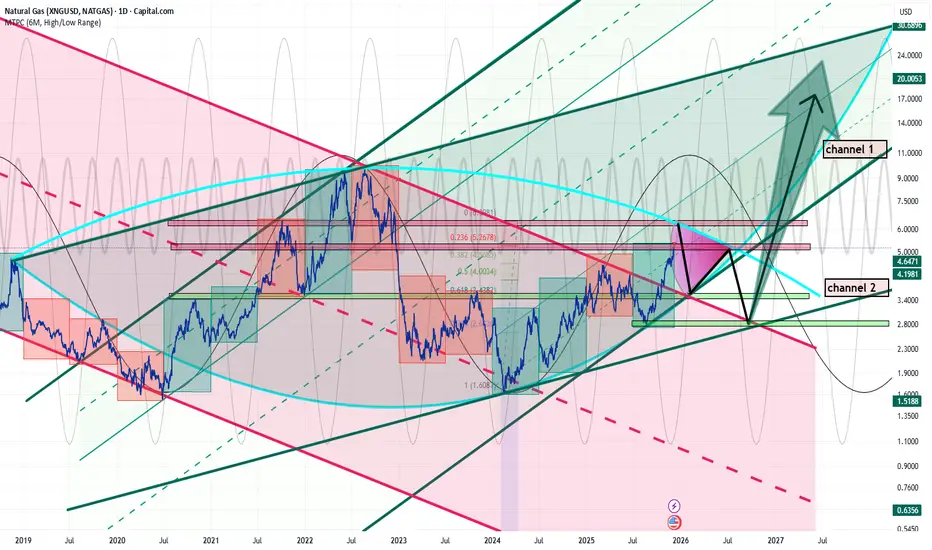
Lines dont lie-Sep.2026 we have definitively broken out of the descending channel. Currently, the market is facing two potential upward channels. The breakout from the red triangle will determine which of these channels we will follow. Based on anticipated global economic conditions and the market’s geometric dynamics, channel 2 appears to be the more logical trajectory. Price movement toward the borders of channel 2 has so far respected the integrity of the 6-month candle.
September 2026 is projected to mark the point where buyers will fully align, completing the dynamic termination of the first wave and forming a significant second-wave structure.
Multi-Cycle Alignment Points to Sharp DownturnThe chart presents a sophisticated multi-cycle composite model overlaid on the prevailing Natural Gas trend. Notably, all four cycles will converge during the January–February 2026 window, creating a concentrated alignment that signals the likely emergence of the second major peak.
When multiple cycles reach their highs in unison, this synchronicity often delineates a critical market turning point—especially here, where prices are confronting significant resistance and aligning with the prior peak from September 2021. This formation suggests a heightened probability of a strong downward phase, potentially initiating a broader structural market correction.
