NB Bullish Multi-Timeframe Swing Trade SetupNASDAQ:NB getting attention lately.
Bull trend is already established.
Strong monthly ADX. Prior 65% advance.
Constructive pullback, holding between rising 50 & 100 day SMAs.
Rounding structure.
Watching for expansion from here.
NB

NBNioCorp is building what is poised to become one of the most strategically significant assets on US soil — the Elk Creek Project in Nebraska. This facility is set to be the primary domestic source of Niobium, Scandium, and Titanium.
Latest News & Updates (January 2026):
Jan 12, 2026: NioCorp announced final results from its 2025 drilling program. Analysis of cores confirmed high-grade stability.
Jan 02, 2026: Analysts updated their forecast for the company's financial performance.
Institutional Interest: Reports indicate continued accumulation of NASDAQ:NB shares by major funds.
Elk Creek Project Highlights:
Estimated Net Present Value (NPV): $2.35 Billion (after-tax).
Estimated Mine Life: 38 years.
Resource Quality: Niobium grades up to 1.58% have been reported.
Developments at Elk Creek:
Financing Efforts: The company is working towards securing the necessary funding for the project.
Potential Government Backing: The project's materials are considered strategically important.
Supply Chain Development: NioCorp is involved in developing a supply chain for aluminum-scandium alloys.
Rare Earth Elements: The deposit is known to contain Rare Earth Elements in addition to Niobium, Scandium, and Titanium.
The current market valuation of approximately $779 million presents a steep ~67% discount to the project's estimated intrinsic value.

$NB: The 'Niobium' King is Finally Breaking Groundand breaking resistance levels for a Cup and Handle that points to double figures.
🔥 Why the "Nobium" Story is Serious (Bulls)
Uncle Sam’s Support: NioCorp just finished a "Department of War-funded" drilling campaign (results were solid) and has a pending debt application with the EXIM Bank.
Strategic Moat: Brazil currently controls over 88% of global niobium. NioCorp is positioned as the "Security Choice" for U.S. defense and EV tech.
The Tech Play: Niobium is critical for HSLA steel (lighter, stronger cars) and next-gen batteries that charge in minutes.
⚠️ The Risks (Keeping it Real)
Pre-Revenue Stress: They are still burning cash (net loss of ~$0.8M last quarter) and need to finalize a massive financing package to actually finish the mine.
Volatility: It’s a "Single Project" company. Everything hinges on Elk Creek.
Everyone is laughing at the 'NOBium' puns until the NASDAQ:NB breakout hits. 🚀
With Board Approval for the mine portal and work starting this quarter, we are moving from 'exploration' to 'execution'.
The U.S. government is literally funding their drilling because we need this stuff for fighter jets and EVs.
The Play: Long on the break of $7.00. The Goal: $11.00+ as EXIM financing news drops.
Stay radiant.
⚛️
#NB #Niobium #CriticalMinerals #MiningStocks #TurnaroundStory

Looking at possible failure for EOS to exit long term channelInvalidation occurs at another test of the recent highs.
Targeting upper 4.5s, then 4.2s, then looking for a reaction upon upper channel test if it occurs.
R of this trade: 0.5:1
3D chart showing the formation of the horizontal channel.
Picture in case the idea is scaled oddly in the published chart.
Futures premium from FTX, on a Bybit chart. They're all priced about the same anyway, and the main chart series does not affect the futures premium formula.

Short XRP, tight stopTargets:
0.5580
0.5454 (should it occur)
Leaving small amount on the table if it runs deep
Stop: ~>=0.591
Reasoning:
High funding
VPR showing curved top
Felt like it
Notes:
Should be actively monitored, I don't trust trailing stops
I will not be actively monitoring this trade
Picture for clarity if the main chart isn't scaled correctly
Zoomed out to 2hr chart
Check out the monthly candles, not something you see everyday

Looking at possible retrace for bitcoin based on March futuresWhile spot/perps did not hit the holy $50000, many March futures did.
Mostly complete list of exchanges that breached $50000:
Deribit
OKEx
Huobi
Binance
FTX
BitMEX
Surprisingly, CME and Bakkt's March futures were unable to break over $50000. CME's June contract did, however.
REASONING
Futures play a huge role in leveraged trading. I have seen this happen with OKEx's quarterly contracts before. I don't expect a drop to doom, but I also do not expect bitcoin to rush into $50000 within the next few days.
Invalidation if March futures run 50k again and bring spot/perps along with it. Unsure of short target, would likely be ideal to buy the dips.

Long dips, take care of risk $XRPThe volatility on this is INSANE!
Interesting in longing from here down to ~0.3800
Am considering going with spot buys so I don't have to worry

Shorting EOS for high beta market wide pullbackEOS makes big sweeping moves on well defined S/R levels. I believe, whether or not the coming week is bullish, there will be a sweep down to clean out the over-leveraged and paper fisted.
Stop above the recent high, looking to close in green highlighted area

Short bitcoin - DOGE mania relatedBinance uses cross margin, and once DOGE dumps, traders who are long bitcoin will be force liquidated.
Here we can see VFAP showing that price is on the upper band, traditionally where price will reverse downward.
Contingency: If it does not go down, it will explode upward and retrace, but may take hours before returning under the gray horizontal box.


JUSTIN SUN IS MY BEST FRIENDLong $TRX.
Can play two ways:
Long $TRX, short $BTC to match the chart
OR
Long $TRX naked.
I am going with option number 2

Big Tech in for a Big Drop?Here's TQQQ divided by the M1 money supply.
Here's QQQ divided by the M1 money supply.
By dividing by M1, we are able to see the supply adjusted value of the share. I chose to use TQQQ instead of QQQ for a short because it looked pretty cool making a triple top when divided by M1. Haha.

Long ICX for DeFi & Korean Cryptocurrency exposureFair warning: this is a 2017 coin.
Each time the PVD or MACD crossed up, it was a bullish sign and price moved up. Sweet!
OBV shows accumulation despite price moving down. I think. It would better best to use a USD denominated OBV.
Here is there website:
www.icon.foundation

Short altcoins, long bit-con?This is a synthetic pair trade. This chart shows the performance of altcoins as a whole against bitcoin (in market cap).
Based on the December 2020 open horizontal, it appears alts have hit a resistance.
The trade setup: long bitcoin, short the alt you hate the most, for a 1:1 ratio. You can't short or long just one because you might be incredibly wrong (or right, but I'm not in the business of being right).

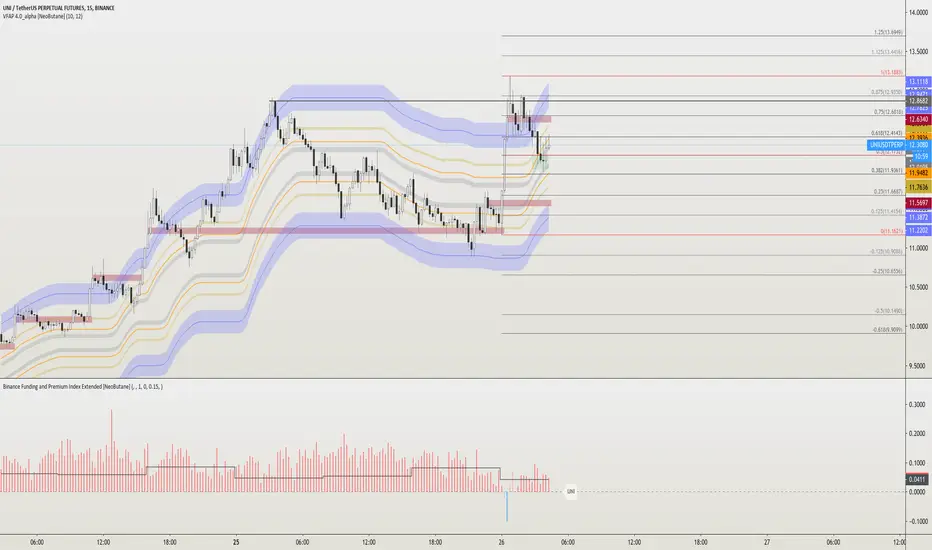
Classic Bullish Mango Prophecy - Long ICXUSDTPERPLonging the USDT paired version as well for higher upside.
As you can see on volume, volume is rising while price is rising . That's a rare sight! Shows huge demand.
MACD is going crazy and I actually would like some advice on how to interpret that haha. It's bullish, yes, but...
VZO is in 'accumulation' zone, breaking above 0 is bullish.

$GME - THE GREAT INFLATION BAMBOOZLEMeme.
So the narrative for $GME, a brick and mortar store that has been closing down shops since the start of the Big Coof, is that a community of traders all agree to buy the stock and its calls, forcing price to go up and MMs/dealers to purchase shares themselves to hedge against exercised calls.
What the chart is: GME share price divided by the M1 money supply.
Now, the false party is over.


[2021/01/19]Coinbase closing XRP markets tomorrowblog.coinbase.com
Wouldn't be long.
Official time is 10 PST as posted on the URL above.

SHORT CREAM FOR YOUR DOLLA DOLLA BILL YALLI don't know if this will work, but am opening short here, stop at +6.66% above ~184.
Target 36:1 RR


Speculative FIL long based on it being available on spot onrampsFilecoin, a not good coin, is at a low.
It is available on many fiat onramps: Coinbase, Gemini, Kraken, Bitfinex, Binance, Bittrex, and more.
That makes it worth a shot.

XLM shaping up for a pump with XLMBTC at historical lowsSTELLLAAAAAAAAA(r)
XLMBTC at historical lows
15min with VFAP, showing possible target for exit/position reduction
1hr chart showing how the Binance funding indicator is used to determine direction
Weekly at support, may revisit .13 as a retest
Weekly with BBPCT, showing the oscillator still in the upper region
