Nasdaq Computer sector & Nasdaq nearing pullback areaNasdaq Computer (IXCO) Is nearing pullback territory (23,717 resistance). IXCO being the largest sector in Nasdaq (IXIC) means the composite index, now that it's over previous resistance, is also looking for a pullback into support (20,160).
It's possible IXCO will break resistance next year and if that happens whatever gains are made will be lost on an eventual drop back into support.
If you have call options on NVDA or other tech companies closing them when IXCO hits 23,717 is highly advisable. If it hits there around this January it could be 2 years before IXCO resumes the uptrend past 23,717. Calls will likely get destroyed during this time.
Another note is lots of tech IPOs are occurring this year with lofty valuations. When this IXCO pullback comes they are likely to get hit hard. It's a great opportunity to short or wait to buy up the ones you like when the pullback is over.
As always good luck and try your best to avoid getting into new tech related trades as this year ends. It's going to be a great idea to have cash ready next year.
Ndx!

NASDAQ holding the 4H MA200 can initiate the next rally.Nasdaq (NDX) has been trading within a Channel Up since mid May and currently is consolidating on its 4H MA200 (orange trend-line). Based on the 4H RSI we might be on a similar Higher Low as on May 30, having previously made a Channel Up bottom near the 1D MA50 (red trend-line).
The Bullish Leg that followed this Low was +6.80%, so we have our Target tailored on it at 24500.
-------------------------------------------------------------------------------
** Please LIKE 👍, FOLLOW ✅, SHARE 🙌 and COMMENT ✍ if you enjoy this idea! Also share your ideas and charts in the comments section below! This is best way to keep it relevant, support us, keep the content here free and allow the idea to reach as many people as possible. **
-------------------------------------------------------------------------------
💸💸💸💸💸💸
👇 👇 👇 👇 👇 👇

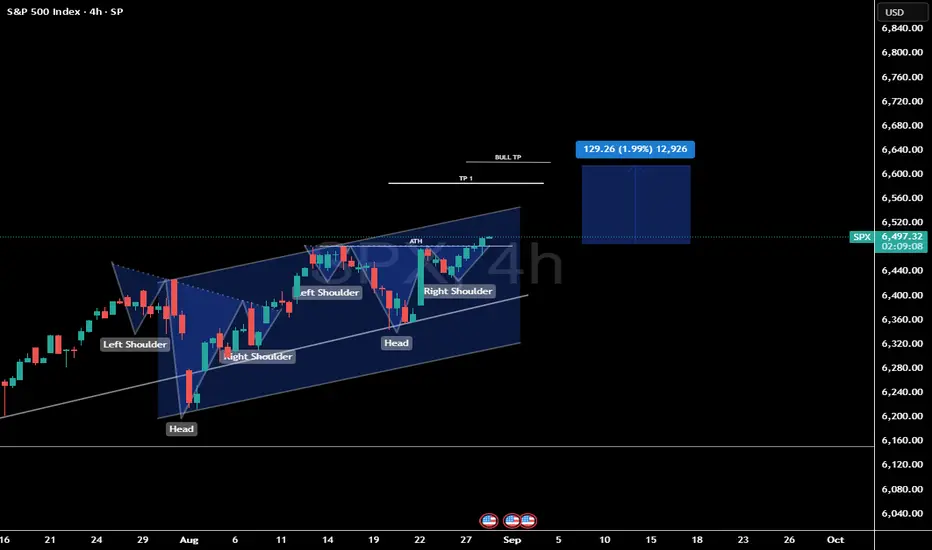
SPX is in a clear breakout trend! SP:SPX has triggered 2 larger bullish patterns.
Both patterns result in higher price.
Despite the weakness in NVDA the markets have shrugged off the decline.
We are trading into new all time highs so price discovery mode is in a effect.
When you have no resistance pivots or volume to trade against at new all time highs you really have to be careful if you're shorting the market.
Volume trends. extension moves, ATR, deviations should all be included in your analysis to define upside target zones.
We continue to remain net long the markets with key shorts in place.
NASDAQ Can this 1D MA50 rebound be sustainable?Nasdaq (NDX) has been trading within a Channel Up since May 12 and last week made a double rebound very close to its 1D MA50 (blue trend-line). That is technically the latest Higher Low of the pattern and as long as it holds, we should see the new Bullish Leg.
The last two major ones rose by roughly +10% each. Given that the 1D RSI also made a Double Bottom on its Support, we remain bullish on Nasdaq, targeting 24800.
-------------------------------------------------------------------------------
** Please LIKE 👍, FOLLOW ✅, SHARE 🙌 and COMMENT ✍ if you enjoy this idea! Also share your ideas and charts in the comments section below! This is best way to keep it relevant, support us, keep the content here free and allow the idea to reach as many people as possible. **
-------------------------------------------------------------------------------
Disclosure: I am part of Trade Nation's Influencer program and receive a monthly fee for using their TradingView charts in my analysis.
💸💸💸💸💸💸
👇 👇 👇 👇 👇 👇

Are Longterm Interest Rates Telling Us Something?I rarely cite financial news in my market updates.
My reasoning is simple: all perspectives, bullish or bearish, are ultimately reflected in price action. That price action forms patterns, and those patterns can be analyzed to produce reasonable forecasts. After years of applying Elliott Wave theory, this approach has consistently stood the test of time.
That said, I’ll break from tradition today, as I believe the following excerpt is particularly relevant to my latest Trading View update. It comes from Barbara Kollmeyer’s article, “There’s a slow-motion crisis in bonds — and this bearish strategist thinks it will hit stocks.”
For context, I regularly track multiple market indices, futures contracts, single stocks, and notably, the yield on the 30-year U.S. Treasury Bond. For the past year, I’ve highlighted the counterintuitive rise in long-term yields that ironically began when the Fed started cutting its benchmark rate in September 2024. While brief divergences between long-term yields and Fed policy aren’t unusual, this persistent uptrend is different. The yield has been carving out a clear pattern of higher highs and higher lows, appearing now on the verge of a breakout—not just toward incremental new highs, but potentially into a runaway scenario for long-term rates.
This is why Albert Edwards’ recent comments caught my attention:
“There is a slow-motion crisis unfolding in the government bond markets that equity investors continue to ignore at their peril. The upward grind for long bond yields has been relentless, yet investors keep ignoring that to focus instead on more bullish metrics such as the latest reporting season driven by the mega-cap IT stocks, that promises a pot of gold at the end of the AI rainbow.”
His perspective resonated with me.
Having lived through the dot-com boom and bust, I recall how new technologies can fuel outsized market optimism. AI undoubtedly carries transformational potential, much like the Internet. But just as it took nearly two decades for the Internet to fully translate from speculative boom to tangible economic value, AI’s payoff will likely follow a similarly extended trajectory. It’s not an immediate catalyst.
What I am certain of is this: the cost of long-term money is rising, with implications far beyond bond charts. Higher yields directly affect mortgage rates and other long-term financing costs. More importantly, sustained upward pressure in long-term rates has the potential to weigh heavily on equities, broader markets, and asset valuations for far longer than many currently expect.
DAX/GER30 SHORT/LONG sequence Swing Trade +500/+500 points 🔸Hello traders, let’s review the 2hour chart for GER30/DAX. Strong recovery from recent lows, however price testing key resistance and support zones where major reactions are expected.
🔸Speculative setup defined by resistance at 24,500 and key S/R demand zone at 24,000. Both zones have recently been validated with +500 point reactions.
🔸Currently both resistance and support levels are respected and price action remains technical around these areas.
🔸Recommended strategy for DAX traders:
Short Sell at Market from resistance 24,500
SL above resistance, TP 24,200 / 24,100 / 24,000.
Buy & Hold Long from key S/R 24,000
SL below support, TP 24,300 / 24,400 / 24,500.
🎁Please hit the like button and
🎁Leave a comment to support our team!
RISK DISCLAIMER:
Trading Futures, Forex, CFDs and Stocks involves a risk of loss.
Please consider carefully if such trading is appropriate for you.
Past performance is not indicative of future results.
Always limit your leverage and use tight stop loss.

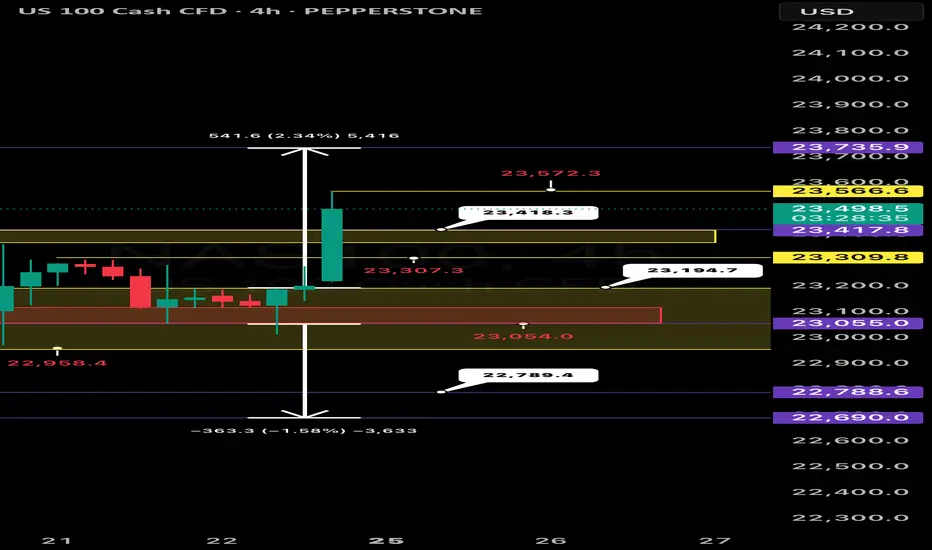
NASDAQ 100 (NAS100) potential reversal The NASDAQ 100 (NAS100 ) on the H4 timeframe it appears to be undergoing a period of consolidation within a defined range. As of approximately 20:46 (based on the timestamp), the index is trading around 23,383.6, having experienced a decline of -1.41% or 334.3 points.
Key Observations:
Recent Downtrend and Support Zone : The price action shows a clear downtrend leading into the current consolidation. The highlighted yellow zone around the 23,100 - 23,300 level seems to be acting as a support zone, preventing further immediate declines.
Resistance Zone : Conversely, an upper red zone around the 23,800 - 24,000 level is acting as resistance, capping the upside for the time being.
Range Bound Movement : The price is currently oscillating between these two defined zones, indicating a period of indecision in the market.
Potential Reversal Area : The fact that the support zone is holding after a significant down move suggests the possibility of a short-term reversal if buyers step in with conviction. However, this needs confirmation with a break above the resistance zone.
Breakout Scenarios :
Bullish Breakout: A sustained break above the 24,000 level could signal a continuation of an upward trajectory, potentially targeting previous highs.
Bearish Breakdown : Possibly, a break below the 23,100 level would likely confirm further downside pressure and could lead to testing lower support levels.
Technical Considerations :
Traders and investors should closely monitor price action within these zones. Look for confirmation signals such as strong candlestick patterns (e.g., bullish engulfing, bearish engulfing) or increasing volume on breakouts to gauge the strength and validity of potential moves.
Conclusion :
NASDAQ 100 is currently in a critical juncture. The consolidation within a potential reversal zone after a downtrend warrants careful observation. The direction of the next significant move will likely be determined by whether the support or resistance zone is broken decisively.
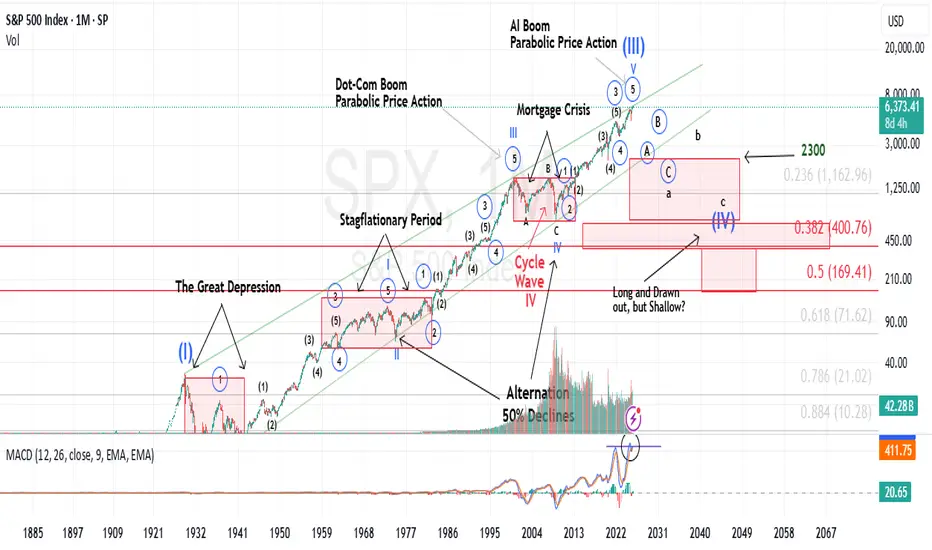
Why The Bubble Theory Makes No SenseIt seems like every other week with tech stocks making new all time highs, there is a constant chatter of claiming we're in a bubble. One of the classic signs of a bubble, is excessive leverage betting on ever higher returns.
This is a chart of securities margin loans provided by the Fed updated quarterly. As you can see since the 2008 financial crisis speculators have been very conservative with their use of leverage. It's almost like 2008 scared people so badly people more than a decade later are still behaving financially conservative.
Some of the rational for the talk of a bubble is historically high PE ratios, but this can be explained by massive reinvestments into AI infrastructure by the biggest tech companies. The more investments they make the higher the PE ratios look.
The key ingredient of a bubble is leverage and besides the small spike of it post-covid, there is no sign of excessive speculation.
Remember tech stocks are absolutely going to have a pullback likely next year or 2027, but the fear of a dot-com era bubble is just simply unfounded.

ARIASWAVE MARKET UPDATE - NASDAQ 400K - DOW 200K...In this major market update, I’m sharing fresh analysis that signals the beginning of a powerful new uptrend.
Years of excessive money printing have fueled what appears to be a massive incoming bull market—one that could surpass all previous trends in strength, thanks to the extraordinary liquidity injected into global markets.
We may be entering a modern-day “Roaring 20s 2.0,” but eventually, this cycle will run its course.
For now, the key is to capitalize on the opportunities ahead by making well-informed decisions.

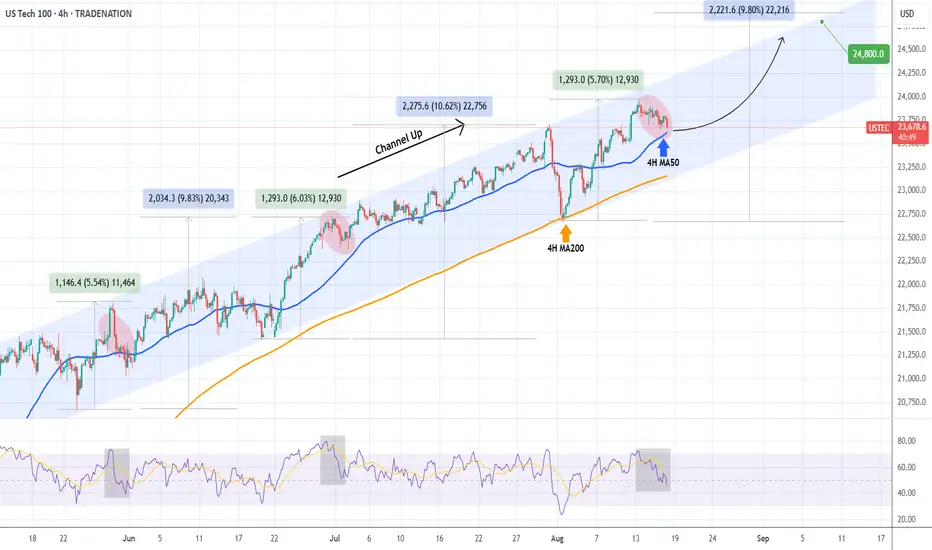
NASDAQ testing its 4H MA50. Will it offer Support?Nasdaq (NDX) has been trading within a Channel Up since May 11 and is approaching its 4H MA50 (blue trend-line) today following a Wednesday initiated pull-back.
Technically this is so far a normal correction for this pattern, which offers a short-term buy signal as the 3 times during those 4 months that it broke convincingly, it rebounded on or close to the 4H MA200 (orange trend-line).
As a result, if the 4H MA50 offers a rebound, we could see a +9.80% rebound from the 4H MA200, the minimum that this Channel Up has delivered upon a Bullish Leg. That gives a Target of 24800.
-------------------------------------------------------------------------------
** Please LIKE 👍, FOLLOW ✅, SHARE 🙌 and COMMENT ✍ if you enjoy this idea! Also share your ideas and charts in the comments section below! This is best way to keep it relevant, support us, keep the content here free and allow the idea to reach as many people as possible. **
-------------------------------------------------------------------------------
Disclosure: I am part of Trade Nation's Influencer program and receive a monthly fee for using their TradingView charts in my analysis.
💸💸💸💸💸💸
👇 👇 👇 👇 👇 👇
NAS100 3 Drive Pattern Correction Wait For BoS📊 The NAS100 has pulled back after a strong bullish run and is currently facing some pressure 📉. I’m watching a three-drive pattern that appears to have extended into a fourth drive, followed by a corrective phase 🔄. From a smart money perspective, liquidity is often targeted after a strong expansion in trend — patterns like the three-drive can frequently lead to a deeper retracement before the continuation resumes. With that in mind, I’m anticipating the possibility of a further pullback before positioning for a potential long setup on a bullish break of structure 🚀 (not financial advice).

Concern for the NASDAQIn no way certain of a large pullback on the NASDAQ NASDAQ:NDX , but I’m hedging for it. With YQQQ $YQQQ.

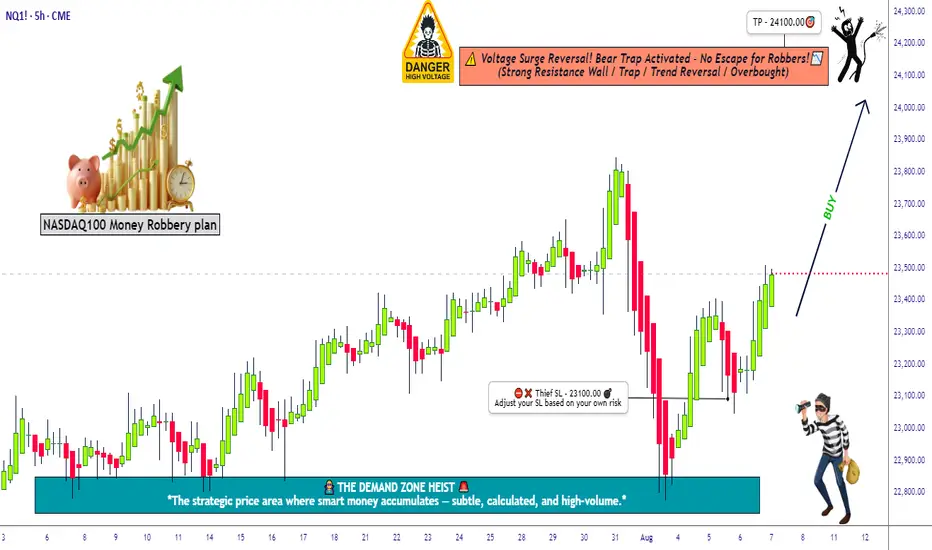
Robbing the Nasdaq Futures | NQ1! Plan with Precise Targets💥🚨NQ1! “E-Mini Nasdaq 100” Heist Alert 🚨💥
🎯Thief Trader Bullish Takeover Plan🕵️♂️📈
🌍 Dear Global Looters & Market Bandits, 💰💸💎
It's time to crack the vaults of the Nasdaq 100 Futures (NQ1!) — Thief-style! No mercy. No fear. Just profits. 🔥
🔓 The digital vault is open — we’re layering multiple limit orders like pros to snatch the tech treasure chest. This isn’t just a trade…
👉 This is an organized robbery of Wall Street’s most elite index. 🏦🕶️
💎 Entry Point = Anywhere on the Grid!
Set your buy limit orders at juicy dips — 15m / 30m / 1H zones, support bounces, or wherever the chart whispers "steal me." 🎧📉
⏰ Stay alert — we don’t chase, we trap. 🐍
🛑 Stop Loss = 23100.00
Set it & forget it below key swing low.
You’re not in this heist to bleed. Risk small. Layer tight. Protect the stash. 🛡️💼
🎯Target = 24100.00
That’s the exit zone before the feds (aka market makers) catch on.
Be smart — take profit early if the heat gets real. 🚓🚨
🧠Strategy Mode: Layering Limit Orders
Thief never enters with one shot. We layer in like ghosts — scaling into value zones, controlling the risk, and building power before liftoff. 🚀📊
This ain’t gambling — it’s structured robbery with exit plans. 🎯💼
🧲 Scalpers & Swingers Welcome!
⚔️ Got big capital? Smash the levels and ride the breakout.
💼 Small cap thief? Ride with the swing crew — safer, smoother, more stealthy.
📍Always use Trailing SL — never let the market take back what you stole. 💰
📰 Market Sentiment: Bullish Bias 😈
AI hype. Earnings season. Rate cuts. You name it — it’s all fueling the Nasdaq rocket.
We’re riding momentum, not hope. This ain’t luck — it’s Thief precision execution.
🔔 Pro Thief Tips:
⚠️ Avoid entries during high-impact news.
🚀 Use alerts. Monitor VIX + QQQ.
💻 Watch for liquidity zones & trap setups.
🚀💣 Smash that 🔥Boost Button🔥 if you love robbing the market like a pro!
Help grow the Thief Trading Crew — one like = one stolen candle from the whales. 💵🦈
We rob institutions, not each other. 💯🤝
Stay locked in — next heist plan coming soon. 📡📈
#NQ1 #Nasdaq100 #EminiFutures #ThiefTrader #RobTheMarket #LayeringStrategy #SmartMoneyMoves #BullishPlan #WallStreetHeist #TradingViewSetup
NASDAQ (CASH100) is Approaching KEY ResistanceSince 15 May, the Cash100 has been trading within an upward channel.
It’s now approaching diagonal resistance — will it hold, or break higher?
On the chart, I have marked every time NAS has tested the diagonal resistance and failed to break through.
I’ll be watching this area closely for shorts.
What do you think: will NAS continue climbing, or is a reversal coming?

NASDAQ eyes 24300 as the Channel Up extends.Nasdaq (NDX) has been trading within a 3-month Channel Up since the May 12 candle. Throughout the whole time, the 1D MA50 (blue trend-line) has been in firm Support and right now the pattern is unfolding its latest Bullish Leg.
The last two rose by +6.67%, so that gives us a Target of 24300 by the end of the month.
Notice also that the 1D MACD is about to form a Bullish Cross. The previous one was a strong buy signal during the most recent Bullish Leg.
-------------------------------------------------------------------------------
** Please LIKE 👍, FOLLOW ✅, SHARE 🙌 and COMMENT ✍ if you enjoy this idea! Also share your ideas and charts in the comments section below! This is best way to keep it relevant, support us, keep the content here free and allow the idea to reach as many people as possible. **
-------------------------------------------------------------------------------
Disclosure: I am part of Trade Nation's Influencer program and receive a monthly fee for using their TradingView charts in my analysis.
💸💸💸💸💸💸
👇 👇 👇 👇 👇 👇

NasdaqAs said before, nasdaq going down, can take out highs then plummet, but time will tell. PS: my previous posts got removed. View auto supply and demand zones indicator. Dm me free for a month free. (It draws snd zones).

NAS100 (CASH100) Short - Double top 30minThe 15min head and shoulders setup got invalidated.
However, my double top variables are currently being met.
Still need confirmation before entering trade.
Risk/reward = 2.7
Entry price = 23 284
Stop loss price = 23 331
Take profit level 1 (50%) = 23 173
Take profit level 2 (50%) = 23 129
What does everyone thing the NASDAQ is going to do today?
NAS100 Trade Idea: Liquidity Sweep & Bullish Reversal Potential📊 NASDAQ 100 (NAS100) Trade Outlook 📈
The NASDAQ 100 is holding a strong bullish trend on the higher timeframes 🟢. However, we’re currently seeing a notable pullback into a key support zone ⚠️ — price has dipped beneath previous lows, tapping into what appears to be an institutional accumulation range 🏦.
This move is likely targeting the liquidity resting below those lows 💧, where sell stops are positioned. Price is also reacting off a significant bullish order block 🧱 — a confluence area that could produce a strong reversal.
🎯 What to look for next:
Wait for a bullish break in market structure 🔁 to confirm a potential entry. If that occurs, consider a long setup with your stop loss below the swing low 🛑 and a 1:2 risk-to-reward target 🎯.
🚫 This is for educational purposes only and not financial advice.

Is the NASDAQ Vault Open for a Full Bullish Heist?🧠 NASDAQ Heist Masterplan: Thieves Eye on 24,500 🎯💰
🚨 Asset: NASDAQ100 / US100 / NDX
📊 Plan: Bullish | 🔁 Layering Strategy
🎯 Target: 24,500
🛑 Stop Loss: 22,600
📍 Entry: Any level – the vault’s wide open!
💼 Thief Trader's NASDAQ High-Stakes Robbery Is LIVE! 🤑📈
Welcome, money bandits & market looters! 💼💰
The time has come to launch a full-scale bullish raid on the NASDAQ fortress. We’re not just taking entries — we’re stacking them like a pro with our layered limit order strategy across swing zones. 🔫📉➡️📈
🔓 Entry:
Pick any price! We break in anytime, anywhere.
🔁 Stack your buy limits on 15m–30m swing lows.
🔔 Set your alerts – don’t let the opportunity slip.
🛑 Stop Loss:
Guard your loot at 22,600.
Risk management is the bulletproof vest in this raid. 🎯
Adjust your SL based on lot size and order volume. 📏🔐
🎯 Profit Target:
Thieves retreat at 24,500.
But hey – smart robbers use trailing SL to squeeze every last drop of gold! 🏆💸
💡 Scalpers & Swingers:
Stick to the long side only.
If your pockets are deep – full-send mode ON.
If not, tag along with swing entries. Patience pays big! 💎⏳
📢 Heads Up, Heist Crew:
News drops = landmines. Step carefully.
🚷 No new entries during major announcements.
🛡️ Use trailing SL to defend your profit bags.
🚨 Daily Reminder:
This market isn’t a playground. It’s a battlefield.
Use COT data, macro reports, sentiment scans, and index-specific triggers to fortify your robbery blueprint. Stay smart, stay updated! 📊🧠
💥 Boost Our Loot Crew 💥
Hit that LIKE ❤️ to support the Thief Army!
Stronger visibility = Bigger Loots = More Victory Runs.
See you at the next robbery – we move in silence, but the market hears us loud! 🐱👤💸🔥🚀

Fibonacci Retrace Strategy NAS100 Trade Idea📈 NASDAQ 100 (NAS100) is holding a strong bullish trend 🚀. After a weekend gap-up 🕳️➡️📈, price retraced back into the gap zone—exactly what you'd expect in a healthy trending market.
🔍 I'm applying my Fibonacci Expansion + Retrace Strategy 🔢, watching closely for a pullback into equilibrium ⚖️ within the previous price swing. That’s where I’ll be waiting for a bullish market structure break 🔓📊 to confirm my long bias.
🧠 Patience is key here—let the setup come to you.
📌 As always, this is not financial advice!

$NDX 3rd Bearish EngulfingSlowly but surely we are seeing deteriorating conditions in every major indices.
NASDAQ:NDX closed and formed the 3rd BEARISH engulfing in 2 weeks, RARE!
Light volume so it's not definitive, but alarming.
TVC:DJI keeps weakening.
SP:SPX many RED candles & bearish engulfing as well.
Light volume though.

NASDAQ price dropAfter the Nasdaq price reaches around 23642.2, a historic drop will occur and the target is to drop to 16308.
Whatever happens at the highest price, the final destination is towards 16308.
I have identified the price levels in the middle of this expected drop that can cause the price to correct.
IG:NASDAQ
