NAS100 | Bearish Momentum Extends The Nasdaq 100 fell about 2.1% (~500 points) as projected, maintaining a bearish outlook while technology stocks continued to weigh on market sentiment.
Below 25,700: Bearish continuation towards 25,340 → 25,230 → 25,000.
Above 25,700: Short-term recovery towards 25,820 → 26,170.
Ndx!

How to Trade NASDAQ NAS100 Retracements Into An Imbalance🚀 NASDAQ NAS100 Analysis – Watching for a Bullish Opportunity 📈
I'm currently focused on the Nasdaq NAS100. On the weekly timeframe, it remains in a strong bullish trend 💹. Recently, however, we've seen a sharp and aggressive retracement. Given that the market was overextended, this pullback is healthy and expected, as price seeks to tap liquidity pools and rebalance ⚖️.
Zooming into the 4-hour timeframe, we can clearly identify a bullish imbalance 🔹. This area serves as my key point of interest for a potential move lower. The ideal scenario is for price to hold above the imbalance low and then break structure bullishly 🔼.
Key conditions for a high-probability long trade:
Price must not break below the imbalance low 🚫⬇️
Price must establish higher highs and higher lows to confirm bullish momentum 🔝
If these conditions align, I will be looking for a long entry opportunity. ⚠️ Not financial advice – this is purely market analysis for educational purposes.

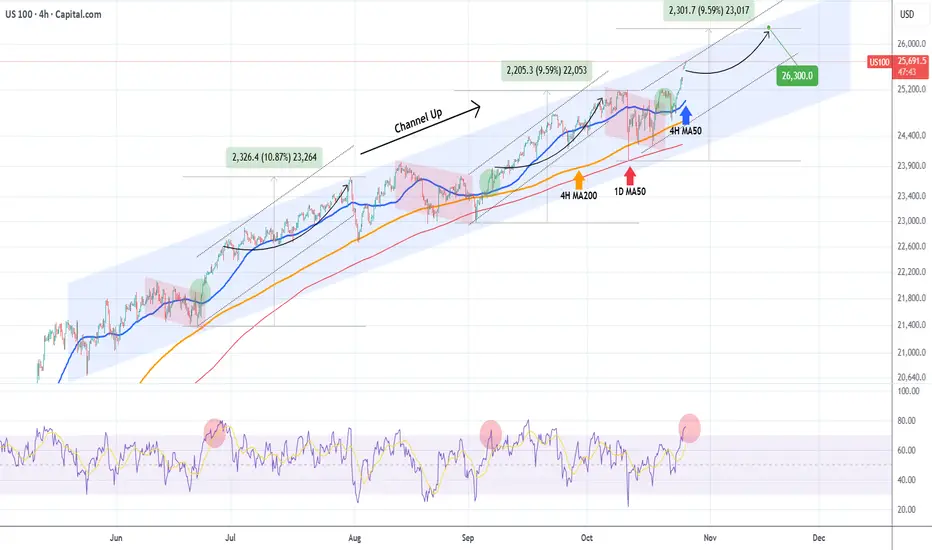
NASDAQ Channel Up still stands buy needs a pull-back.Nasdaq (NDX) reached the top of its 5-month Channel Up and got rejected. It completed a +9.59% rise from the last 1D MA50 (red trend-line) bottom (Higher Low for the pattern), similar to the previous Bullish Leg.
The maximum a Bullish Leg has increased by inside this pattern is +10.87%. As a result, either now or just above it, the pattern would require a technical pull-back. The most usual buy signal is on its 4H MA200 (orange trend-line) and the most effective when the 4H RSI breaks below its oversold (30.00) barrier.
Our next Buy Zone is within the 0.382 - 0.5 Fibonacci retracement range.
-------------------------------------------------------------------------------
** Please LIKE 👍, FOLLOW ✅, SHARE 🙌 and COMMENT ✍ if you enjoy this idea! Also share your ideas and charts in the comments section below! This is best way to keep it relevant, support us, keep the content here free and allow the idea to reach as many people as possible. **
-------------------------------------------------------------------------------
💸💸💸💸💸💸
👇 👇 👇 👇 👇 👇

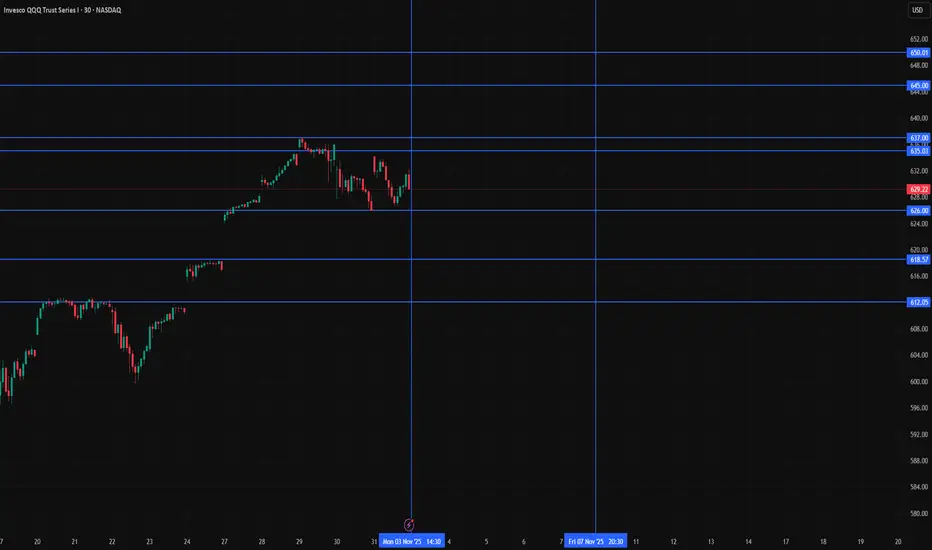
QQQ Weekly Map 3–7 Nov 2025Context
QQQ finished the week near the highs after a steady October climb. Buyers keep absorbing every shallow pullback. This week sits on two hinges. First, jobs and services data that nudge yields and implied vol. Second, a small cluster of tech earnings that can rotate leadership inside semis and handsets. The plan is simple. Let the market prove strength above the record band or let it pull back into patient demand. You will trade the reaction, not the forecast.
Chart setup
Use a one hour chart. Add 20 and 50 EMAs, a daily VWAP with bands, and the previous week high and low. Keep plots at global scope and turn lookahead off. Display VIX on a small separate pane for bias only.
Levels that matter
• 637.01 is the record high and the top of the current band
• 635 to 637 is the breakout ridge where wicks happen first and real holds happen later
• 629 is the Friday close reference for gap work on Monday
• 626 is last week’s first shelf where buyers defended cleanly
• 620 is a round shelf with memory from October
• 612 is the mean reversion area that often aligns with short term moving averages
• 597 is the bigger trend check where the intermediate crew steps in
How to read the week
Imagine a door at 637. When price opens that door and stays inside the new room for a while, trend traders have permission. If price knocks and gets rejected, range traders take the other side. If price steps down into 620 to 612 while volatility stays tame, that is where you seek bounces with tight risk. Your confirms are simple. VIX under the upper teens is friendly. Yields not jumping is friendly. If either flips, you slow down.
Three rules only
• Rule 1. Momentum only above the ridge. If cash breaks and holds above 637 for at least thirty minutes, take a starter. First target 645, stretch 650. Invalidate on a clean loss and thirty minute close back inside 635.
• Rule 2. Buy the dip into 620 to 612 only if volatility stays calm. Enter in the 620 to 612 pocket when VIX stays below your upper guardrail. Manage a first target 620 to 626 and trail. Invalidate on a decisive thirty minute close under 609 to 610.
• Rule 3. Risk first below 597. If the week forces a daily close below 597, treat it as a trend health check. Reduce gross and net and wait for a reclaim before trying to be a hero.
Why this works
One instrument. One band at the highs. One pocket for mean reversion. You are not predicting the data. You are pricing the reaction at the lines the market already respects. Breakout failures happen and that is fine because your hold filter removes most traps. Dips fail too and that is fine because your volatility guardrail removes the worst ones.
Intraday guide
• Morning plan. If we gap up into the ridge, let the first thrust exhaust and demand the hold. If we gap down toward 626, let the opening range print and only act after the first pullback.
• Midday plan. If price is inside 629 to 635 around lunch, expect chop. Trades there are optional.
• Afternoon plan. If the day is trending, trail behind a five minute reclaim of your entry line.
Risk and heat
Set maximum portfolio heat per idea at one half of one percent. Scale entries in thirds. Respect your stop even when it feels unfair. A string of small scratches is the tuition for the one clean runner that pays for the week.
Earnings and calendar awareness
AMD and Qualcomm after the close on Tuesday and Wednesday can swing semis and handsets. Shopify and Airbnb bookend consumer tone. The first week of the month carries ADP, services PMIs, ISM services, and payrolls. Do not guess the print. Trade the reaction at the levels on your chart. If VIX jumps before data, size down and wait for the dust to settle.
Cross checks
• If the ten year sits near recent levels or drifts lower, multiples breathe and the 637 break has better odds
• If VIX pins below the upper teens, dips are easier to buy
• If one of these flips, you slow down and treat the day like a range
Reminder
Education and analytics only. No advice. No guarantees. Process beats prediction.
Are Institutional Buyers Returning to NASDAQ100 Again?🎯 NASDAQ100 Blueprint: The Thief's Ultimate Heist Setup 💰
📊 Asset Overview
NASDAQ:NDX | US100 Index
Market Capital Flow Analysis - Swing Trade Setup
🔍 Technical Foundation
Bias: 🐂 BULLISH CONFIRMED
The LSMA (Least Squares Moving Average) breakout has painted the perfect picture. When institutional money flows align with technical breakouts, you know the smart money is positioning for the next leg up.
Current Market Structure:
We're witnessing a textbook bullish continuation pattern with strong momentum building above key moving averages. The index is showing resilience at support zones while eyeing psychological resistance levels ahead.
💎 The Thief's Layered Entry Strategy
Entry Philosophy: "Why catch one knife when you can catch four?" 😏
This is classic Thief-style layering - multiple limit orders spread across strategic price zones to build a position with optimal average entry:
Entry Layers (Limit Orders):
🎯 Layer 1: 24,800
🎯 Layer 2: 25,000 (Psychological level)
🎯 Layer 3: 25,200
🎯 Layer 4: 25,400
Pro tip: You can add more layers based on your risk appetite and capital allocation. Scale in gradually, not aggressively.
Alternative: If you prefer simplicity, you can enter at current market price - but layering gives you the edge when volatility strikes.
🛡️ Risk Management
Stop Loss Zone: 24,600
⚠️ Important Notice: Dear Ladies & Gentlemen (Thief OG's), this SL is MY reference point based on market structure. You are the captain of your own ship - set your stop loss according to YOUR risk tolerance and account size. Trade at your own risk!
🎯 Profit Target
Primary Target: 26,000
Why this level?
Strong historical resistance zone
Overbought territory on multiple timeframes
Potential bull trap formation area
Confluence with Fibonacci extension levels
⚠️ Exit Strategy Note: Dear Ladies & Gentlemen (Thief OG's), this TP is MY analysis. When YOU see green, YOU decide when to bank it. Take profits incrementally if you prefer safety over maximum gains. Remember: Pigs get fat, hogs get slaughtered! 🐷
🔗 Correlated Assets to Watch
These pairs move in tandem with NASDAQ100 - keep them on your radar:
📈 SP:SPX (S&P 500): The big brother index - when SPX moves, NQ100 often follows
📈 NASDAQ:QQQ (Nasdaq ETF): Direct tracking vehicle for tech-heavy momentum
📈 NASDAQ:AAPL (Apple Inc.): Largest NASDAQ component - heavy influence on index direction
📈 NASDAQ:MSFT (Microsoft): Tech titan with significant index weighting
📈 NASDAQ:NVDA (NVIDIA): Semiconductor leader driving AI narrative
📈 NASDAQ:TSLA (Tesla): High-beta play that amplifies NASDAQ moves
📈 TVC:DXY (US Dollar Index): Inverse correlation - strong dollar often pressures tech stocks
📈 TVC:TNX (10-Year Treasury Yield): Rising yields = tech pressure; falling yields = tech rally
Key Correlation Insight: Tech stocks (and thus NASDAQ) typically benefit from falling yields and weakening dollar conditions. Monitor these macro factors!
⚡ Key Technical Points
✅ LSMA breakout confirms bullish momentum shift
✅ Volume profile suggests accumulation at current levels
✅ Multiple timeframe alignment (swing trader's dream)
✅ Risk-reward ratio favors long positioning
✅ Institutional money flow indicators turning positive
⚠️ Watch for: Volatility spikes near resistance, macro news events, and Federal Reserve commentary that could impact tech valuations.
🎭 The Thief's Final Words
"In the market, you're either the heist mastermind or the one getting robbed. Choose wisely." 😎
This setup is designed for swing traders who understand that patience and proper position sizing beat FOMO every single time. Layer in, manage risk, and let the market come to you.
Remember: This isn't financial advice - it's a roadmap drawn by someone who respects the market's ability to humble even the best of us.
📢 Community Support
✨ If you find value in my analysis, a 👍 and 🚀 boost is much appreciated — it helps me share more setups with the community!
#NASDAQ100 #US100 #NQ100 #SwingTrading #TechnicalAnalysis #LSMA #LayeredEntry #ThiefStyle #IndexTrading #BullishSetup #RiskManagement #TradingStrategy #MarketAnalysis #PriceAction #SupportAndResistance #TradingIdeas #StockMarket #ForexTrading #DayTrading #TradingCommunity

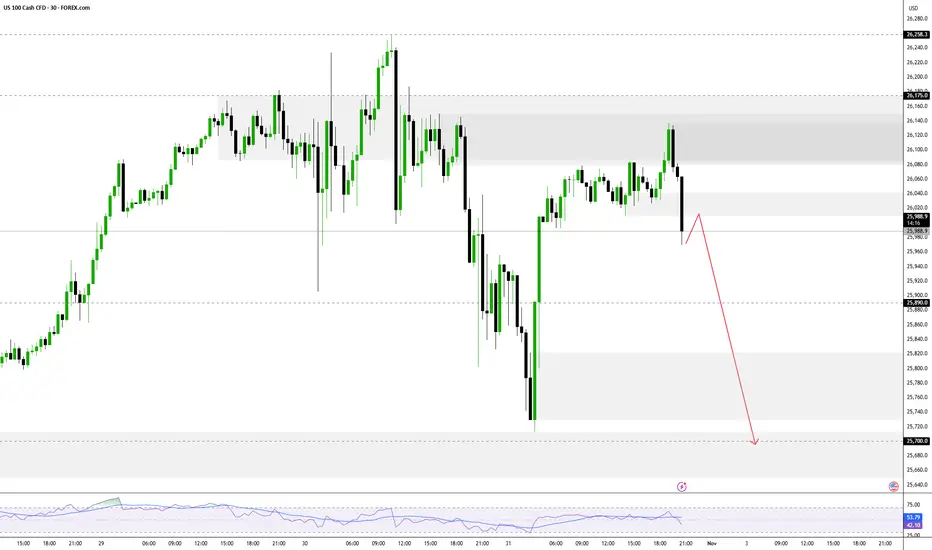
Reversal From ATH, Momentum Turns Cautious Reversal From ATH, Momentum Turns Cautious
The NASDAQ reversed from its all-time high and remains below 26,175, signaling short-term bearish momentum.
➡️ Below 26,175: Bearish bias toward 25,890 → 25,700 → 25,340.
➡️ Above 26,245: Bullish continuation toward 26,500 → 26,850.
Pivot POINT: 26,175
Support: 25,890 · 25,700 · 25,340
Resistance: 26,500 · 26,850 · 27,000
USNAS100 remains bearish while below 26,175, but a 1H close above 26,245 would confirm a bullish breakout toward higher targets.
HALLOWEEN THEME: TRICK OR TREAT - RATTLE SKELETON BONES OF 1999Trick or treat
- smell my feet.
Give me something
- good to eat.
If you don't
- I won't be sad.
I'll just make you wish you had!
🎃 Happy Halloween y'all! 🎃
--
Best wishes,
@PandorraResearch Team

Nasdaq Computer sector & Nasdaq nearing pullback areaNasdaq Computer (IXCO) Is nearing pullback territory (23,717 resistance). IXCO being the largest sector in Nasdaq (IXIC) means the composite index, now that it's over previous resistance, is also looking for a pullback into support (20,160).
It's possible IXCO will break resistance next year and if that happens whatever gains are made will be lost on an eventual drop back into support.
If you have call options on NVDA or other tech companies closing them when IXCO hits 23,717 is highly advisable. If it hits there around this January it could be 2 years before IXCO resumes the uptrend past 23,717. Calls will likely get destroyed during this time.
Another note is lots of tech IPOs are occurring this year with lofty valuations. When this IXCO pullback comes they are likely to get hit hard. It's a great opportunity to short or wait to buy up the ones you like when the pullback is over.
As always good luck and try your best to avoid getting into new tech related trades as this year ends. It's going to be a great idea to have cash ready next year.

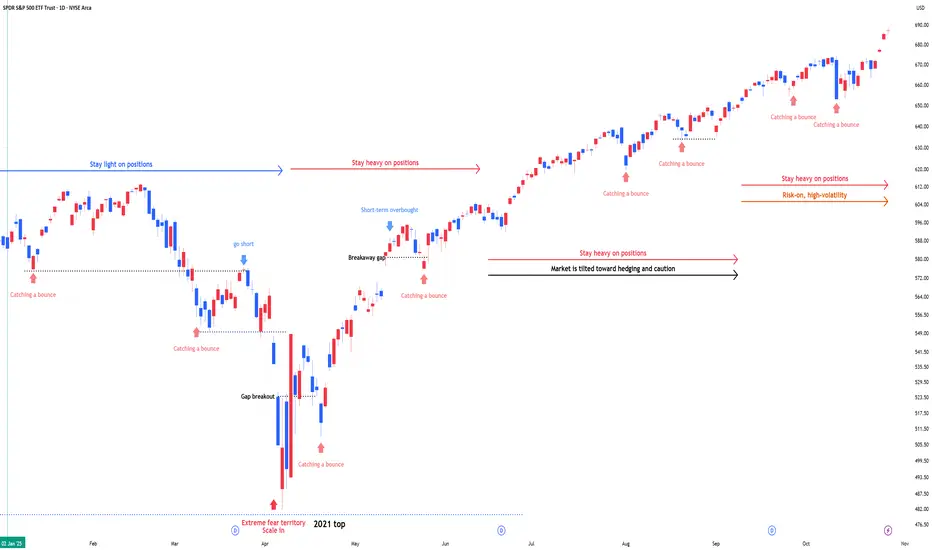
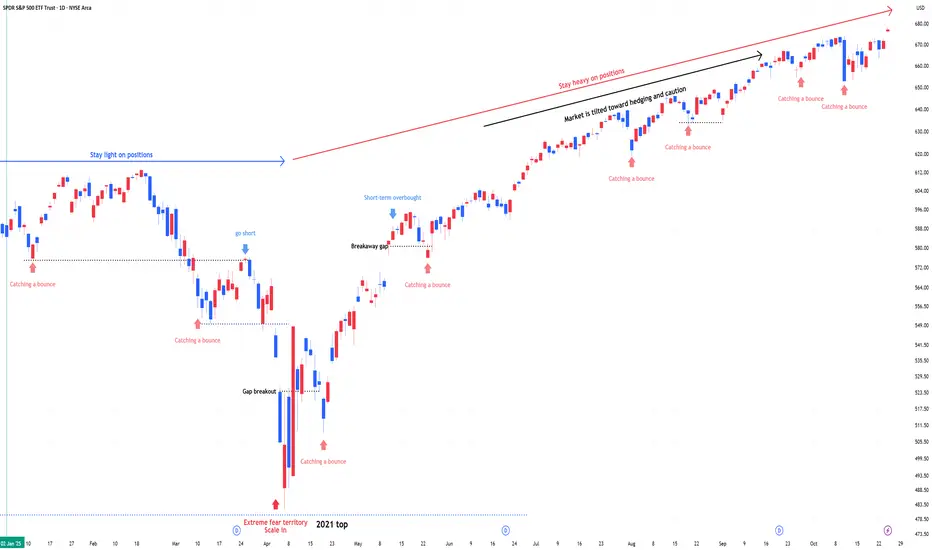
QQQ : Stay heavy on positionsQQQ : Stay heavy on positions (QLD, TQQQ)
Entering a risk-on, high-volatility zone.
In stay light on positions zones, I hold QQQ and reduce exposure.
In stay heavy on positions zones, I increase allocation using a mix of QLD and TQQQ.
** This analysis is based solely on the quantification of crowd psychology.
It does not incorporate price action, trading volume, or macroeconomic indicators.

SPY : Stay heavy on positionsSPY : Stay heavy on positions (2x leverage)
Entering a risk-on, high-volatility zone.
In stay light on positions zones, I hold SPY(+QQQ) and reduce exposure.
In stay heavy on positions zones, I increase allocation using a mix of SSO(+QLD) and TQQQ.
** This analysis is based solely on the quantification of crowd psychology.
It does not incorporate price action, trading volume, or macroeconomic indicators.
NASDAQ Needs some sideways relief but remains bullish.Nasdaq (NDX) continues to extend the new Bullish Leg of its 5-month Channel Up, having turned the 4H MA50 (blue trend-line) as its short-term Support, in line with both previous Bullish Legs.
We still expect at least a +9.59% rise, targeting 26300, to be completed before the pattern's new Higher High is priced but as the 4H RSI turned overbought (red circle), we expect the price to slow down a little, maybe seeking the 4H MA50 again as it happened in July.
In any event, the long-term trend remains bullish, until the 1D MA50 (red trend-line) breaks.
-------------------------------------------------------------------------------
** Please LIKE 👍, FOLLOW ✅, SHARE 🙌 and COMMENT ✍ if you enjoy this idea! Also share your ideas and charts in the comments section below! This is best way to keep it relevant, support us, keep the content here free and allow the idea to reach as many people as possible. **
-------------------------------------------------------------------------------
💸💸💸💸💸💸
👇 👇 👇 👇 👇 👇
Nasdaq100 Breakout Map – Bullish Targets Ahead?🕵️♂️ NDX/US100 “NASDAQ100” Market Wealth Strategy Map (Swing/Day Trade) 🚀
📊 Plan: Bullish Bias (Swing/Day Trade)
🎯 Entry Idea (Thief Layering Style):
Using a layering strategy (multiple limit orders). My preferred buy zones are:
🟢 24,300
🟢 24,400
🟢 24,500
🟢 24,600
(Feel free to adjust/add layers based on your own style — flexibility is key.)
🔒 Protective Stop (Thief SL):
❌ Around 24,000 (but note: this is just my map, you can manage risk as per your own plan).
💰 Target Area (Profit Zone):
🚧 25,500 = strong resistance barricade + overbought region + potential bull trap.
✅ My preferred exit: 25,400 (just before the “police barricade” 🚓).
⚠️ Note for Thief OG’s:
I’m not recommending to only follow my SL/TP. This is an educational trade map, not a fixed financial call. Adapt, adjust, and take profits your way.
🔑 Key Catalysts & Correlation Map:
Tech Sector Strength: US100 often mirrors mega-cap tech momentum ( NASDAQ:AAPL , NASDAQ:MSFT , NASDAQ:NVDA ).
Risk-On/Off Mood: Watch TVC:VIX — if fear spikes, layers may fill quicker.
Dollar Impact: TVC:DXY weakness often fuels NASDAQ:NDX upside.
Bond Yields: Higher yields = pressure on tech. Keep TVC:US10Y in your radar.
📌 Other Related Charts to Watch:
SP:SPX / CME_MINI:ES1! → Correlated US equity benchmark.
TVC:DXY → Inverse correlation (watch dollar moves).
TVC:VIX → Volatility indicator for risk sentiment.
BITSTAMP:BTCUSD → Risk sentiment cousin, moves with tech flows sometimes.
✨ “If you find value in my analysis, a 👍 and 🚀 boost is much appreciated — it helps me share more setups with the community!”
⚠️ Disclaimer:
This is a Thief Style Trading Strategy Map — created for fun, educational purposes, and market observation only. Not financial advice. Trade at your own risk, ladies & gentlemen. 🕵️♂️💸
#NASDAQ100 #NDX #US100 #SPX #Stocks #Indices #Trading #SwingTrade #DayTrade #LayeringStrategy #ThiefTrader

Can NQ1! Push Through $25K+ Resistance Zone?🎯 The Great NQ Heist: Layered Entry Strategy for E-Mini NASDAQ-100 Futures
📊 Market Overview
**Asset:** NQ1! (E-Mini NASDAQ-100 Futures)
**Strategy Type:** Swing/Day Trade - Wealth Accumulation Map
**Bias:** 🐂 **BULLISH**
🎭 The "Gentleman Thief" Layering Strategy
💰 Entry Philosophy: Layer Like a Pro
This setup uses a **sophisticated layering approach** - think of it as strategically placing multiple limit orders to capture the best average entry. You're not going all-in at one price; you're building your position like a chess master.
📍 Suggested Layer Entry Zones:
- 🎯 Layer 1: **24,800**
- 🎯 Layer 2: **24,900**
- 🎯 Layer 3: **25,000**
- 🎯 Layer 4: **25,100**
Note: You can scale in at ANY price level using this layering method. Add more layers based on your position size and risk tolerance. The beauty of this strategy is flexibility - enter where the market gives you opportunity! 🎪
🛡️ Risk Management
Stop Loss Zone: **24,700**
⚠️ **Important:** This is MY stop loss level based on technical structure. However, trading is a personal journey - YOU decide your own risk parameters. Protect your capital first, profits second. Your SL should align with YOUR risk tolerance and account size.
🎯 Profit Target
Target Zone: **25,600** 🚀
This level represents a confluence of:
- 💪 Strong resistance zone
- 📈 Overbought conditions
- Potential bull trap area
**Smart Exit Strategy:** As we approach this zone, consider scaling out of positions. Don't get greedy - take profits when the market offers them!
⚠️ **Reminder:** This is MY target projection. You're the captain of your own ship - take profits when YOU feel comfortable. Trail stops, scale out, or hold for moon - your money, your rules! 🌙
🔗 Related Pairs to Watch
Keep your eyes on these correlated instruments
- SEED_ALEXDRAYM_SHORTINTEREST2:NQ =F** - NASDAQ-100 Futures (spot reference)
- NASDAQ:QQQ - Invesco QQQ Trust (ETF equivalent)
- NASDAQ:AAPL , NASDAQ:MSFT , NASDAQ:NVDA , NASDAQ:GOOGL ** - Top NASDAQ-100 components
- NASDAQ:NDX - NASDAQ-100 Index (cash)
- CME_MINI:ES1! - E-Mini S&P 500 Futures (broader market correlation)
📌 Why these matter:** The NASDAQ-100 is tech-heavy, so major tech stocks drive NQ movement. Watch QQQ for retail sentiment and ES for overall risk appetite. When big tech moves, NQ follows! 💻
🎓 Strategy Breakdown
This "layering" or "scaling-in" approach offers several advantages:
- ✅ **Better average entry** - Dollar-cost averaging into position
- ✅ **Reduced timing risk** - Not dependent on perfect entry
- ✅ **Psychological comfort** - Builds confidence as position develops
- ✅ **Flexibility** - Adapt to market conditions in real-time
📢 Final Thoughts
The market rewards patience and discipline. This layered entry strategy is about working WITH the market, not against it. Whether you're a swing trader holding for days or a day trader scalping ticks, the principle remains: **Control your risk, let profits run.** 🏃♂️💨
✨ **If you find value in my analysis, a 👍 and 🚀 boost is much appreciated — it helps me share more setups with the community!**
**⚠️ DISCLAIMER:** This analysis represents a "gentleman thief" style layered trading strategy intended for educational and entertainment purposes only. This is NOT financial advice. Trading futures involves substantial risk of loss and is not suitable for all investors. Past performance is not indicative of future results. Always trade with risk capital you can afford to lose. Make your own trading decisions based on your personal risk tolerance, account size, and market analysis. 🎭📊
#NQ1 #NASDAQ100 #NASDAQFutures #EminiNQ #FuturesTrading #DayTrading #SwingTrading #TechnicalAnalysis #LayeringStrategy #ScalingIn #TradingSetup #FuturesMarket #TechFutures #NDX #QQQ #RiskManagement #TradingStrategy #MarketAnalysis #BullishSetup

QQQ : Stay heavy on positionsQQQ : Stay heavy on positions (QLD, TQQQ)
Entering a risk-on, high-volatility zone.
In stay light on positions zones, I hold QQQ and reduce exposure.
In stay heavy on positions zones, I increase allocation using a mix of QLD and TQQQ.
** This analysis is based solely on the quantification of crowd psychology.
It does not incorporate price action, trading volume, or macroeconomic indicators.

SPY : Stay heavy on positionsSPY : Stay heavy on positions (2x leverage)
Entering a risk-on, high-volatility zone.
In stay light on positions zones, I hold SPY(+QQQ) and reduce exposure.
In stay heavy on positions zones, I increase allocation using a mix of SSO(+QLD) and TQQQ.
** This analysis is based solely on the quantification of crowd psychology.
It does not incorporate price action, trading volume, or macroeconomic indicators.
NAS100 Why I'm Watching for a Countertrend Short on US100The NASDAQ (US100) has pushed aggressively into fresh all-time highs, tapping into a key liquidity zone where buy-side liquidity sits above previous swing highs. 📈💧
Price has extended without any meaningful pullback, suggesting we may soon see exhaustion and a corrective move. As we approach the end of the week, institutional traders often rebalance or close positions, which can trigger short-term retracements. 🏦🔄
If price breaks structure to the downside, I’ll be watching for a counter—
residing in a premium zone to—butter to the downside swings—for a potential countertrend—but—
🛑 Not financial advice. For educational purposes only.

NASDAQ 100 (NDX)-The Grand Super Cycle Journey🧠 The Grand Super Cycle Journey of NASDAQ 100 (NDX)
Here's a comprehensive, narrative-style description of NASDAQ 100 (NDX) INDEX based on Elliott Wave Theory , Smart Money Concepts (SMC) , Fibonacci Retracements/Extensions , Price Action , and Fundamentals across Super Cycle , Macro , and Micro Waves 🔍📈:
🌱 Super Cycle Wave 1: The Birth of Tech (1986–2000)
The journey begins with Wave 1 , ignited by the early tech boom — Microsoft, Intel, and the rise of Silicon Valley 🚀. This impulsive leg spans over a decade, culminating in the dot-com bubble peak in 2000.
🔹 Smart Money Insight: Early accumulation started in the '80s, followed by massive markup into the 1990s. Retail entered late, leading to the euphoric climax in 2000.
🔹 Price Action: Parabolic rallies, breakouts through historical resistance, ending in a massive overextension.
🔹 Fundamentals: Era of growth, innovation, low inflation, and initial internet adoption.
🌪️ Super Cycle Wave 2: The Great Correction (2000–2009)
The bursting of the dot-com bubble triggered a complex correction labeled as W-X-Y. This 9-year structure ends in the 2008–09 financial crisis low. The market retraced to the 0.382 Fibonacci level , a classic deep correction in a strong long-term bull market.
🔸 Smart Money: Distribution at the top → manipulation through global uncertainty (9/11, housing bubble) → reaccumulation near the 2009 lows 🧠📉.
🔸 Fundamentals: Enron scandal, 9/11, housing collapse, Lehman bankruptcy — a decade of fear and instability 🏚️.
🚀 Super Cycle Wave 3: The Exponential Phase (2009–2029)*
The most powerful leg — Wave 3 — is unfolding, targeting an eventual 2.618 Fibonacci extension (~85,000) . This wave is subdivided into 5 Macro Waves , each composed of 5 Micro Waves . Here's how the structure progresses:
⚙️ Macro Wave 1 (2009–2012)
Started at the GFC low, this wave marked the beginning of recovery, finishing with 5 orange micro waves .
🟠 Micro Waves: A clean 5-wave impulse showing the early stages of structural strength.
📊 Price Action: Break of structure (BoS) confirms bullish reversal.
🏦 Fundamentals: QE1/QE2, low interest rates, tech stabilization, birth of FAANG era 💻.
📈 Smart Money: Institutions started accumulating in late 2009–2010, reflected in tight consolidations and sharp rallies.
🔁 Macro Wave 2 (2012)
A brief and shallow correction within the bullish context — a classic bullish flag in terms of price action. Quickly ended with higher lows.
🧠 SMC: Short manipulation phase to shake weak hands.
📉 Price Action: Pullback respected prior structure — no trend break.
💥 Macro Wave 3 (2012–2021)
This was the largest and most explosive wave , extending over 9 years and forming 5 purple micro waves.
🟣 Micro Waves: Clean impulsive structure, confirming a classic Elliott wave fractal.
💡 Fundamentals:
Rise of cloud computing
Mobile-first economy
AI, semiconductors, and social media explosion
COVID-19 crash and rebound — the fastest recovery in history
🔹 Fibonacci: No deep retracements — sign of a healthy, powerful wave 3.
🧠 Smart Money: Deep accumulation during COVID crash → massive expansion post-March 2020 📈.
🧱 Macro Wave 4 (2021–2022)
A healthy correction that reset the structure — completed around the 2022 low. This wave maintained market structure integrity.
🔻 SMC: Liquidity sweep of previous lows + mitigation of demand zones.
📊 Price Action: Range-bound, bearish to neutral.
🌍 Macro Headwinds:
Interest rate hikes
Inflation fears
Global instability (Russia-Ukraine, energy crisis)
🧬 Macro Wave 5 (2022–2029) – Now Unfolding*
This is the final thrust of the Super Cycle Wave 3 , subdivided into 5 micro waves (current count in progress):
🔸 Micro Wave 1 ✅
Initial rally from 2022 lows, showing strong impulsive behavior.
🧠 Smart Money: Confirmed shift from reaccumulation to expansion.
🔸 Micro Wave 2 ✅
Pullback formed higher low — acted as final reaccumulation.
🔴 Micro Wave 3 – In Process (2025–2026)
This is expected to be the strongest wave within Macro Wave 5, projected to peak near 36,000 (2.618 extension of micro 1–2).
📈 Price Action: Aggressive higher highs and shallow pullbacks.
🧠 SMC: Expansion with little liquidity left below — institutions pushing price up.
💡 Fundamentals:
AI hypergrowth
US tech dominance
AI chips, quantum computing, tokenization
Renewed bullish risk appetite 🌐
🟠 Micro Wave 4 (Expected 2026–2027)
A corrective wave likely to retest the macro structure — forming a flag or triangle.
📉 Price Action: Sideways to downward chop, retracing 0.382–0.5 of wave 3.
🧠 SMC: Inducement setup before final rally.
🌍 Macro: Possible geopolitical or monetary tightening phase.
🔵 Micro Wave 5 (Expected Top in 2029)
The final leg of Macro Wave 5 and Super Cycle Wave 3. Expected to top near 85,000 , a 2.618% Fibonacci extension of Super Cycle Waves 1–2.
🎯 Final Parabolic Blow-Off
📊 Price Action: Euphoria, exponential rally, low-volume melt-up
📈 Smart Money: Final distribution phase — retail FOMO peaks
🧨 Fundamentals: Mania phase — “everything AI/metaverse/tokenized” narrative, record valuations, IPO booms.
🔮 Looking Beyond: Super Cycle Wave 4 (Post-2029)
Once the 85K target is met, a multi-year correction is expected — possibly deep and drawn out. Historically, Wave 4s retrace 0.236% to 0.382% and take years to unfold.
🧠 Expect:
Systemic debt pressure
Currency shifts
Economic reset themes
Potential Fed policy overcorrection
Liquidity crunch
🌧️ Super Cycle Wave 4 may retest previous demand zones around 30–36K.
📚 Final Thoughts
Our analysis represents an extraordinary blend of Elliott Wave fractals , institutional behavior (SMC) , and macro-fundamental alignment . We are in the late phase of a historical Super Cycle rally — but Wave 3 still has room to run 📈.
✅ Wave Count Aligned
✅ Fibonacci Extensions Respected
✅ SMC Structure Intact
✅ Macro-Fundamentals in Sync
📌 2025–2029 could be the final push before a generational correction. Smart investors must watch for distribution signs post-36K 📊.
"Trust the waves, not the noise." – FIBCOS 🌊
📘 Disclaimer: This is a structural, educational market outlook. Not financial advice. Please do your own due diligence and risk management.
#FIBCOS #ElliottWave #SmartMoneyConcept #MarketAnalysis #NASDAQ #XAUUSD #SuperCycle #MacroTrend #SmartMoney #Fibonacci #PriceAction #Commodities #Stocks #TechnicalAnalysis #LongTermOutlook

AMD could see further downsidePreviously, before the 10 Oct crash, I posted here () that AMD is timed for a pullback with $213 as a price to sell puts off.
It worked perfectly. NDX looked tired to the upside, thus, possible further pullback underway, with $195/$200 as price targets based on my confluence of algo levels.

GOLD Bull Market Price Target is 7 500 USD accumulate on dips🏆 Gold Market Long-Term Update 12/24 months
📊 Technical Outlook Update
🏆 Bull Market Overview
▪️2weeks/candle price chart
▪️Gold Bull market in progress
▪️1976/1979 650% gains - Bull Market 1
▪️1999/2012 650% gains - Bull Market 2
▪️2016/2027 650% gains- Bull Market 3
▪️Price Target BULLS 7500 USD
▪️650% gains off the lows
▪️will hit in 2026/2027
⭐️Recommended strategy
▪️BUY/HOLD accumulate dips
▪️BUY/HOLD physical gold
▪️BUY/HOLD GLD/GDX

$NDX Make or BreakNDX is consolidating in a triangle, and is now re-test 25200 strong level.
Inability to break above the triangle should see a break below the triangle and a move down to 24700 first.

NASDAQ100. HIGH PROBABILITY SETUP SOON!!!🚨 NAS100 HIGH PROBABILITY SELL SETUP 🚨
* Here We Can See Clearly The Next Potential Moves For US100 Coming Hours/Days.
* Keep Your Eyes Close On Your Trading Positions.
* Happy PIP Hunting Traders.
FXKILLA.

QQQ - NASDAQ Has Never Been This ExpensiveQQQ relative to the money supply reveals that markets have never been this expensive in history. Despite the significant amount of money pumped in during the COVID-19 pandemic, the economy has not kept pace with all the zeros added to Gov debt.
If we can't lower deficits now at max employment, when will we?
Tulips!
Caution is in order despite what "experts" may tell you.
Click like Follow Subscribe, let's get to 5,000 followers.

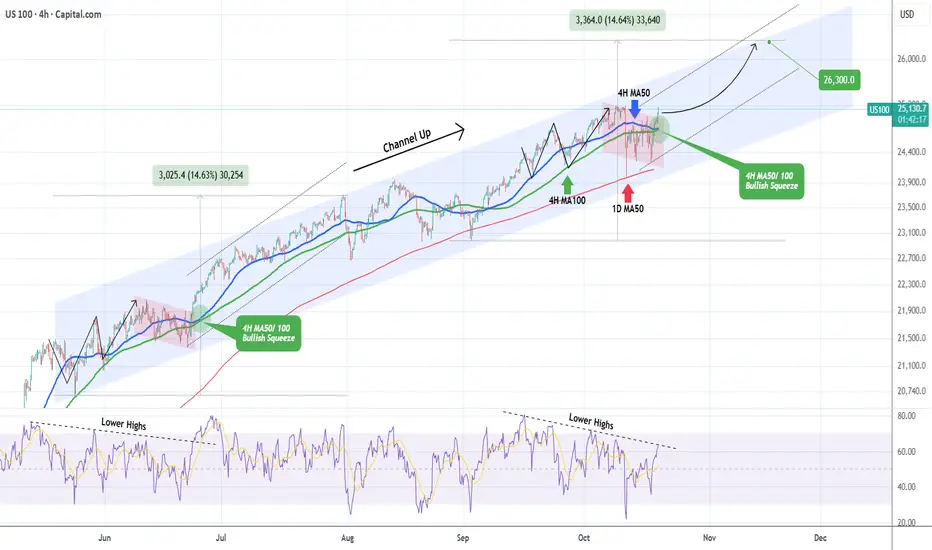
NASDAQ This bullish squeeze can push it to 26300.Nasdaq (NDX) has been trading within a Channel Up since the May 23 Low on its 4H MA100 (green trend-line). It appears that the index is getting out of the red Bearish Leg, which on the whole pattern serves as a Bull Flag for the next rally (Bullish Leg). Once the 4H RSI breaks above its Lower Highs trend-line, it will confirm the new Bullish Leg.
The last such RSI Lower Highs break-out was on June 23 when a similar 4H MA50/ 100 Bullish Squeeze took place. That was almost in the middle of a +14.63% rally in total before the index pulled back to its 1D MA50 (red trend-line).
As a result, once the 4H RSI break-out is finalized, we expect this run to reach at least 26300 (+14.63%).
-------------------------------------------------------------------------------
** Please LIKE 👍, FOLLOW ✅, SHARE 🙌 and COMMENT ✍ if you enjoy this idea! Also share your ideas and charts in the comments section below! This is best way to keep it relevant, support us, keep the content here free and allow the idea to reach as many people as possible. **
-------------------------------------------------------------------------------
💸💸💸💸💸💸
👇 👇 👇 👇 👇 👇