Nasdaq market analysis: 07-MAR-2025Let’s dive into today's Nasdaq market analysis. Share insights, and potentially spot opportunities for good pips.
NASDAQ 100 CFD

NASDAQ Ultimate Support test on the 1week MA50.Nasdaq / US100 is trading inside a Channel Up since the start of this Bull Cycle after the late 2022 bottom.
The price is about to test the 1week MA50, which is the ultimate Support of this bullish trend and has been holding since March 13 2023 (almost 2 years).
It is important for the index to keep a weekly closing over it. If it does we will have the most optimal buy entry case.
The previous two bullish waves interestingly enough both increased by +49.55%.
Buy and target 25500.
Follow us, like the idea and leave a comment below!!

NASDAQ: 4H Death Cross always signals a rally.Nasdaq in bearish on its 1D technical outlook (RSI = 38.073, MACD = -289.260, ADX = 41.209) as the mid February bearish wave hit the bottom of the September Channel Up. The formation of a Death Cross on the 4H timeframe has favored buying inside this pattern. In the meantime, the 4H RSI has been rising while the price was correcting, indicating the presence of a Bullish Divergence. Buy and aim for another +16% rise (TP = 23,200).
## If you like our free content follow our profile to get more daily ideas. ##
## Comments and likes are greatly appreciated. ##

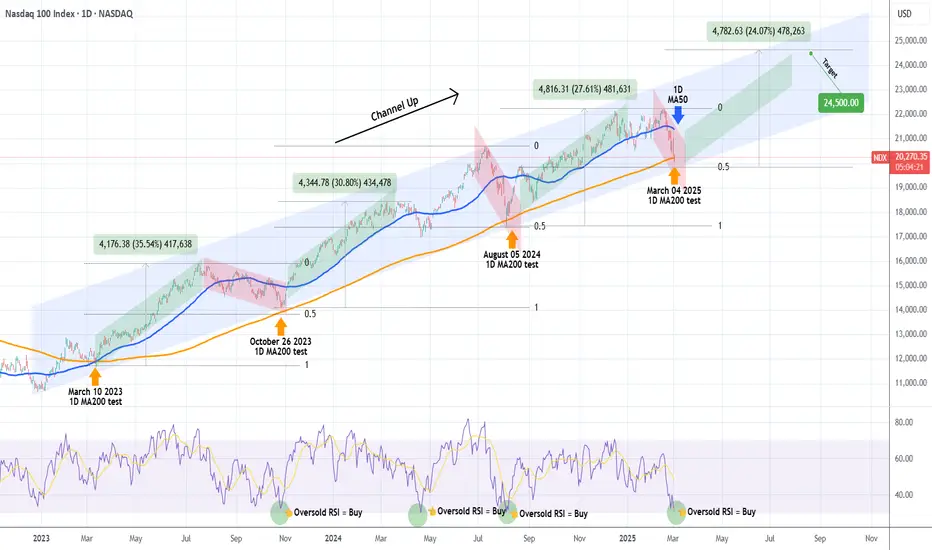
NASDAQ hit its 1D MA200. Strongest buy signal in 2 years!Nasdaq (NDX) hit today its 1D MA200 (orange trend-line) for the first time in 7 months (since the August 05 2024 Low) with its 1D RSI almost oversold (below 30.00). In the past 2 years (since the March 10 2023 test), the 1D MA200 has been tested another 3 times, all of which have been the absolute technical buy entries, kick-starting enormous rallies.
On top of that, the price is close to the bottom (Higher Lows trend-line) of the long-term Channel Up that started on the December 2022 market bottom. Every rally that followed after a 1D MA200 test has been marginally weaker than the previous but all three have been around +30% on average. The last one has been +27.61%, which is -3% weaker than the previous.
As a result, we are expecting a new rally to start now as all buy conditions within a 2-year span have been met (1D MA200, oversold 1D RSI) that can target 24500, which represents a +24.00% rally (-3% shorter rise than the previous).
-------------------------------------------------------------------------------
** Please LIKE 👍, FOLLOW ✅, SHARE 🙌 and COMMENT ✍ if you enjoy this idea! Also share your ideas and charts in the comments section below! This is best way to keep it relevant, support us, keep the content here free and allow the idea to reach as many people as possible. **
-------------------------------------------------------------------------------
💸💸💸💸💸💸
👇 👇 👇 👇 👇 👇
NASDAQ ENTRY ON THE FLOOR?! 4H chart Sep-Feb 27.2.25Simple up-trend with a recent confirmation of support.
September24 to Feb 25 is consistent and predictable with an average 7 to 11% rise from the support within a time frame of up to 6 weeks.
If the price closes a 4h candle below the line (20,850) - Up-trend will be broken, as long as the price keeps above, aiming for $800-$1500 swing trade up can be very profitable.
Make logical, consistent decisions based on an overall plan with risk management as top priority.

Nasdaq trading insights: 27-Feb-2025Nasdaq trading insights: Not signals, but informative zones to aid your decision-making. Please note: These zones are not trading advice. Use them as a starting point for your own analysis.

NASDAQ: Broke into the 2 year Support Zone.Nasdaq has turned bearish on its 1D technical outlook (RSI = 41/199, MACD = -42.030, ADX = 30.270) as the correction that started last Thursday hit the 1D MA100. The region between the 1D MA100 and 1D MA200 is the index's 2year Support Zone and has been a buy opportunity since February 2023. With the 1D RSI also on 6month lows, the current level is low enough to be a HL on the long term Channel Up, after which rallies to the 3.5 Fibonacci extension have started. Go long, TP = 24,000.
## If you like our free content follow our profile to get more daily ideas. ##
## Comments and likes are greatly appreciated. ##

S&P500 How Expensive Is It?The Average Wage Earner Needs To Work166.5 Hours To Buy One Share Of The S&P500
If this chart does not drive the point home. Nothing will.
Sometimes simple common sense is more powerful than all the fancy analysis one can buy or think of to create.
Price is what you pay, and value is what you get! Remember that my friends.
DANGER IS SCREAMING AT YOU!

NASDAQ Three conditions met for strong BUYNasdaq is trading inside a Channel Up in 2025 and today the price reached its bottom.
At the same time it marginally crossed under the MA100 (1d), making today's low the best technical buy opportunity since January 27th.
Trading Plan:
1. Buy on the current market price.
Targets:
1. 22370 (+6.92% rise like the previous two bullish waves).
Tips:
1. The RSI (4h) got oversold on the same level as the Jan 27th low. Overall, an oversold RSI on Nasdaq's last 6 month price action, has been a great buy opportunity.
Please like, follow and comment!!

Nasdaq market analysis: 25-Feb-2025Let’s dive into today's Nasdaq market analysis. Share insights, and potentially spot opportunities for good pips.

NASDAQ 4 more months before next correction.Nasdaq (NDX) has been rising non-stop with the 1W MA50 (blue trend-line) as its Support since it first broke above it in March 13 2023, following the 2022 Inflation Crisis Bear Cycle.
This continuous period of growth has been built on a prolonger Bearish Divergence based on the 1W RSI, which has been on Lower Highs since June 05 2023. It is not the first time in recent history that the index has seen this pattern, as in the last 10 years we have had 2 periods of similar growth.
The 2014 - 2015 phase came to a sudden end in the first week of January 2016 after having marginally topped above the 4.0 Fibonacci extension. The 1W RSI Bearish Divergence eventually kicked in and the price dipped below the 1W MA100 (green trend-line), while an RSI below 40.00 formed the bottom.
Similarly, the 2018 - 2019 phase got hammered in early February 2020 after topping very close to the 4.0 Fib ext, again sharply declining below the 1W MA100, finding support exactly on the 1W MA200 (orange trend-line). We need to point out that this was a (technically) exaggerated price collapse though due to the COVID lockdowns.
As mentioned above, we are facing again an RSI Bearish Divergence and if the price action follows the previous two periods that both, amazingly enough, lasted for 742 days (106 weeks) from the first RSI High, we should be expecting a technical peak around June 23 2025 (exactly 4 months from now) near a 4.0 Fibonacci extension at 23500.
-------------------------------------------------------------------------------
** Please LIKE 👍, FOLLOW ✅, SHARE 🙌 and COMMENT ✍ if you enjoy this idea! Also share your ideas and charts in the comments section below! This is best way to keep it relevant, support us, keep the content here free and allow the idea to reach as many people as possible. **
-------------------------------------------------------------------------------
Disclosure: I am part of Trade Nation's Influencer program and receive a monthly fee for using their TradingView charts in my analysis.
💸💸💸💸💸💸
👇 👇 👇 👇 👇 👇

Nasdaq market analysis: 24-Feb-2025Let’s dive into today's Nasdaq market analysis. Share insights, and potentially spot opportunities for good pips.

NASDAQ Approaching the ultimate 4hour MA200 buy entryNasdaq / US100 is trading inside a Channel Up, which is currently on a pullback.
This correction is approaching the pattern's bottom which happens to be on the 4hour MA200. The last two such contacts have been buy opportunities.
Also the 4hour RSI is oversold at 30.00 and the last two times it was on this level, they were again buy opportunities.
Buy and target the upper Resistance at 22230.
Follow us, like the idea and leave a comment below!!

NASDAQ: Opening selloff is a buy opportunity.Nasdaq remains bullish on its 1D technical outlook (RSI = 60.351, MACD = 161.240, ADX = 29.408) despite today's selling early into the session. This indicates that relative to the bullish long term trend, this correction is a buy opportunity, especially as the index hit its 4H MA50. This happens to be at the bottom of the 20day Channel Up, a pattern potentially identical to the December 10th low of the Channel Up. We are long, expecting a new +3.80% rise (TP = 22,700).
## If you like our free content follow our profile to get more daily ideas. ##
## Comments and likes are greatly appreciated. ##

NASDAQ The 3 Phase of its Bull Cycle.Nasdaq (NDX) had a strong closing last week, rallying aggressively after cementing the 4H MA50 (blue trend-line) as Support. As the market will stay closed today on Washington's Holiday, it is a good opportunity to take the time and look at the bigger picture.
Nasdaq's whole Bull Cycle so far since the late 2022 market bottom, can be categorized into 3 separate Phases of Growth. Right now we are naturally on the 3rd and as you see, compared to the previous Phases, we are on the 2nd accumulation of the Phase. This has led on a strong rally of at least +22% that completed each Phase.
Each Phase has two such accumulations and the 2nd is what makes the Channel Up peak and then correct back to the 1D MA200 (red trend-line). Since the final accumulation rally of Phase 1 has been +25.78% and the one of Phase 2 +22.13%, we may have a -3.50% decrease rate between each Phase rally. Assuming this to be the case this time around too, we may be looking for a +18.60% rally at 24000 to complete Phase 3.
-------------------------------------------------------------------------------
** Please LIKE 👍, FOLLOW ✅, SHARE 🙌 and COMMENT ✍ if you enjoy this idea! Also share your ideas and charts in the comments section below! This is best way to keep it relevant, support us, keep the content here free and allow the idea to reach as many people as possible. **
-------------------------------------------------------------------------------
💸💸💸💸💸💸
👇 👇 👇 👇 👇 👇

NASDAQ Massive Resistance breakout targeting 23000.Nasdaq / US100 is trading inside a Channel Up, which is testing today its Resistance, the previous higher high of the pattern.
When this took place duringt the previous bullish wave, the price stayed supported by the 1day MA50 and reached the 1.618 Fibonacci extension.
Buy and target 23000.
Follow us, like the idea and leave a comment below!!

Looking for TEM at $68I'm hoping to get into Tempus. Looking for $68 maybe it'll hit post earnings. Might have missed the bus, but just wanted to share that's my entry if it hits.
Good luck!

Nasdaq market analysis: 13-Feb-2025Good morning, traders! Welcome to today's Nasdaq market analysis. Compare my price action insights with your own charts and enhance your trading skills.

NASDAQ: Ready to break out of consolidation and aim for 24,600Nasdaq is neutral on its 1D technical outlook (RSI = 54.119, MACD = 45.480, ADX = 25.617) as it is trading sideways for the last 2 months. The 2 year Channel Up is intact and such consolidation patterns have broken out aggressively in the past to the new HH. As long as the 1W MA50 is supporting, the long term bullish trend will stay intact and we can aim for a total of +43% price increase (TP = 24,600) from the last HL, a -4% drop rate from the last one.
See how our prior idea has worked out:
## If you like our free content follow our profile to get more daily ideas. ##
## Comments and likes are greatly appreciated. ##

Nasdaq trading insights: 12-Feb-2025Nasdaq trading insights: Not signals, but informative zones to aid your decision-making. Please note: These zones are not trading advice. Use them as a starting point for your own analysis.

Nasdaq market analysis: 11-Feb-2025Good morning. Welcome to today's Nasdaq market analysis and educational insights for price action traders.

NASDAQ repeating the 2021 and 2019 rallies.Nasdaq (NDX) is about to complete a Cup and Handle (C&H) pattern. The whole sequence since the August 22 2024 High appears to be very similar with the price action that preceded the 2021 and 2019 C&H patterns.
As you can see, both of those pattern had an identical trend towards them and equally rally after them, which targeted the 2.618 Fibonacci extension.
If the current C&H is completed on the 4H MA200 (orange trend-line), it is reasonable to expect to continue to repeat those past patterns. As long as the 20600 Low doesn't break, we expect a June rally to 24650 at least.
-------------------------------------------------------------------------------
** Please LIKE 👍, FOLLOW ✅, SHARE 🙌 and COMMENT ✍ if you enjoy this idea! Also share your ideas and charts in the comments section below! This is best way to keep it relevant, support us, keep the content here free and allow the idea to reach as many people as possible. **
-------------------------------------------------------------------------------
💸💸💸💸💸💸
👇 👇 👇 👇 👇 👇

Nasdaq Industrial Bull Run Getting Ready!Basically we're just over the previous highs consolidating for the next big move up.
Industrials include retailers like Amazon and Costco and Electric vehicle companies Tesla and Rivian.
Good luck and stay bullish!
