possibility bof uptrendIt is expected that some fluctuation and correction will form within the current resistance zone, then there is a possibility of a trend change and the start of a downtrend.
As long as the index does not stabilize above the green resistance zone, a downtrend is likely.
Neo Wave

check the trendIt is expected that a trend change will form within the current support area and we will witness the beginning of the upward trend.
If the price breaks through the support zone, the continuation of the correction is likely.
If the price breaks through the support levels, the continuation of the downtrend is likely.

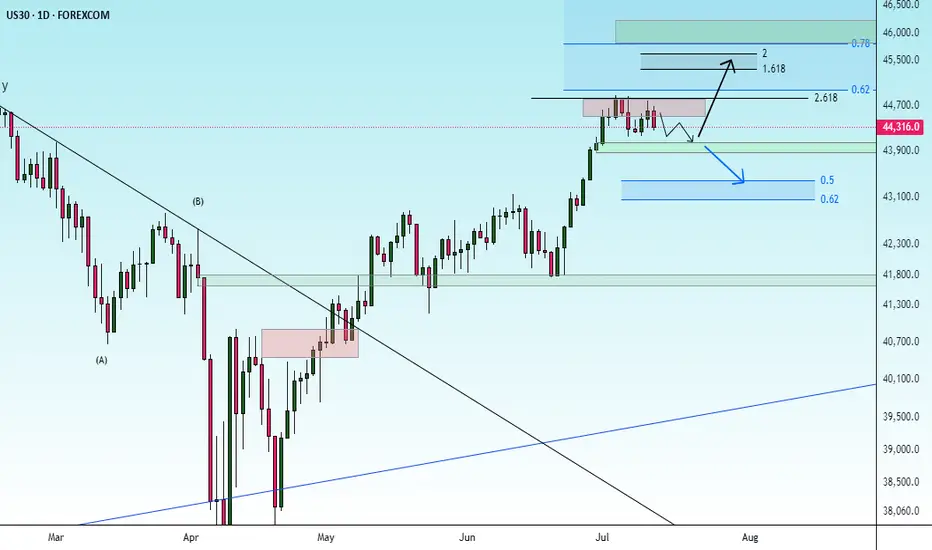
uptrendGiven the support trend line being broken, it is expected that the upward trend will form up to the specified resistance area and then a trend change will be likely. Then the continuation of the downward trend will be possible.

correctionIt is expected that after some correction and fluctuation, the continuation of the upward trend will form and the resistance area will be broken.
If the price breaks through the support area, the continuation of the downward trend is likely.

check the trendConsidering the price behavior in the current support area, possible scenarios have been identified. It is expected that a trend change will form in the current support area and we will see the start of an upward trend.
If the price passes the support area, the continuation of the downward trend will be likely.

correctionThe price is expected to advance until the specified time frame, then it is expected that a trend change will form and we will see the start of an upward trend. Passing the support area will cause the continuation of the downward trend.

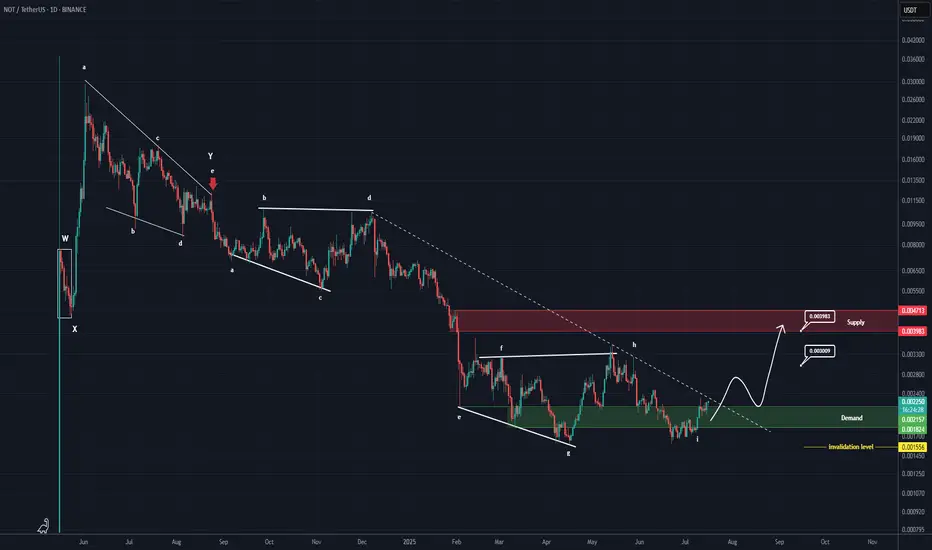
NOTCOIN New Update (1D)From the point where the red arrow is placed on the chart, the correction labeled as NOT has started.
The correction appears to be a symmetrical one, which now seems to be coming to an end. The current upward wave could be the X wave.
In previous analyses, we had also considered the structure to be symmetrical, but on a larger degree. However, based on the data currently available, it seems that the degree of this symmetrical structure is smaller.
If the price holds above the green zone, it may move toward the targets and the red box. The targets are marked on the chart.
A daily candle closing below the invalidation level will invalidate this analysis.
For risk management, please don't forget stop loss and capital management
When we reach the first target, save some profit and then change the stop to entry
Comment if you have any questions
Thank You
check the trendGiven the behavior of the index in the current support area, possible scenarios have been identified.
If the index breaks through the support area, a continuation of the downward trend will be likely.

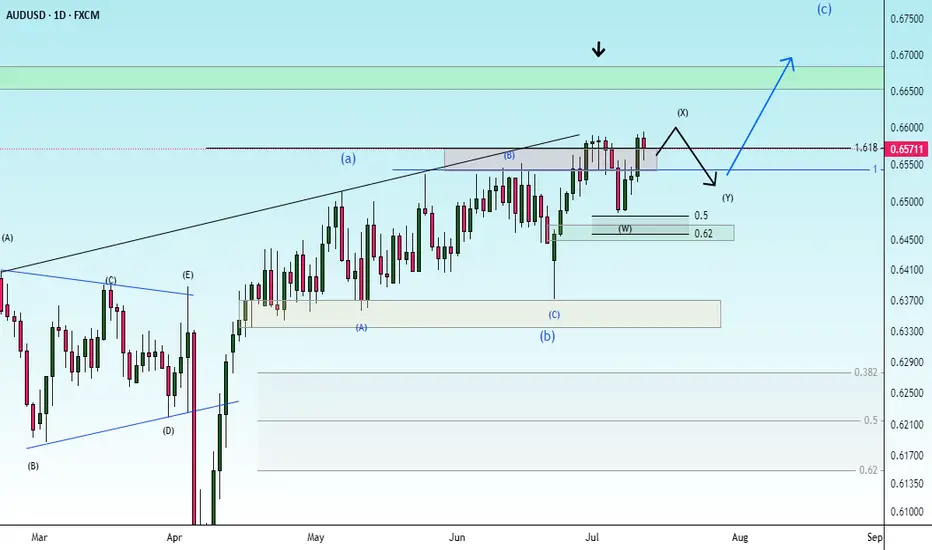
correctionGiven the completion of the current upward trend, the corrective pattern is expected to move along the specified path and go to the specified Fibonacci levels. Then the continuation of the upward trend will be possible.
correctionIt is expected that there will be a fluctuation in the current support area and then a change in trend. Then the continuation of the upward trend will be likely.
A break through the support area will cause a continuation of the downward trend.

NeoWave Structure: Flat–X–Triangle Combination - break outThis chart illustrates a possible NeoWave-style corrective combination: a Flat–X–Triangle structure, likely completed and followed by a breakout.
W Wave: A well-structured Flat correction (labeled A–B–C) with a clean internal 5-wave impulse in C. Balanced time and volume across subcomponents suggest structural completion.
X Wave: A simple, proportionally shallow X connector, in line with NeoWave time and price minimums.
Y Wave: A textbook contracting triangle (labeled a–b–c–d–e), with near-perfect Fibonacci relationships between legs:
• Wave b retraces approximately 61.8% of wave a
• Wave d retraces approximately 78.6% of wave c
• Time symmetry is preserved
• Volume compresses into the apex, a classic triangle behavior
Breakout Observed:
• Price has moved above triangle resistance
• Volume increased at breakout
• MACD shows positive crossover and rising momentum
Interpretation:
This may mark the end of a prolonged corrective structure and the beginning of a new impulsive sequence. Triangle projection targets suggest the $77–80 area as a minimum, with higher Fibonacci extensions possible (e.g., 1.618 or 2.618 of prior moves) if this evolves into a 3rd wave.
Technical Approach:
This analysis follows NeoWave principles (Glenn Neely), emphasizing structural clarity, wave proportion, time-price balance, and breakout behavior.

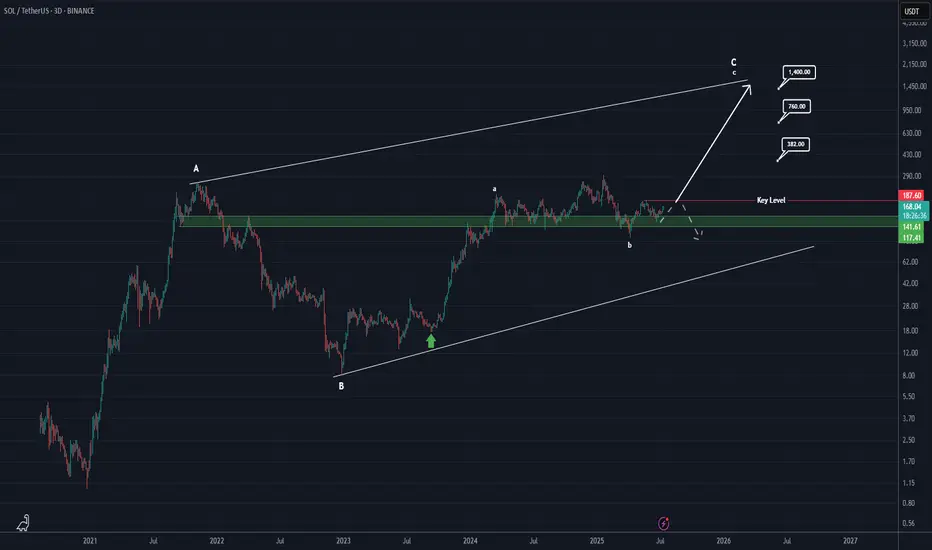
Will Solana reach $1400?After analyzing Solana’s complete data, it appears that a large diametric pattern is forming in the long term.
Currently, it seems we are in wave c of C.
If the key level of $187 is broken and price consolidates above it, we can be much more confident that we are indeed in wave c of C, confirming this scenario.
However, if the price fails to break and hold above $186 on higher timeframes like the 3D or weekly, and gets rejected downward, this scenario will be invalidated.
If confirmed, the targets for wave c of C are marked on the chart.
For risk management, please don't forget stop loss and capital management
When we reach the first target, save some profit and then change the stop to entry
Comment if you have any questions
Thank You
possibility of downtrendIt is expected that the upward trend will advance to the specified resistance range and then we will see a change in trend and the beginning of the downtrend.
If the index crosses the resistance range and consolidates above this range, the continuation of the upward trend will be likely.

check the trendIt is expected that the upward trend will pass the resistance range and with the stabilization above this range, we will see the continuation of the upward trend.
If the price crosses the support trend line, the continuation of the correction will be formed. And with the failure of the support range, the beginning of the downtrend of the scenario will be likely.

possibility of uptrendConsidering the price behavior in the current resistance range, possible scenarios have been identified. With the resistance range broken and stabilized above, a continuation of the upward trend is likely.

check the trendWith the current support range broken, a continuation of the downward trend to the next support levels is possible. Otherwise, with the support range stabilized above, an upward trend to the specified resistance levels is possible.

check the trendConsidering the price behavior in the current resistance area, possible scenarios have been identified.
If the price breaks through the resistance area, the continuation of the upward trend will be likely. Otherwise, a downward trend is possible with the support trend line broken.

correctionThe correction trend at the support levels and the support trend line is expected to end and then we will see the start of the upward trend. Otherwise, the continuation of the downward trend with the breakdown of the support area will be possible.

possibility of uptrendThe price is expected to break through the resistance area and continue the upward trend according to the specified path.
If there is strength in the upward trend, a c wave can be drawn.

correctionIt is expected to fluctuate within the current support level and then continue the upward trend.
If the index breaks through the green support level, the correction to the next support level is possible.
uptrendThe upward trend is expected to advance to the specified resistance level. Then, there is a possibility of a trend change and the correction will begin.

possibility of uptrendThe correction is expected to move in the specified direction and the correction pattern is completed. Then, we are expected to see the start of the upward trend.
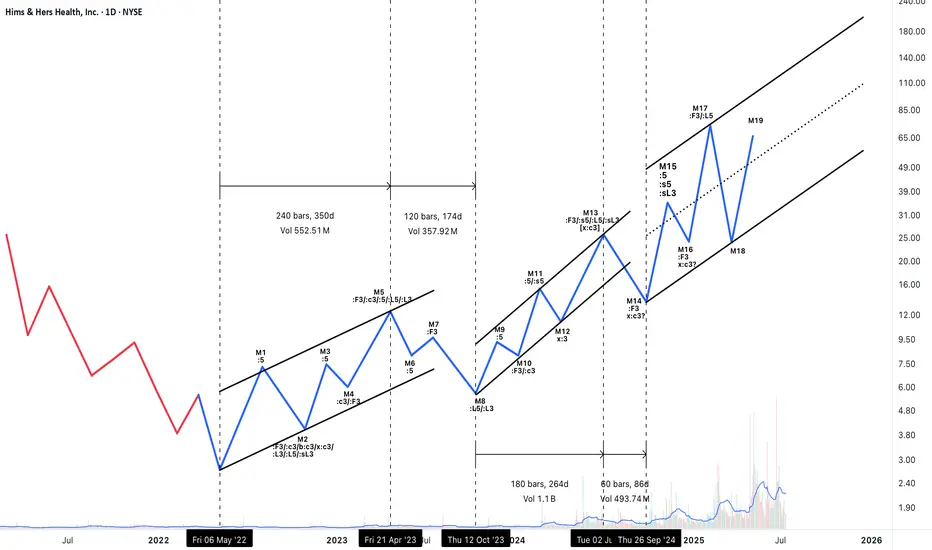
Neowave Structural Outlook – Complex Correction: W–X–Y–X–ZThis analysis interprets the ongoing structure as a Complex Correction in the form of a W–X–Y–X–Z pattern. Here's a breakdown of the logic behind the wave labeling and key observations:
Overall Structural Summary:
W wave (M1–M5): Though M1 is labeled as ":5", a closer examination of its internal structure reveals corrective characteristics. Therefore, the entire M1–M5 segment is best interpreted as a complex corrective structure, possibly a double three or flat.
X wave 1 (M6–M8): A clear Zigzag, fulfilling the requirements for a valid X. All relevant time and price criteria are met, forming a neat connector after W.
Y wave (M9–M13):
M9–M10: A Zigzag formation.
M11–M12–M13: M12 serves as an x-wave, and M13 unfolds as a simple corrective move in three waves, completing the Y wave. Though M13 is a single-leg visually, the internal structure confirms a three-part move.
The Y wave is longer in both time and complexity, appropriate for its position in the sequence.
X wave 2 (M14): Despite appearing as a short single move, it satisfies the X criteria in the context of the ongoing correction. The small size is acceptable as per rule allowances for connectors in Z formations.
Z wave (M15–ongoing):
M15–M17: Another Zigzag, forming the first leg of Z.
M18: Likely the X connector within Z.
M19: Assumed to be the beginning of the final leg of Z. The structure from here forward will determine whether Z completes as a triangle, zigzag, or another combination.
Supporting Rule Applications:
Several Neowave rules were cross-verified:
- Rule 2a and 5a were referenced to validate corrections that exceed the 61.8% retracement and duration benchmarks.
- Rule 7c and 4 supported impulse invalidations and corrections involving running structures.
Time symmetry across connectors and leg duration was considered to maintain wave consistency.
Visual Channels:
All W, Y, and Z legs are progressing within clearly defined channels.
The Z leg is currently within a steep rising channel. If Z completes as a non-triangular formation, a reversal might follow.
Conclusion & Risk Notes:
This structure, though corrective in nature, contains strong upward segments — especially within Z — making it tradable for bullish swings.
Given that Z is the final leg, caution is warranted. Once Z completes (especially if M19 develops into a three-wave structure), the larger correction may terminate, potentially leading to a larger trend reversal.
Position management (e.g., scaling out or using stop-losses) is advised as the structure evolves.