ETHUSDTHello every one🖐🏻
Chart is clear , demands area is in the table ,
Entry points for holders and futures traders is on ,( green sign)
Stop loss is under second area 🍌
Good luck and get rich all of you 💵🔥👑
Neo Wave

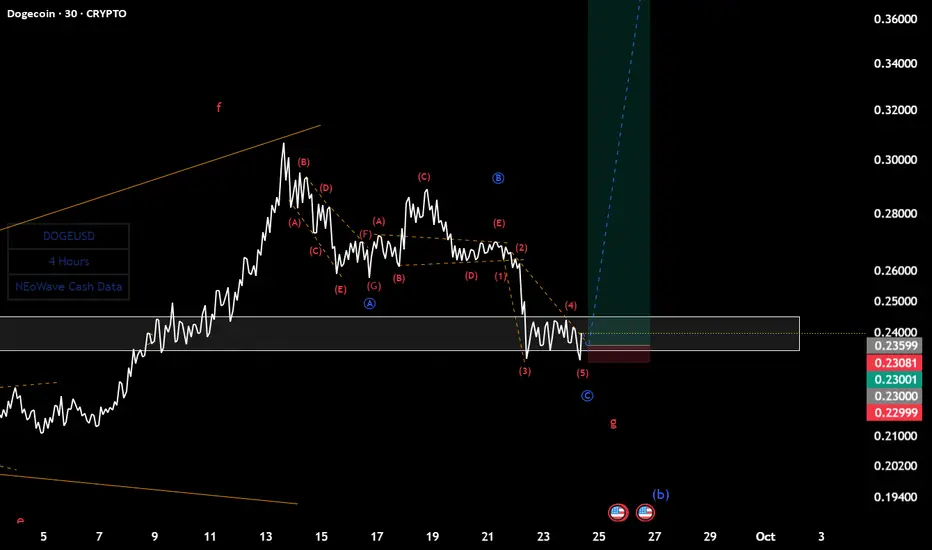
Doge(based on NEo wave)according to last counting of doge, under 0.23$ it means its a bow-tie diametric and it takes about 1 more week for correction.

Doge(based on NEowave)wave g of diametric shown as a flat and wave 5 of c is finishing the downtrend.
soon we should see a heavy bullish wave.
I think 0.23 is good for stop loss.
Bitcoin long term forecast The latest high of Bitcoin is forming on the weekly timeframe, and after that, a sharp Downward movement is expected. Its minimum target is $75,000, followed by a target of $60,000. Bitcoin is expected to fluctuate within a specific price range at least until October 2027, and after that, its price fluctuations may come to an end over different time periods.
If the price surpasses $125,000, this analysis will be invalidated.

BTC Looks Bearish (12H)From the point marked as **Start** on the chart, it seemed that a bullish phase had begun on Bitcoin. This bullish phase formed a triangle, and now we are at the end of this triangle.
With a pullback to the red zone, a further drop could occur. The main target of this bearish move appears to be the 88K channel.
This view remains valid unless a daily candle closes above the invalidation level.
For risk management, please don't forget stop loss and capital management
When we reach the first target, save some profit and then change the stop to entry
Comment if you have any questions
Thank You

ETH New Update (4H)This analysis is an update of the analysis you see in the "Related publications" section
Honestly, as you know, the market had been ranging for several days without much movement. On the chart, we had signs of a drop, but the drop didn’t happen, and instead the market dropped in a way that was shown.
Considering that the demand zone has held and the market is still ranging, we can return to the scenario of (this analysis () and expect to see some recoveries from Ethereum.
Either Ethereum can get rejected from the identified supply zone, or it can make a new all-time high afterwards.
For risk management, please don't forget stop loss and capital management
When we reach the first target, save some profit and then change the stop to entry
Comment if you have any questions
Thank You

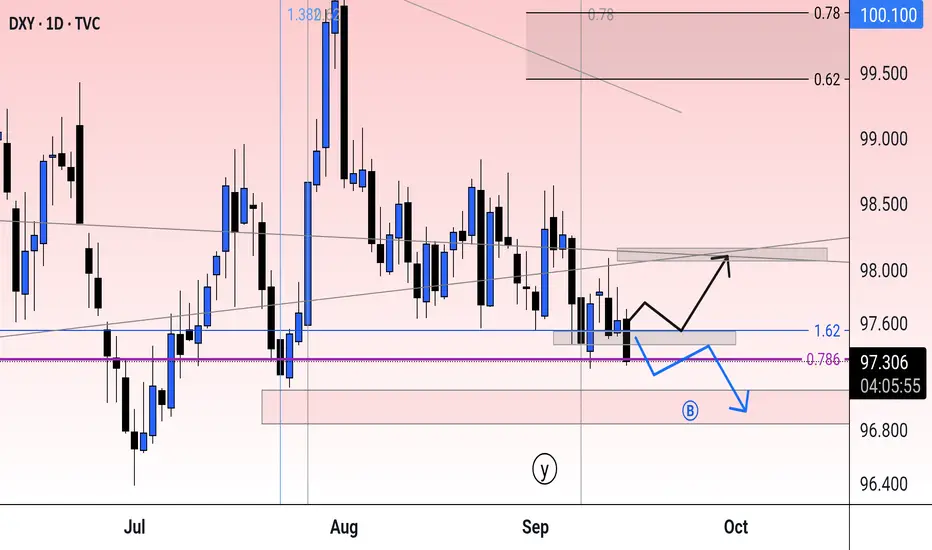
possibility of uptrend The corrective pattern is expected to end and we will see the start of an uptrend. A break of the resistance trend line will be a confirmation of the uptrend.
If the index breaks through the support area, a downtrend scenario will be likely.

uptrend As long as the price fluctuates above the support range, the continuation of the upward trend is likely. The identified resistance levels will be the targets of the upward trend.

possibility of uptrend It is expected that a triangle pattern will form and then we will see the start of the upward trend. With the support trend line broken, the continuation of the downward trend is likely.

check the trend Considering the price behavior in the current support range, possible scenarios have been identified. With the support range broken, the continuation of the downward trend is likely.

correction It is expected that a trend change will form at the current support level and we will witness the beginning of an upward trend. Otherwise, the continuation of the downward trend to the next support levels will be possible.

check the trendConsidering the price behavior at the support level and the support trend line, possible scenarios have been identified.
It is likely that a correction will form up to the support levels.

uptrendThe price is expected to stabilize above the current support level and then continue the upward trend. At the previous ceiling, there is a possibility of a trend change.

uptrend It is expected that the resistance area will be broken and the continuation of the upward trend will be formed and will continue until the specified Fibonacci levels.
If the support area is broken, a continuation of the downtrend is possible.

check the trend Given the price behavior within the current support area, it is expected that the upward trend will continue. Otherwise, a continuation of the downtrend is possible until the next support levels.

possibility of correction It is expected that the current support area will change and we will see the start of an upward trend. Otherwise, a continuation of the downtrend is possible until the next support levels.

QI Looks Super Bullish (3D)The price has reached a significant zone on the higher timeframes and has failed to create a lower low. Additionally, a major Change of Character (CH) has formed on the chart.
There are signs indicating that the price is attempting to form a double bottom on the higher timeframes.
We have identified two entry points for taking a spot position.
The closure of a daily candle below the invalidation level will invalidate this analysis.
For risk management, please don't forget stop loss and capital management
When we reach the first target, save some profit and then change the stop to entry
Comment if you have any questions
Thank You

TRUMP COIN ANALYSIS (1D)It seems this token is risky and is currently forming a diametric pattern, where we are now in wave **e** of the structure. In the green zones marked as our entry areas, you may gradually enter in spot positions. To capture wave **f** of this diametric, you need to manage your expectations regarding its potential.
The targets are marked on the chart.
This outlook will only be invalidated if a daily candle closes below the invalidation level.
For risk management, please don't forget stop loss and capital management
Comment if you have any questions
Thank You

BTC/USDTI think wave A of C is complete, so I will enter a buy position with this setup for wave B of C.

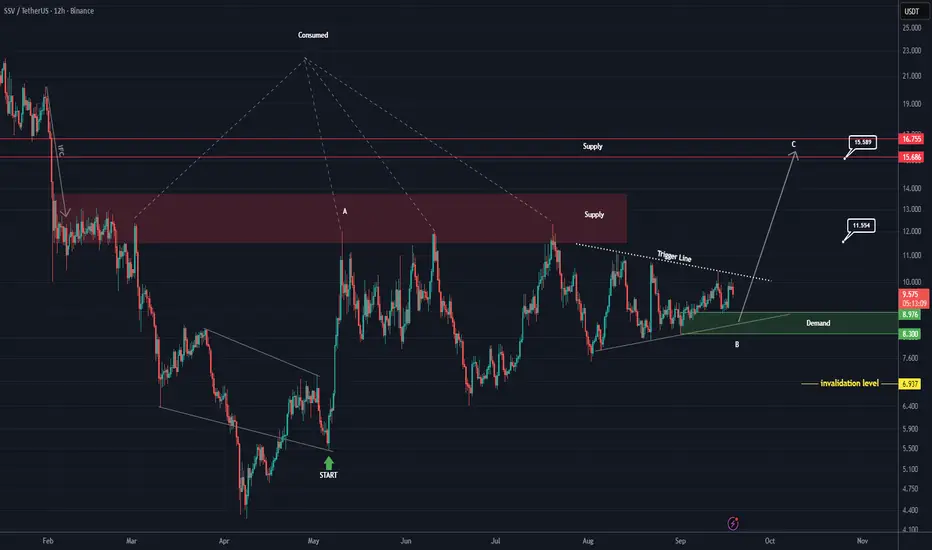
SSV Looks Bullish (12H)A supply zone has been highlighted on the chart. This supply has been consumed many times, yet no lower low has been formed. Also, from the point where we marked it on the chart, a bullish move started. After this bullish move, the price is currently forming a range. It seems that the initial move is wave A of the new pattern, and the ranging move is wave B.
As long as the green zone holds, the price can move toward the targets. Once the trigger line is broken, we will have further confirmations.
A daily candle closing below the invalidation level will invalidate this analysis.
For risk management, please don't forget stop loss and capital management
When we reach the first target, save some profit and then change the stop to entry
Comment if you have any questions
Thank You

Possibility of correction Given the behavior of the index within the current support range, possible scenarios have been identified. If the index breaks through the support range, a continuation of the downward trend is likely.