NETFLIX ($NFLX): Key Technical Zone With Strong ConfluenceNETFLIX ( NASDAQ:NFLX ): Key Technical Zone With Strong Confluence
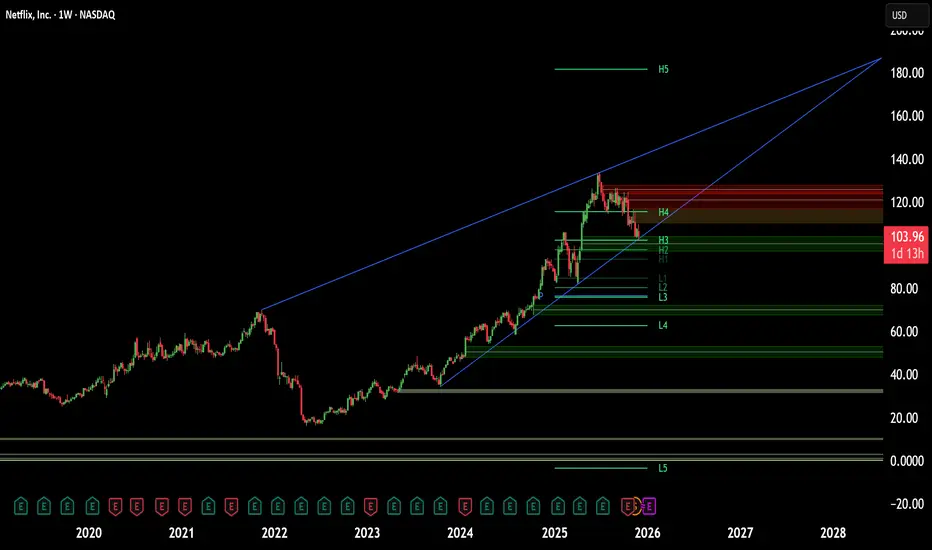
Netflix has retraced to a notable support area after reaching an all-time high on June 30th, 2025. The current structure suggests a potential continuation of the long-term bullish trend, supported by technical and fundamental developments.
Why This Zone Matters
The current price region aligns with multiple significant technical factors:
1. Ascending Trendline Support
This trendline originated in mid-October 2023 and has repeatedly acted as a strong support throughout the uptrend.
2. $100 Psychological Price Level
Round numbers often serve as key decision zones for market participants, influencing order flow and trader sentiment.
3. Fibonacci 61.8% Retracement Zone
This level aligns closely with the trendline and psychological level, adding strength to the support.
4. Multi-Factor Confluence
The combination of the trendline, Fibonacci level, and psychological support creates a high-value technical confluence area, often associated with trend continuation or major reversals.
Market Catalyst
Recent reports of Netflix acquiring Warner Bros. Discovery add a potential fundamental driver supporting bullish momentum.
Trade Plan
Entry $100
Take Profit 1 $126
Take Profit 2 $133
Stop Loss $92
Risk-to-Reward (TP1) 1:3.3
Risk-to-Reward (TP2) 1:4
This trade plan is based on the TA that price respects the current support confluence and resumes upward momentum.
Trade with care. Please like, share your thoughts, and kindly follow me.
Netflix

Breaking: Netflix to Acquire Warner Bros Inc (WBD) is up 3.7%In a shocking turn of event, Netflix is set to acquire Warner Bros Inc. (WBD).
Netflix announced that it will acquire the HBO Max streaming service as well as the Warner Bros. film studio from Warner Bros. Discovery. The deal values the company at $27.75 per share, which implies a $72 billion equity valuation for the assets. The company will also assume $10.7 billion in net debt on Warner Bros. Discovery's balance sheet.
The acquisition is a cash-and-stock deal. Warner Bros. Discovery shareholders will receive $23.50 in cash for each share they own, plus $4.50 in Netflix stock.
Netflix investors should be aware that the company is financing this deal primarily with debt. In addition to the $10.7 billion in net debt the acquired company brings, Netflix is taking on an additional $50 billion in debt to fund the purchase.
Technical Outlook
as of the time of writing, NASDAQ:WBD is up 3.44% breaking out of a bullish symmetrical triangle as the stock eyes the $50 resistant zone. However, with the RSI at 74 possible drawback might occur before the leap.
About WBD
Warner Bros. Discovery, Inc. operates as a media and entertainment company worldwide. It operates through three segments: Studios, Network, and DTC. The Studios segment produces and releases feature films for initial exhibition in theaters; produces and licenses television programs to its networks and third parties and direct-to-consumer services; distributes films and television programs to various third parties and internal television; and offers streaming services and distribution through the home entertainment market

NETFLIX - Bottom is in?NASDAQ:NFLX
The bottom looks close based on this weekly chart.
- Deeply oversold RSI
- Bounced off the POC in anchored volume profile
- W%R deeply oversold and starting to curl up
Overall, the acquisition of WBD is expensive, but Netflix is playing the long game.
This provides content as far as the eye can see with the addition of DC, GoT series, and more.
Overall it's a blockbuster, but I feel NFLX reaching a $1T market cap is inevitable... currently sitting sub $500B.

Netflix’s $70B Bid: The End of the Streaming Wars?Netflix (NASDAQ: NFLX) is rewriting the global media playbook. The streaming titan has submitted a binding, predominantly cash offer to acquire Warner Bros. Discovery (NASDAQ: WBD). This $70 billion maneuver marks a definitive pivot from disruptive builder to dominant consolidator. Management now signals that securing the next decade of dominance requires buying the industry’s most established moats.
Macroeconomics: The Power of Cash
Financial maturity drives this aggressive acquisition strategy. In a high-interest-rate environment, cash offers reign supreme. Netflix utilizes its fortress balance sheet to outmaneuver the rival Paramount Skydance consortium. While competitors propose complex stock swaps, Netflix offers WBD shareholders immediate liquidity and a defined exit price. With a projected Free Cash Flow of $9 billion for 2025, the company can service the necessary bridge loans without jeopardizing operations.
Geostrategy: The Regulatory Battlefield
The acquisition’s greatest threat lies in Washington, not Wall Street. White House officials have flagged concerns regarding media consolidation. However, Netflix utilizes a sophisticated geostrategic argument. The company contends it competes against trillion-dollar ecosystems like Apple and Amazon, not just legacy studios. By framing the merger as essential for surviving against Big Tech, Netflix aims to navigate the Department of Justice’s antitrust maze.
Industry Trends: Buying Cultural Infrastructure
Netflix is purchasing history, not just content. The deal secures the DC Universe, Harry Potter, and the historic Warner Bros. Studio lot. These assets represent "cultural infrastructure" that original production spend cannot replicate. Data from WBD’s Q3 2025 earnings confirms the value here: theatrical revenue surged 74% driven by franchise hits. This allows Netflix to diversify revenue streams into box office and merchandising at an unprecedented scale.
Technology & Cyber: The Traffic Signal
Platform stability remains a key indicator of consumer demand. The recent premiere of *Stranger Things* Season 5 crashed the platform, causing widespread outages. While technically a failure, Wall Street interprets this cyber-stress test as a bullish signal. It proves organic engagement is explosive. Integrating WBD’s library into this high-traffic ecosystem leverages Netflix’s proprietary delivery architecture to maximize viewership of dormant assets.
Management & Leadership: The Strategic Pivot
Netflix leadership is executing a calculated evolution. For 15 years, the strategy focused on building IP from scratch. Now, the C-suite recognizes that acquiring established franchises is the fastest route to a defensible moat. This assertiveness reflects confidence. With a market cap of roughly $460 billion, they are acquiring WBD because they can, not because they must to survive.
Data Science & Innovation: The Algorithmic Multiplier
The true value unlocked lies in data science. Netflix’s proprietary recommendation algorithms will likely revitalize WBD’s deep library. Merging WBD’s content with Netflix’s user data creates a powerful feedback loop. This "algorithmic multiplier" ensures that back-catalog titles achieve higher engagement on Netflix than they ever could on standalone platforms. This technological synergy justifies the premium paid for the assets.
Conclusion: A New Media Era
Netflix is positioning itself to own the entire entertainment ecosystem. The deal eliminates a key competitor and secures irrefutable IP dominance. While the $109 stock price held firm, the long-term thesis has shifted. Netflix is no longer just a tech platform; it is becoming the definitive media empire of the 21st century.
Netflix: Long-Term Buy Zone in Focus Netflix shares have recently turned lower, moving towards our previously identified long-term entry zone between $96.27 and $75.19. Within this range, we expect the low of the turquoise wave 4 to form, setting the stage for the ongoing upward impulse in wave 5 to push past resistance at $134.11. In a new alternative scenario, there is a 30% probability that the beige wave alt.IV could establish a lower low below $81.27, though it would still remain within the long-term entry zone

NFLX — Bullish Structure Above 32.65 with Target at 154.29Summary:
Netflix (NFLX) maintains a broader bullish structure as long as price holds above the major key support at 32.65. Current retracement remains healthy within the Fibonacci levels, and buyers are still defending the mid-range supports.
Analysis:
Price is currently consolidating between the 0.5 Fib (85.28) and the 0.75 Fib (119.79) after a strong impulsive rally from the 32.65 base. The inability of bears to break below 32.65 confirms this zone as a long-term structural support. As long as price stays above this level, deeper bearish continuation remains unlikely.
A reclaim above 119.79 (0.75 Fib) would reopen the path toward 140.49 (0.9 Fib) and ultimately the major target at 154.29 (1.0 extension).
On the downside, a corrective pullback toward 71.48 (0.4 Fib) remains possible but does not invalidate the bullish macro trend unless 32.65 is broken.

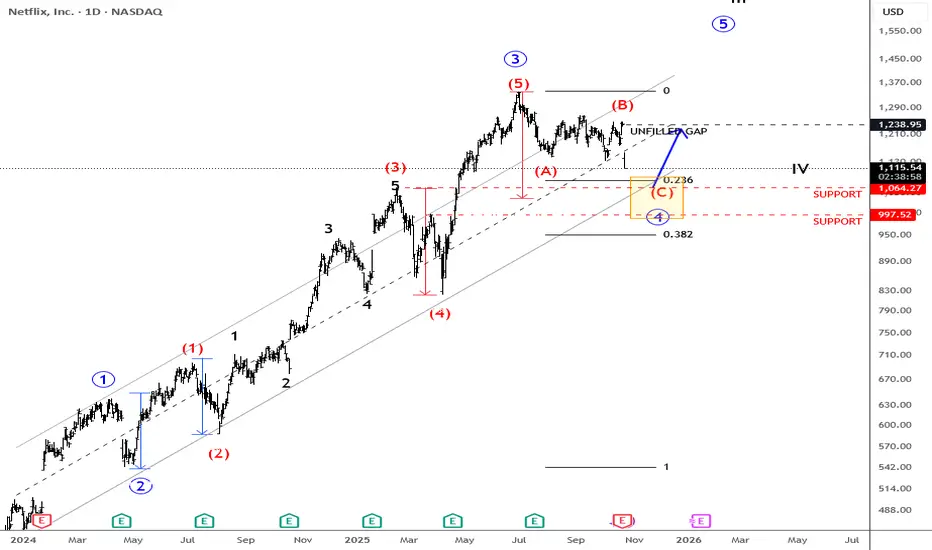
Netflix Down After Earning, But Its Hunting SupportNetflix is coming down after earnings and is currently trading more than 10% lower. Whenever we see such a sharp reversal, it’s important to zoom out and look at the broader trend. From the 2023 lows, there is still a very strong and impulsive recovery, so this could be just a temporary deeper corrective pause before the uptrend resumes.
In Elliott Wave terms, it looks like a potential fourth wave retracement that could start to stabilize somewhere around the previous wave three high near the 1060 area, or possibly a bit lower, closer to the 1K level. This whole zone could be quite attractive for a rebound, especially since some of the gaps above the current price may still be filled — something that often happens when a stock remains in an uptrend.
In my view, there’s still a good chance for a nice recovery and continuation higher in the weeks to come.
Grega
Highlights:
Trend: Bullish (consolidation in wave four approaching support)
Support: 1060, 1000
Resistance: 1260
Note: Stock can stabilize after wave 4 and try to fill the earnings gap at some point in the future.
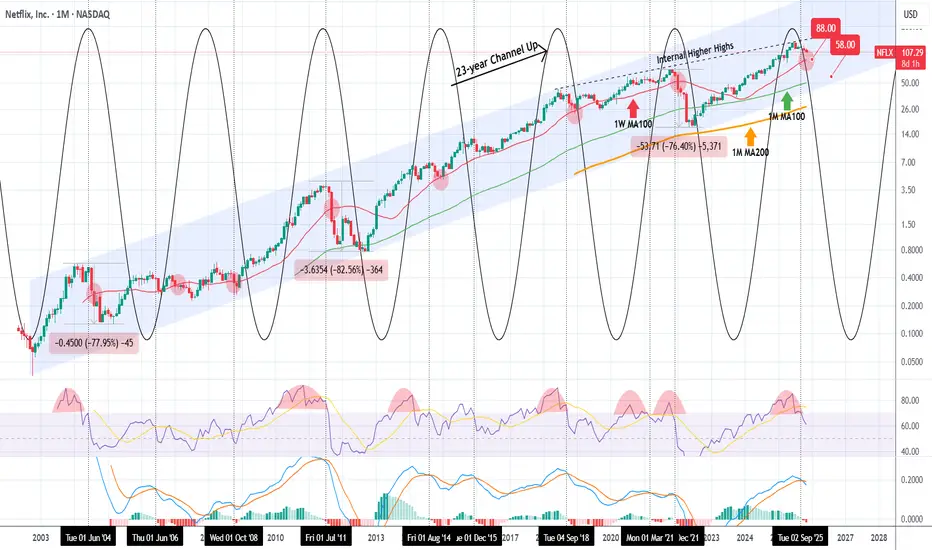
NETFLIX 23-year pattern started a correction. Could be massive.A month ago (October 14, see chart below) we published the following chart on Netflix (NFLX) calling for a strong correction, but the immediate split has distorted the price:
We thought it would be a good time to publish it again with the current price action and with the addition of its 23-year Channel Up, so that people can have a much better understanding of the multi-year dynamics involved.
As you can see, the price has been rejected 4 months ago on the 7-year Internal Higher Highs trend-line that started on June 2018. Both previous rejections on that trend-line hit at least the 1W MA100 (red trend-line), the 2022 one even broke below the 1M MA100 (green trend-line) and almost touched the 1M MA200 (orange trend-line).
Both those rejections, as well as the current one, had another two things in common. A 1M MACD Bearish Cross and a 1M RSI bearish reversal from overbought (>70.00) territory. Those tops are fairly accurately displayed by the use of the time cycles. Even from the very start of this 23-year Channel Up.
As a result, this model suggests that the stock has clearly topped and is entering a Bear Cycle or at least a correction to the 1W MA100. That is why our first Target is at $88.00. If the market closes a 1M candle below the 1W MA100, as in January 2022, September 2011, August 2004 (all same Cycle Top conditions as described above), we even expect a deeper correction towards the bottom of the 23-year Channel Up. In that case our Target will be $58.00, potentially making contact with the 1M MA100.
---
** Please LIKE 👍, FOLLOW ✅, SHARE 🙌 and COMMENT ✍ if you enjoy this idea! Also share your ideas and charts in the comments section below! This is best way to keep it relevant, support us, keep the content here free and allow the idea to reach as many people as possible. **
---
💸💸💸💸💸💸
👇 👇 👇 👇 👇 👇
Netflix (NFLX) - Elliott Wave Map to $25K📘 Netflix (NFLX) – The Final Act of Supercycle Wave III, Setting the Stage for Wave V to $25,000+
Symbol: NASDAQ:NFLX
Timeframe: Monthly
Published: October 2025
Current Price: ~$1,120
Framework: Elliott Wave | Fibonacci Extensions | Price Action | Smart Money Concepts (SMC) | Fundamentals
🔍 Structural Overview – Supercycle Journey
Netflix has been moving through a multi-decade Elliott Wave supercycle that began in the early 2000s. This structural roadmap is now approaching the final phase of Wave III, before setting up for a corrective Wave IV and ultimately a euphoric Wave V.
Supercycle Wave I completed in January 2004 — a powerful impulse that marked Netflix’s transition into a mainstream tech-growth story.
Supercycle Wave II followed, completing in 2008 with a healthy 50% retracement. This wave set the long-term demand foundation and concluded right as the global financial crisis unfolded.
We are now in Supercycle Wave III, which began in 2008 and is currently in its final macro wave — the most dynamic phase of the entire structure.
⚙️ Breakdown of Supercycle Wave III (2008–2026 est.)
Wave III itself subdivides into five clear macro waves, each respecting Fibonacci and structural principles:
Macro Wave 1 ran from the 2008 bottom into mid-2011, kickstarting the secular bull trend.
Macro Wave 2 ended in 2012 with a textbook 0.618 Fibonacci retracement , a classic sign of wave-based correction.
Macro Wave 3 , the most explosive move of the cycle, lasted until 2018 and terminated near a 2.618 Fibonacci extension — a key confluence area and institutional distribution point.
Macro Wave 4 then corrected from 2018 to 2022. However, this retracement was shallow, bouncing from the 0.236 level — preserving long-term bullish market structure and confirming continued institutional control.
We are currently in Macro Wave 5 of Supercycle III . This leg is itself subdividing into five micro waves. Micro waves 1, 2, and 3 have already completed. Micro Wave 4 is now unfolding and is expected to bottom inside the Golden Pocket — the critical Fibonacci zone between approximately $771 and $548 .
Once Micro Wave 4 completes, Micro Wave 5 will initiate. This final thrust is expected to target the region near $7,447 — the 2.618 extension from prior waves. This level aligns with structural channel tops and institutional profit zones. It would also mark the formal completion of Supercycle Wave III .
🧭 What Comes Next: Supercycle Wave IV and V
After Wave III completes at the ~$7,44 7 area, a significant correction is expected.
Supercycle Wave IV will be the most complex corrective structure since 2008 — possibly multi-year, combining flat, zig-zag, or triangle formations. This wave will likely retrace a large portion of Wave III and reset sentiment across the broader market.
But this correction is not the end — it’s the setup.
Supercycle Wave V will emerge from the Wave IV base and drive Netflix into its ultimate secular top . Based on the Fibonacci 4.618 extension from the base of the cycle, Wave V is projected to reach the $24,774 to $25,332 range.
This would be the euphoric blow-off move where fundamentals, monetary policy, and sentiment combine to form a parabolic top — consistent with historical market cycle conclusions.
📐 Fibonacci Confluence Zones
Each major wave has respected key Fibonacci ratios . Wave II retraced to 0.50, Wave III extended to 2.618, and Wave IV retraced to 0.236. Current projections place Wave V near the 4.618 extension level — a historically significant threshold for secular tops.
The current Micro Wave 4 pullback is unfolding into the Golden Pocket zone — the 0.618–0.65 retracement range — which has repeatedly served as the institutional reaccumulation zone across prior waves.
🧠 Smart Money Behavior
Smart Money Concepts further validate this wave count:
In 2018 , we saw classic signs of institutional distribution at the top of Macro Wave 3 — including high-volume price exhaustion, deviation from trend, and liquidity sweeps.
Between 2018 and 2022, accumulation returned during Wave 4, as institutional players re-entered at discounted levels and retested key demand blocks .
The 2022 breakout into Macro Wave 5 has been efficient, clean, and impulsive — with minimal resistance and wide-range bullish candles, signaling continued institutional participation.
The current Wave 4 micro correction may again serve as a liquidity grab — offering another accumulation window before the final markup toward the $7,447 zone.
🔍 Netflix Fundamentals – Fueling the Cycle
Netflix's fundamentals are now structurally aligned with the technical setup:
Diversified Monetization:
The shift from pure subscription to a multi-layered model (ad-supported tiers, gaming, IP licensing, live events) is broadening both revenues and engagement.
Ad-Supported Growth:
Netflix’s advertising business is scaling rapidly, offering higher ARPU and access to price-sensitive users — a major tailwind for Wave V.
Global Expansion:
With strong localization strategies, Netflix continues to dominate key international markets, boosting user stickiness and content ROI.
Strong Financials:
Consistent free cash flow, improving margins, and disciplined content spend are creating a sustainable growth engine.
These dynamics are not just supporting price — they are helping to drive the type of institutional confidence needed for Wave V to materialize.
🎯 Strategic Levels and Outlook
Watch the Golden Pocket between $771–$548 — this is the high-probability completion zone for Micro Wave 4.
Once Micro Wave 5 begins, price is expected to rally toward $7,447 — the projected top of Supercycle Wave III.
After a broad correction during Wave IV, the final Wave V is projected to target $24,774 to $25,332 — where the entire super-cycle would culminate.
🔚 Final Word
Netflix is moving through the final stages of a 20-year Supercycle Wave III — one of the strongest impulsive phases in equity history. The micro pullback underway now is not a sign of weakness, but a preparation for the final push.
Wave IV will offer the last major reset before a euphoric Wave V redefines valuations. If the fundamental narrative continues to align, the $25K target is not speculative — it’s structural.
📘 Disclaimer: This analysis is for educational purposes and is not financial advice. Always do your own due diligence and risk management.
#NFLX #Netflix #NASDAQ #ElliottWave #TechnicalAnalysis #WaveTheory #Fibonacci #Supercycle #PriceAction #LongTermInvestment
💬 Respected traders and analysts!
Your insights matter. Share your views, confirmations, or constructive criticism in the comments below. Let’s build a high-quality discussion around Netflix’s structural evolution and long-term investment context.
— Team FIBCOS

Netflix Inc Eyes Video Podcast Expansion Amid Platform EvolutionNetflix Inc. (NASDAQ: NASDAQ:NFLX ) appears ready to expand its media ecosystem once again — this time, into the growing world of video podcasts. Following its recent partnership with Spotify that introduced 16 video podcasts to the platform, Bloomberg now reports that Netflix is developing its own lineup of original video podcasts to be featured exclusively on its streaming service.
The move aligns with Netflix’s ongoing strategy of diversifying beyond traditional film and TV content. Sources familiar with the plans suggest Netflix has already reached out to creators to produce original podcast shows, while also negotiating licensing deals with major audio players like iHeartMedia and SiriusXM. The company’s early licensing strategy appears experimental, offering one-year deals, some reportedly valued under $10 million, as Netflix gauges consumer interest and platform performance in this new category.
Internally, Netflix is said to be redesigning parts of its mobile app interface to better highlight podcast content, indicating that management sees potential in expanding the discovery experience beyond scripted or reality-based programming. This could allow the company to position itself as a one-stop entertainment hub, uniting streaming, documentaries, live events, gaming, and now, video podcasts, under one user ecosystem.
Technically, the stock chart for NASDAQ:NFLX shows price action consolidating near the $1,100–$1,150 zone, supported by a long-term ascending trendline. If this level holds, a rebound toward $1,341 previous highs could be the next leg higher, consistent with Netflix’s broader narrative of innovation-driven growth.
With audio-visual storytelling becoming an increasingly dominant medium, Netflix’s entrance into video podcasts could mark another pivotal moment, one that reinforces its dominance not only in streaming entertainment but also in the creator-driven content landscape.

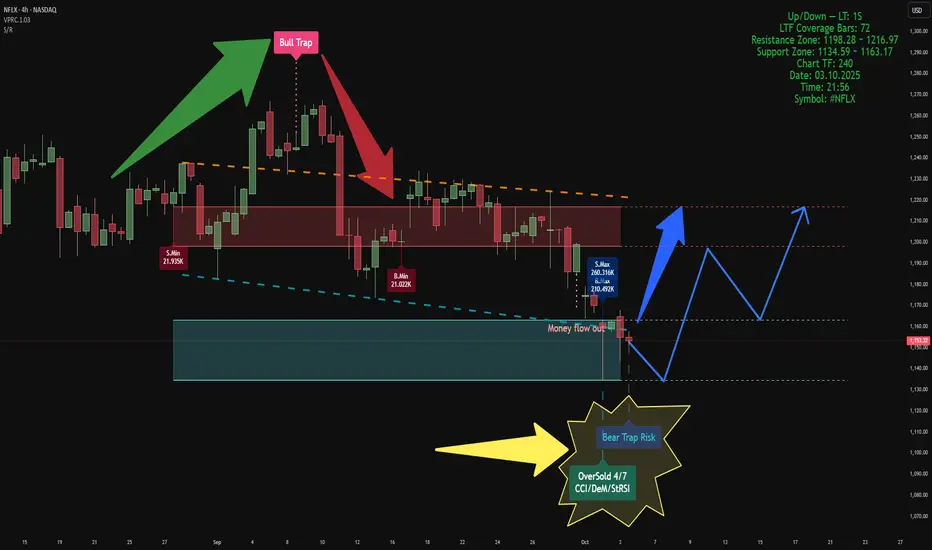
Volume-Based Market AnalysisUsing Indicators:
Smart Money Support/Resistance and ATAI Volume Analysis with Price Action V1.03
Analytical Configuration
This analysis combines two advanced indicators. The calculation period for both has been set to 52 bars, based on a lower timeframe of 1 second (1S), which provides 72 valid LTF candles. This configuration ensures that volume-based calculations remain within the valid data window for maximum accuracy.
Current Market Context
On the latest candle, a Bear Trap Risk signal appeared right after detecting an OverSold condition. This combination usually suggests weakening selling pressure near the end of a bearish leg and indicates the potential for buyer reaction. At that candle, both buy and sell volumes reached their highest values within the 52-bar window, but sellers maintained a slight advantage — approximately 260K sell volume versus 210K buy volume. This dominance by sellers in the OverSold zone reinforces the concept of volume exhaustion
Key Zones
• Support Zone: 1134 – 1163 USD
• Resistance Zone: 1198 – 1217 USD
Price is currently oscillating between these two zones. Based on the data, a short-term move toward the lower edge of the support zone is possible. If strong support holds, a rebound toward the upper boundary of resistance can be expected to retest or potentially break above it.
Structural Observation
In previous data, ATAI identified a Bull Trap at the resistance zone, which initiated the current bearish leg. Now, the emergence of a Bear Trap Risk near the support boundary is an intriguing reversal signal. If this trap functions similarly to the previous Bull Trap but in the opposite direction, we could expect a movement from the support base toward the resistance ceiling in the upcoming phase.
Summary
According to both indicators’ volume-based calculations, this is the most probable short-term scenario. However, this analysis is purely technical and volume-driven, and does not constitute any form of financial or investment advice.
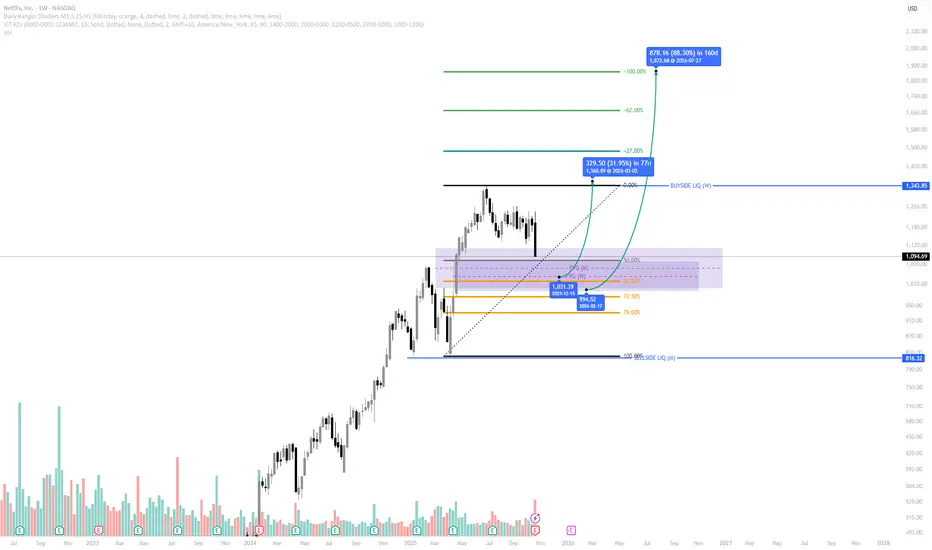
Netflix (NFLX) | FVG + OTE Entry Loading | Multi-Confluence ICT Netflix (NASDAQ: NFLX) is currently retracing into a high-probability multi-timeframe setup, aligning several ICT confluences that suggest a potential re-entry opportunity within a bullish continuation narrative.
Market Structure:
Price remains bullish overall, with clear higher highs (HH) and higher lows (HL). The recent decline represents a healthy retracement inside a developing higher-timeframe structure.
Fair Value Gap (FVG) Alignment:
The current pullback has driven price into an overlapping Monthly and Weekly FVG, an area of institutional interest where price has previously shown strong reactions.
This zone often serves as a re-accumulation region before expansion.
Optimal Trade Entry (OTE):
The FVG aligns directly within the 62%–79% Fibonacci retracement zone, known as the golden OTE zone.
This overlap of structural retracement and imbalance discount makes it a prime setup from a smart money perspective.
Liquidity & Target Zones:
- Discount Range: $944 – $1,033
- Primary Buyside Liquidity (BSL): $1,345
- Extended Target: $1,872 (100% expansion projection)
Each level aligns with liquidity pools and Fibonacci extension targets visible on higher timeframes.
Trade Bias:
Bullish, with focus on accumulation and confirmation within the OTE discount range.
A weekly bullish displacement or rejection candle within this zone would strengthen the case for long continuation plays.
Summary:
NFLX is presenting a multi-timeframe high-probability setup, where a clean retracement into an overlapping Monthly/Weekly FVG and OTE zone creates a strong case for re-entry.
If the discount zone holds, expect expansion toward buyside liquidity and potential continuation into 2026.
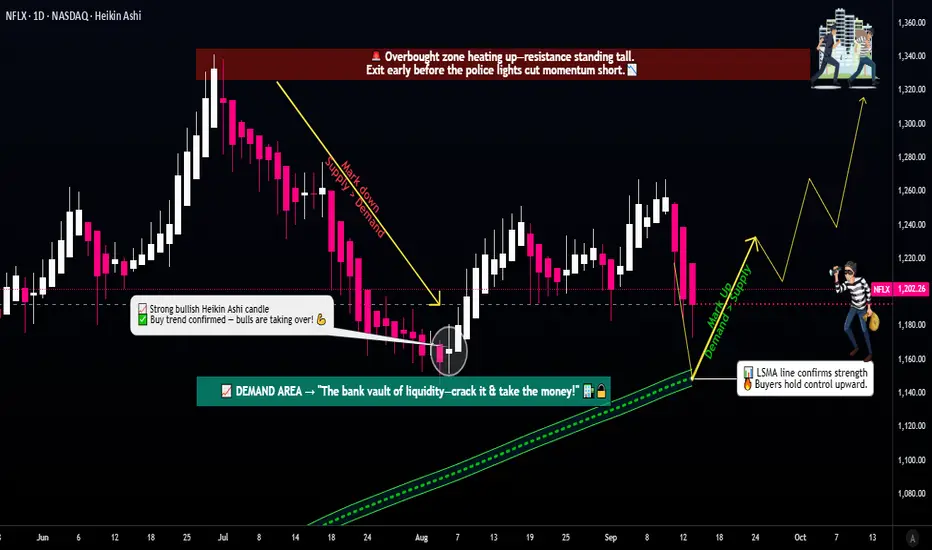
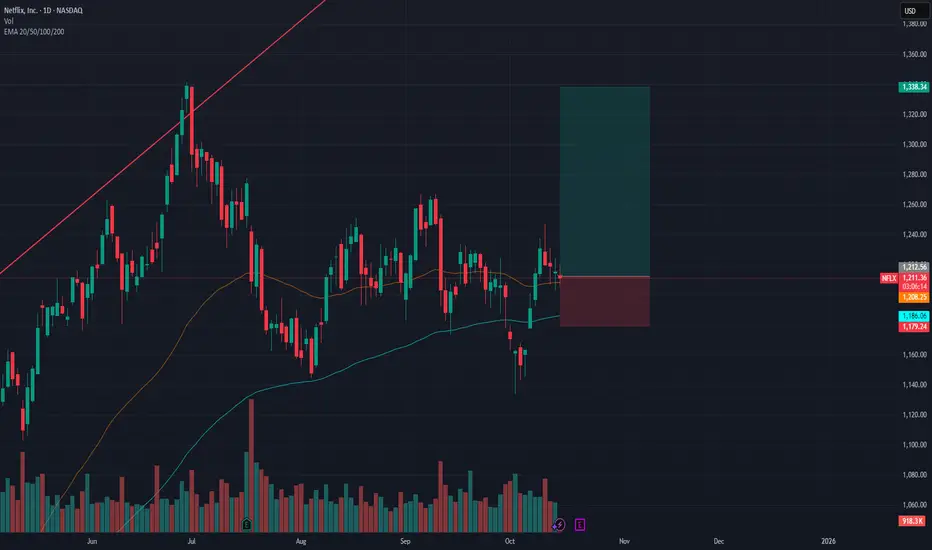
Popcorn Ready? Netflix Layering Setup for Bold Traders🎬 Netflix Stock | Thief Trader’s Profit Realization Blueprint 🍿💰
🧭 Market Outlook
Netflix (NFLX) is lining up for a bullish playbook — and here’s how the Thief Strategy goes down. This setup is purely educational and shares how I personally view price behavior with a layering approach.
🎯 Trading Plan (Swing/Day Trade Idea)
Entry (Layering Style 🥷): Instead of one-shot entries, the thief strategy is about multiple buy-limit layers. Example blueprint:
👉 1160 | 1170 | 1180 | 1190 | 1200 (more can be added if liquidity allows)
Stop Loss 🛡️: Thief-style SL ~1120 (after breakout levels are confirmed).
⚠️ Note to Thief OG’s: Manage your own SL & adapt risk. My level is an example, not a fixed call.
Target 🎯: Eyeing the 1340 zone, where resistance + overbought vibes + possible trap signals align. The thief rule? Escape before the crowd escapes 🚪💨.
⚠️ Again — not a fixed TP. Manage your own exits depending on profit goals & risk appetite.
🕵️♂️ Thief Trader Philosophy
This is not financial advice. It’s a “steal-and-escape” blueprint to show how layered entries can help smooth entries across zones instead of one rigid buy point. Adapt, manage, and steal profits like a pro before the market takes them back.
🔗 Related Assets to Watch
NASDAQ:AMZN — often shows correlation in big tech swings 📦
NASDAQ:AAPL — mega-cap sentiment driver 🍏
NASDAQ:MSFT — growth stock momentum check 💻
NASDAQ:QQQ — ETF to track Nasdaq 100 flow 📊
AMEX:SPY — broad market sentiment monitor 🏦
📌 Key Correlation Notes
Big tech stocks often move in sympathy — when Nasdaq pumps, Netflix usually gets extra popcorn 🍿 fuel.
Watch volatility spikes in TVC:VIX , as they can trap over-leveraged longs & shorts.
Macro cues (USD strength, yields, Fed talk) can shift momentum across all growth stocks.
✨ “If you find value in my analysis, a 👍 and 🚀 boost is much appreciated — it helps me share more setups with the community!”
#NFLX #Netflix #Stocks #SwingTrade #DayTrade #LayeringStrategy #Options #StockMarket #TradingView #ThiefTrader #Equities #QQQ #SPY #StockAnalysis
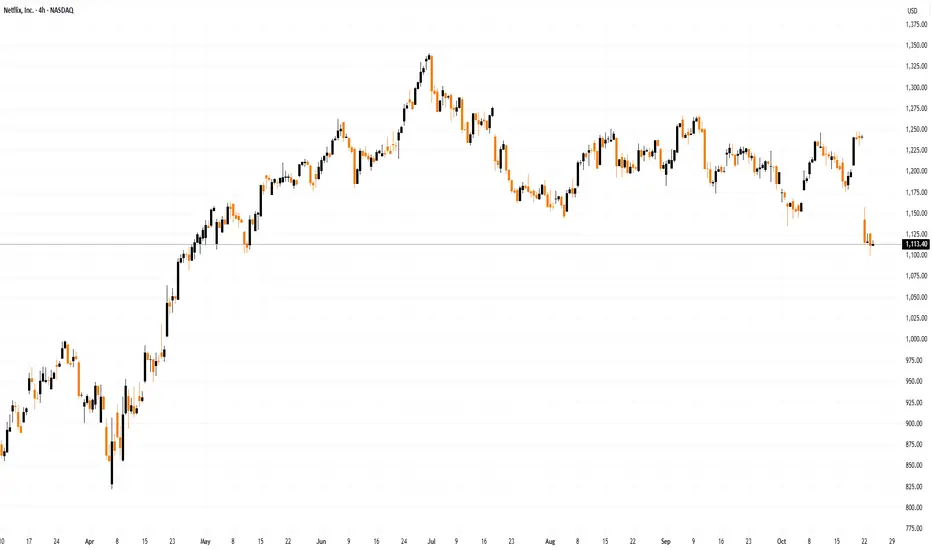
Netflix (NFLX) Shares See a Sharp DeclineNetflix (NFLX) Shares See a Sharp Decline
According to recent charts, Netflix (NFLX) shares have traded below $1,100 this week — for the first time since late May. The stock has fallen more than 17% from its July peak, while the S&P 500 index remains close to record highs.
Why Has Netflix (NFLX) Fallen?
The main catalyst for the drop was the company’s earnings report, which showed results well below expectations: actual EPS came in at $5.87 versus a forecast of $6.96 and a previous reading of $7.19.
Despite the success of several new releases, the figures were weighed down by a tax dispute in Brazil, which significantly dampened market sentiment. Nevertheless, the bulls still have reasons for cautious optimism.
Technical Analysis of the NFLX Chart
The NFLX share price remains within a long-term upward channel (marked in blue). It has now approached a key support zone formed by:
→ the lower boundary of the main channel, which previously provided support in April;
→ the lower line of a short-term downward trajectory (marked in red);
→ the psychological level of $1,100.
Bulls are taking encouragement from the fact that:
→ the RSI indicator has entered oversold territory;
→ the price previously moved confidently through the $1,000–$1,100 range, suggesting that strong buying interest may still persist in this area.
From the sellers’ perspective, however, attention should be paid to the large bearish gap formed earlier this week, with its lower edge near $1,100, which could now act as resistance.
Taking all this into account, it seems reasonable to assume that:
→ the current support zone may prevent further declines in NFLX shares;
→ the impact of the Brazilian tax case (reported losses of around $600 million) may already be priced in;
→ bulls could attempt to resume the broader uptrend, potentially turning the red trajectory into a bullish flag pattern.
On the other hand, failure to hold within the blue channel would expose the $1,000 level to another test.
This article represents the opinion of the Companies operating under the FXOpen brand only. It is not to be construed as an offer, solicitation, or recommendation with respect to products and services provided by the Companies operating under the FXOpen brand, nor is it to be considered financial advice.
Netflix: Key Support Zone in sightNetflix shares have continued to decline since our last update. We have now provided additional detail on the ongoing turquoise wave 4, which is subdivided into a magenta three-part structure. Within this structure, wave is expected to push price further down into the turquoise Target Zone, between $962.77 and $845.22. The low point of the larger wave 4 is anticipated within this range. Only after reaching this level should wave 5 drive price back above the $1,341 mark. As such, the turquoise Target Zone presents long entry opportunities, which can be protected with a stop set 1% below the lower boundary of the zone. However, if price rises directly above the aforementioned resistance at $1,341, our alternative scenario would be triggered, and we would initially need to prepare for a higher wave alt.3 top (probability: 30%).

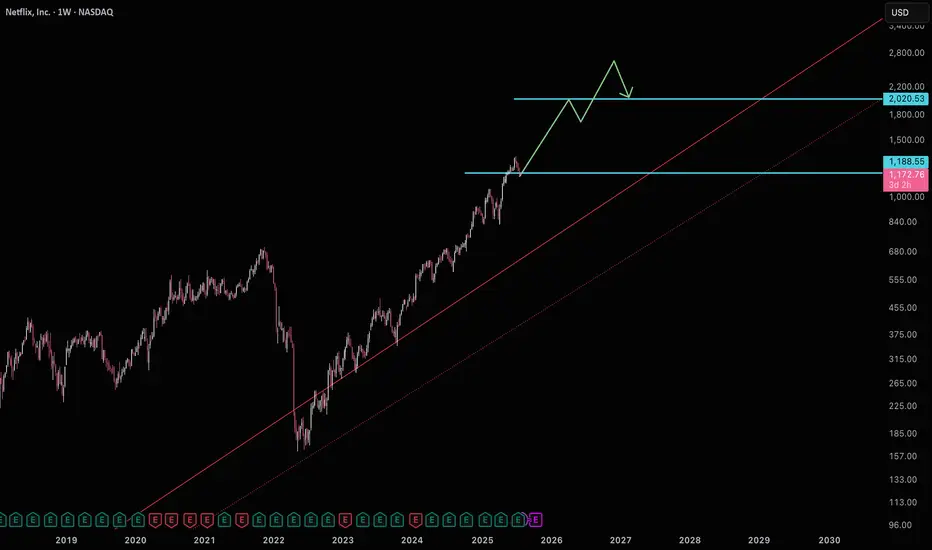
Netflix building support for $2000Netflix is currently sitting on support getting ready for a move to $2000.
Good luck!
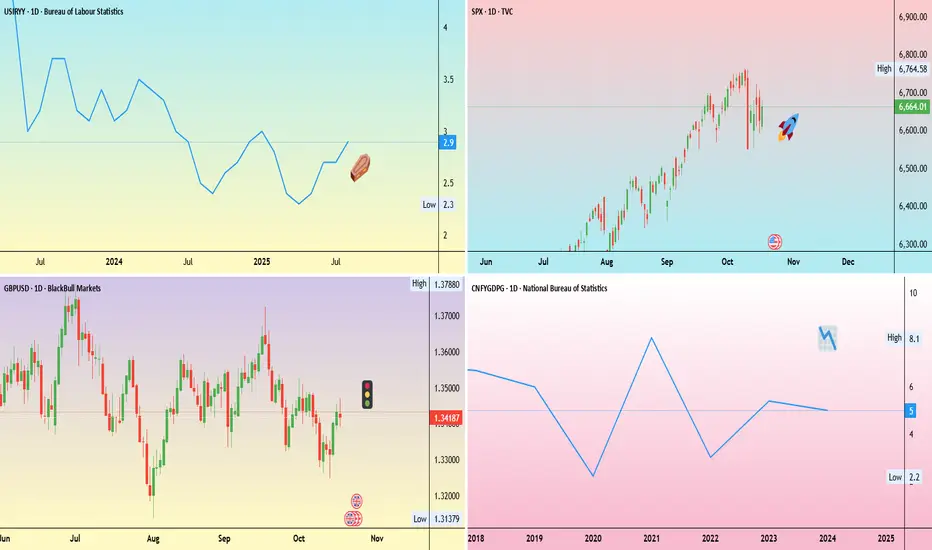
Weekly Trading Opportunities | October 21–25 • Monday: China GDP data
China’s third-quarter GDP report will be closely watched as growth is expected to slow to 4.8% year-on-year from 5.2% in Q2.
Slowing growth in China could reduce demand and prices for commodities. A surprise upside could support commodity prices.
• Tuesday: Coca-Cola and Netflix earnings.
Earnings season continues with Coca-Cola, Netflix, and others including Tesla, IBM, and Intel.
Strong results could offset soft U.S. data and help reignite the risk-on environment.
• Wednesday: U.K. inflation data and Tesla earnings
U.K. inflation is expected to edge back toward 4%. A softer reading could boost U.K. equities and pressure the pound.
• Thursday: Intel earnings
• Friday: U.S. CPI report
With the U.S. government shutdown entering its fourth week, the CPI release remains the week’s key data point. A hotter print could lift the dollar.
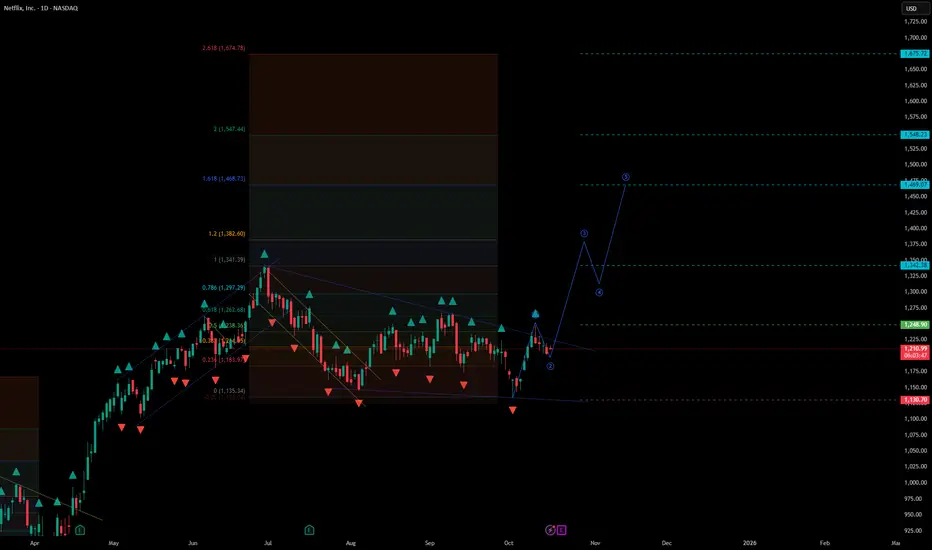
Netflix – Trend Reversal and Impulsive Setup#Netflix – Trend Reversal and Impulsive Setup
Current price: $1,215.6
Netflix is showing early signs of a trend reversal after completing a multi-month corrective phase. The structure suggests a shift toward a new impulsive rally within the broader bullish framework.
🧩 Technical Overview
• After a prolonged pullback from the June highs, price found support near $1,130, forming a local base.
• The descending channel was broken to the upside — a signal of potential momentum change.
• Price is now consolidating above the breakout zone, building the foundation for an upward impulse.
📈 Scenario
• The structure resembles the start of a new impulsive leg following the correction.
• As long as the market holds above $1,130, bullish continuation remains the dominant view.
• Stop-loss: below the recent swing low at $1,130.
• Upside targets:
– $1,250–$1,270 – short-term retest of breakout zone
– $1,340–$1,380 – key resistance and mid-cycle confirmation zone
– $1,470–$1,550 – major Fibonacci target range
– $1,670+ – extended bullish objective if momentum accelerates
⚙️ Market Context
• The broader trend remains constructive as long as price stays above the breakout structure.
• Momentum shift coincides with improving sentiment across large-cap techs.
• A sustained move above $1,340 would confirm renewed strength and open the path toward the $1,500 area.
🧭 Summary
Netflix has likely completed its corrective phase and is preparing for a new upside cycle.
Holding above $1,130 keeps the bullish bias intact, while a breakout above $1,340–$1,380 would confirm trend continuation toward $1,470–$1,550 and beyond.
NETFLIX PERFECT LONGNASDAQ:NFLX On the daily TF has committed a large sweep of liquidity, then has broken the previous swing high and is now consolidating bullishly towards the daily 50ema, where I am looking for a reaction to the upside. At the lowest there could be a spike down to the 50fib on a fast retracement, so SL below. But rejection of 4hr 50ema and 100ema is telling that the move is ready to happen and likely not to retrace back down much further. I am targeting the previous long term highs as a tp.
I feel confident in this entry, the price action is clean. Bollinger band volatility confluence is missing which is my only hesitation, however with the price action being as strong as it is, I am more than willing to make the entry.
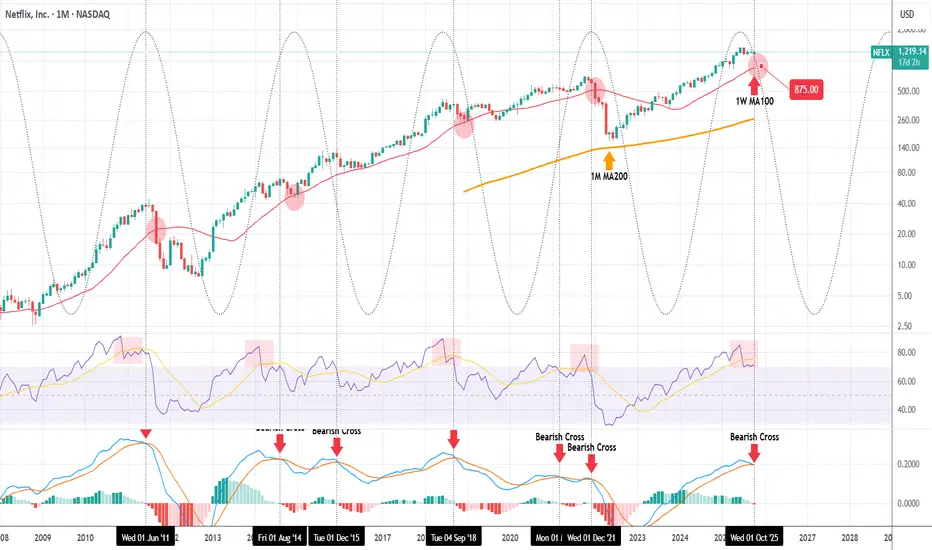
NETFLIX has topped and can pull back to $875.Netflix (NFLX) has formed one of its strongest Sell Signals in the last 15 years. That's the 1M MACD Bearish Cross.
The stock has been trading on a very consistent pattern ever since the 2008 U.S. Housing Crisis and during this multi-year span, the best indicator for a Top has been the 1M MACD forming a Bearish Cross.
As you can see, this month marks the 7th such occurrence since June 2011. All previous formations resulted in the price pulling-back to touch at least its 1W MA100 (red trend-line). Only two times the correction has been bigger that was that first Bearish Cross in June 2011 and the most recent December 2021, which almost hit the 1M MA200 (orange trend-line), the market's ultimate multi-decade Support.
These Top signals match fairly well the Sine Waves, which as you see form somewhat reliable Cycles. Those confirm that Netflix currently stands on a long-term Top. Even the 1M RSI is similar to the Top patterns suggested by the Sine Waves.
As a result, we expect the stock to start a multi-month technical pull-back, with a fair projection of making contact with its 1W MA100 being $875.00. That's our Target.
-------------------------------------------------------------------------------
** Please LIKE 👍, FOLLOW ✅, SHARE 🙌 and COMMENT ✍ if you enjoy this idea! Also share your ideas and charts in the comments section below! This is best way to keep it relevant, support us, keep the content here free and allow the idea to reach as many people as possible. **
-------------------------------------------------------------------------------
💸💸💸💸💸💸
👇 👇 👇 👇 👇 👇
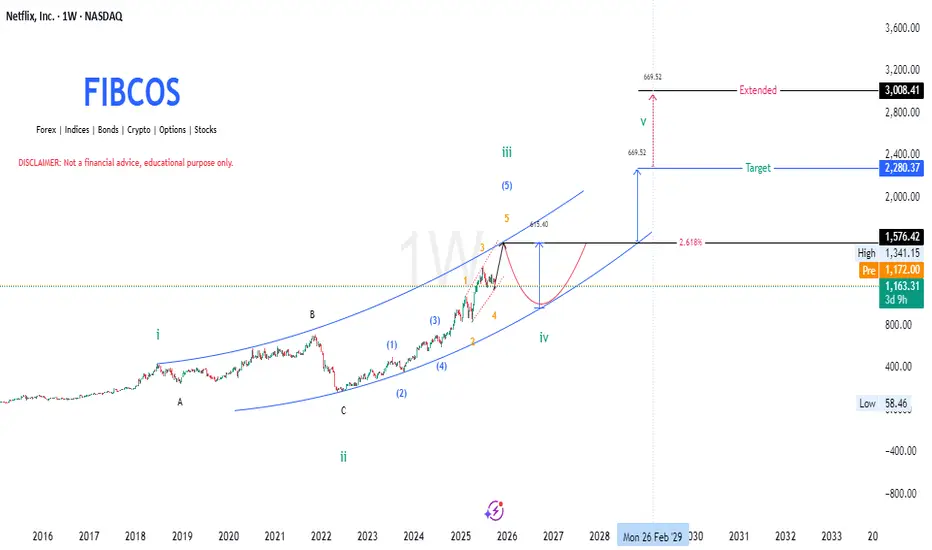
Netflix (NFLX) - Descriptive Analysis by FIBCOS📘 NFLX 2009–2029 Descriptive Analysis
This is a detailed Elliott Wave Theory -based outlook for Netflix (NFLX) stock from around 2009 to the projected future of 2029, and it incorporates Fibonacci retracement & extensions, Smart Money Concepts (SMC) , and Price Action structure within a channel.
Let’s break this down chronologically and structurally:
🌀 Wave Theory Confluence (Elliott Wave Structure)
The long-term structure of Netflix (NFLX) from 2009 to the projected 2029 period follows a classic Elliott Wave cycle, now realigned with the cycle top in mid-2018 and the macro correction ending in mid-2022.
1. Cycle Wave i (2009–2018):
NFLX entered a powerful multi-year rally, forming five sub-waves within this first major impulse. This long rally ended in mid-2018 , marking the top of Cycle Wave i .
2. Cycle Wave ii – ABC Correction (2018–2022):
From the 2018 top, the price entered a prolonged and complex 4-year correction, unfolding as a classic A-B-C corrective structure.
Wave A began the decline with a sharp markdown.
Wave B was a fake recovery, leading to Wave C, a deeper liquidation into mid-2022 , completing the correction.
This phase aligns with a major redistribution cycle where smart money exited positions, and retail investors were caught in hope rallies.
3. Cycle Wave iii (2022–2025):
After finding a bottom in mid-2022, the stock launched a new impulsive rally , forming five sub-waves (1–5) of a powerful Wave iii
Momentum accelerated in wave 3 of iii (typical in Elliott Wave), and the structure is now peaking as of late 2025, around $1,576.42.
This marks the expected completion of Wave iii, with signals pointing toward a correction.
4. Cycle Wave iv (Expected 2025–2027):
A corrective wave iv is expected to unfold, possibly returning toward the lower bound of the long-term ascending channel.
According to the principle of alternation , since wave ii was deep and complex, wave iv may be shallower or more sideways.
5. Cycle Wave v (Expected 2027–2029):
After the wave iv correction, a final impulsive leg — Wave v — is expected to push the price higher, targeting around $2,280.37 , with a potential extended move to $3,008.41 .
This will complete the macro 5-wave cycle that began in 2009.
📐 Fibonacci Confluence
The Fibonacci structure supports these wave formations:
The 2.618 extension of the previous impulse wave (measured from the 2022 bottom) projects a price target near $2,280.37 , aligning with historical extension zones.
The extended target at $3,008.41 aligns with the upper boundary of the long-term channel — often reached during euphoric final waves.
Prior retracements during wave ii and the anticipated retracement in wave iv fall into common Fibonacci pullback zones (0.382–0.618).
Fibonacci tools confirm that price has behaved symmetrically within the wave cycles, and provide high-probability zones for both correction and expansion.
🧠 Smart Money Concept (SMC)
From a Smart Money perspective, the chart reflects a complete institutional cycle:
Distribution Zone (2017–2018):
Smart money exited during the late stages of Cycle Wave i. This aligns with the cycle top in mid-2018 , often accompanied by overvaluation and high optimism.
Re-Accumulation Phase (2018–2022):
The 4-year correction allowed institutional players to accumulate at discounted prices during wave C. Retail was largely shaken out, and liquidity was swept multiple times.
Expansion Phase (2022–2025):
From the 2022 bottom, price moved sharply upward in a clean impulse (Wave iii), confirming institutional interest. Gaps, strong breakouts, and efficient trends reflected low-resistance expansion driven by smart money.
Future Distribution (2029?):
Around the projected $2,280–$3,008 range (Wave v), expect distribution signs —including deviation from trend, order block mitigation, and liquidity grabs. These are typical before a larger market reset.
Smart Money Concepts help explain the why behind each wave: fear and euphoria don’t happen randomly — they are often orchestrated phases of value transfer.
📊 Price Action Structure
The long-term price action of NFLX reinforces the wave count and market psychology:
2009–2018 (Wave i):
Price action showed a steady trend of higher highs and higher lows , with smooth breakouts and momentum-driven runs.
2018–2022 (Wave ii correction):
A breakdown in structure occurred. Lower highs and a wide, overlapping correction defined this multi-year distribution. Key support levels were breached and retested as resistance — a classic bearish shift in structure.
2022–2025 (Wave iii):
Clean, impulsive movement resumed. Breakouts, bullish flags, and retests marked key continuation zones. Market structure flipped back bullish with efficient rallies.
2025–2027 (Wave iv expected):
A retracement is likely toward previous demand zones , possibly aligning with wave 4 of the lower-degree impulse, respecting Elliott’s guideline of wave 4 often retracing to the territory of wave 4 of the previous degree.
2027–2029 (Wave v projection):
Anticipate price pushing into new highs, with potential overextension . However, bearish divergence and slowing momentum could foreshadow the macro top.
This structure shows how technical behavior mirrors emotional and fundamental phases — from greed to fear, and back again.
📆 Timeline Summary (2009–2029)
2009–2018:
Powerful multi-year impulse forms Cycle Wave i , ending in mid-2018.
2018–2022:
A deep, multi-legged ABC correction forms Cycle Wave ii , ending in mid-2022.
2022–2025:
Explosive impulsive rally forms Cycle Wave iii , currently completing around $1,576.42.
2025–2027 (Expected):
A corrective pullback forms Cycle Wave iv , likely more sideways or shallow in structure.
2027–2029 (Expected):
Final rally completes Cycle Wave v , with price targets between $2,280.37 and $3,008.41 , ending the macro Elliott structure.
🔚 Conclusion
With the cycle top revised to mid-2018 and the correction ending mid-2022 , the chart structure becomes even more aligned with classic Elliott Wave theory and Smart Money behavior.
Netflix’s long-term chart is a perfect confluence of:
Elliott Wave structure (impulse → correction → impulse),
Fibonacci precision,
Institutional manipulation (SMC), and
Clear price action behavior.
The roadmap to 2029 shows exciting bullish potential, but also highlights the need for caution near projected macro top zones — where institutional distribution may quietly unfold again.
📘 DISCLAIMER: This is a structural, educational market outlook. Not financial advice. Please do your own due diligence and risk management.
#Netflix, #NFLX, #Nasdaq #WaveTheory, #Fibonacci, #SmartMoney, #PriceAction
Falling Wedge on NFLX: Set for a Break?Price on NASDAQ:NFLX has been consolidating inside a falling wedge, with each swing showing weaker momentum from sellers. And buyers are slowly stepping back in.
A strong breakout above the upper trendline would confirm bullish strength and signal a potential continuation toward the 1,400.00 level.
Until then, patience is key, waiting for a clear break with volume can help avoid false signals.

Is Netflix Stock Headed Toward $1,100?Netflix shares are going through a difficult period, as the streaming giant has posted five consecutive losing sessions, with a decline of around 4.5% in recent trading days. For now, the selling bias has become dominant, driven by the viral "Cancel Netflix" campaign circulating on social media, where many users have decided to cancel their subscriptions following a recent controversy involving the company. As long as this negative sentiment fueled by the campaign remains in place, selling pressure is likely to continue playing a key role in the stock’s short-term movements.
Bearish Trend Emerges
Since early July, a series of lower highs has formed, establishing a solid downward trendline. In addition, price oscillations below the 100-period moving average reinforce the outlook for a consistent bearish bias. Unless a significant bullish correction occurs in the near term, selling pressure could continue to dominate, allowing the bearish trend to become more pronounced in the coming sessions.
RSI
The RSI line continues to show downward oscillations below the neutral 50 level, confirming that bearish momentum remains dominant over the past 14 trading sessions. However, the indicator is approaching the oversold zone, marked by the 30 level, and reaching this area could signal a market imbalance, potentially opening a window for short-term corrective rebounds.
MACD
The MACD histogram continues to display negative oscillations below the zero line, indicating that bearish directional strength remains dominant in the short-term moving averages. As the histogram continues to post lower values, selling pressure is expected to remain a key factor in the coming sessions.
Key Levels to Watch:
1,221 – Major Resistance: Corresponds to the area marked by the 100-period simple moving average. Price action breaking above this level could trigger a relevant bullish bias, putting the current downtrend at risk.
1,155 – Nearby Support: Represents the area of the latest price pullbacks. If price breaks below this level, the bearish trend could extend further in the short term, leading to sustained selling pressure. It may also act as a technical barrier capable of producing temporary bullish corrections.
1,097 – Critical Support: Corresponds to the zone marked by the 200-period simple moving average. A sustained break below this level could activate a more aggressive downtrend, likely defining the stock’s movements over the next few weeks.
Written by Julian Pineda, CFA – Market Analyst
