Gold (XAU/USD) — pre-FOMC technical + fundamental setupOn the 15-min chart we see repeated rejections off the same resistance zone horizontal supply + a down sloping trendline. Each attempt has failed so far. That suggests bearish bias in the short-term.
The current structure supports a potential drop toward ~ 4160 (support zone), assuming gold remains under the resistance trendline.
~ Key wildcard: tonight’s FOMC decision. Markets are pricing in a 25 bps rate cut with high probability. If the Fed cuts and delivers dovish guidance, gold could rally possibly invalidating the bearish setup.
✅ But if the Fed cuts while signalling a cautious stance or a pause in easing, the dollar/yields could bounce reinforcing gold’s bearish technical structure and likely triggering the projected move down toward ~ 4160.
PLAN A (base case): Stay short under resistance, target ~ 4160.
PLAN B (if FOMC surprises dovish): Watch for break above trendline on breakout, avoid new shorts; consider potential longs if follow-through appears (momentum + candle confirmation).
Fundamental lens: Gold is inherently sensitive to real interest rates and Fed policy. Dovish Fed = bullish for non-yielding safe-havens like gold; hawkish/dovishmpause tone = bearish or consolidative. Given mixed US data and sticky risk sentiment, the post-FOMC reaction could be swift and volatile.
consider waiting for the post-announcement move rather than pre-loading a large position. Use tight risk control (stop-loss above resistance if short; if buying after a break, wait for retest + confirmation).
Newstrading

Gold Forex Trading During Major Economic Events & News Releases
I guess you already noticed how impulsively the markets may react to economic events and news.
In this article, I will teach you a simple strategy to follow during important news release s and how to trade news.
1. Sort out the economic calendar
There are a lot of news in the economic calendar.
They are not equal in their impact.
Most of the economic calendars indicate the potential significance of each event: while some news have low importance, some have medium importance and some are considered to be extremely important.
For example, above is the list of coming UK fundamental news.
You can see that these news have different degree of importance.
My recommendation to you is to sort out the economic calendar in a way, so it would display only the most important news.
Among the news that we discussed above, only one release has high importance.
2. Know on what trading instruments does the news have an effect
While some of the news in the economic calendar may impact many financial markets and trading instruments, some news may affect very particular instruments.
For example, a FED Interest Rate decision may have a very broad effect on financial markets.
At the same time, Interest Rate Decision in Australia may affect only Australia - related instruments.
3. Don't trade one hour before the news and one hour after the release
Once you see the important fundamental news coming, don't trade the trading instruments that can be affected by the new s 1 hour before and after the release.
For example, in 5 minutes we are expecting important UK news - CPI data.
I stopped trading GBP pairs 1 hour before the release of the news, and will resume trading them one hour after the release.
4. Protect your trading positions 5 minutes ahead of the news
If you have an active trading position and related important news are expected, move your stop loss to entry 5 minutes ahead of the release of the news.
For example, I have a short trade on GBPAUD. I see that in 5 minutes important UK data is coming. I will move stop loss to entry 5 minutes ahead of the news and make a position risk-free.
I always say to my students, that news trading is very complicated. Due to a high volatility, it is very hard to make wise decision during the news releases.
The approach that I suggest will help you to avoid all that and trade the markets when they are calm.
❤️Please, support my work with like, thank you!❤️
I am part of Trade Nation's Influencer program and receive a monthly fee for using their TradingView charts in my analysis.

EURUSD remains unchangedThe market is calm ahead of key U.S. news.
A retest of previous lows is possible before the next move.
Expectations still point to a continuation of the uptrend, but traders should stay cautious about volume and risk ahead of Friday’s data.

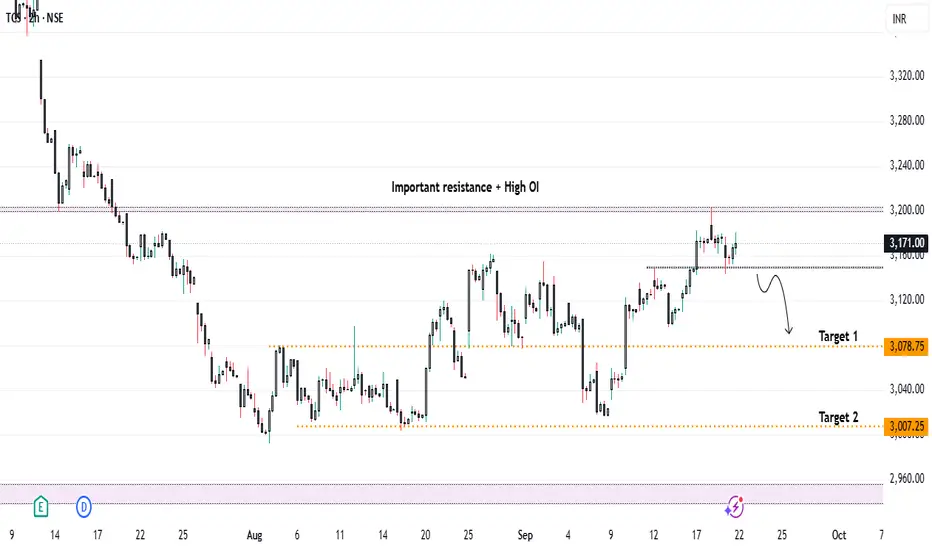
TCS Under Pressure – Will Visa Heat Trigger ₹3000 Levels..?Currently, TCS is trading near the crucial resistance zone of ₹3200, which also carries high open interest. From a technical perspective, if the stock breaks and closes below the short-term support of ₹3150, we can look for a short entry on retest, with targets:
* 🎯 Target 1: ₹3080
* 🎯 Target 2: ₹3000
📰 Fundamental / News Catalyst
The recent US H-1B visa policy update imposing a $100,000 fee on new petitions triggered a knee-jerk reaction in IT stocks:
* U.S.-listed Indian IT firms saw an immediate 2-5% decline.
* Analysts expect the impact on TCS to be limited, since a large part of its U.S. workforce is locally hired and renewals/existing visas are exempt.
* Worst-case estimates suggest a 3-5% downside in the short term, but not a structural collapse for large, diversified players like TCS.
📊 Impact Outlook on TCS
Short Term (days–weeks):
* Investor sentiment may turn negative, causing selling pressure.
* Margin compression possible due to new visa costs.
* Analysts could revise earnings growth expectations lower.
* Offsetting factors: Renewals exempt, TCS has a solid U.S. local workforce, and offshore flexibility.
Medium Term (months):
* New contracts may factor in higher costs.
* Shift to offshore delivery could reduce higher-margin onsite revenues.
* More local U.S. hiring may raise costs.
* Offsetting factors: TCS’s scale allows cost absorption; some costs may be passed to clients.
Long Term (year+):
* Delivery model may shift further to offshore/local U.S. hiring.
* Competitive pressure if peers adapt faster in the U.S. market.
* Margins could be under pressure.
*Offsetting factors: Strong global brand, diversified business, investments in AI & automation can offset long-term risks.
🔎 Scenarios for Share Price
* Mild Reaction: 3-5% decline → cautious investors, limited disruption.
* Moderate Reaction: 8-12% decline → project delays, client pushback, stricter visa rules.
* Severe Reaction: 15-20%+ decline → contract losses, earnings downgrades, tighter U.S. policy.
✅ Conclusion
* 📌 Technicals: Watch ₹3150 for breakdown confirmation; short entries possible below this with ₹3080 / ₹3000 as downside targets.
* 📌 Fundamentals: News-driven weakness is likely, but structural risk to TCS remains limited vs smaller IT peers.
* 📌 Strategy: Short-term bearish setup aligns with both technical chart structure and negative sentiment from visa policy changes.
📌 Sentiment: Bearish (Short Term)
XAUUSD – Should You Trade the Red News… or Let Them Trade You?🌟The Hype vs. Reality
Every NFP Friday, you’ll see traders flexing $500 to $5,000+ in one candle. But the reality check is that 95% of accounts are blown by spreads, slippage, and whipsaws. News looks like payday, but for the market, it is traps set both ways for retail traders.
Why Gold + Red USD News Is a Dangerous Mix
XAUUSD reacts harder with momentum than any other Forex pair.
NFP, CPI, FOMC, PCE — every release creates engineered chaos.
Typical pattern: spike one way → sweep stops the other way → only then trend resumes.
Example: NFP prints strong, Gold dumps 100+ pips, sweeps liquidity, then rips 350+ pips bullish with the higher-timeframe trend.
🔴When You Shouldn’t Touch It (Beginners)
If you’re still learning structure, stay flat. Here’s why:
• Spreads jump 10–30 pips instantly.
• SLs get slipped or completely ignored.
• First candle is pure manipulation.
• Emotions peak → revenge trades blow the account.
• Best move: study the reaction and wait for a safe entry, repeat 100+ times X more.
🟢When You Can Consider It (Intermediate Traders)
For traders with experience 1year+ on the charts:
• Before the release: position based on HTF bias, with very small risk.
• After the release: wait for the spike to finish, then take structure-backed entries.
Example: CPI prints weak, Gold jumps → once the fakeout clears and structure reclaims, you trade the continuation.
🖊️The Truth Nobody Likes to Hear
News doesn’t set the trend; instead, it likes to accelerate the story the chart was already telling.
If you can’t trade Gold without news, why would you dream of lying to yourself that an Unemployment Claims would make you instantly rich?
Final Note:
Trading XAUUSD over Red folder news is not proving catching the spikes. You need to show by sitting put, waiting for the dust to settle, that you trade with structure.
Beginners should grab some popcorn, watch it, and study for a while.
Intermediate traders can use news as fuel.
But if you dive in blind, remember XAUUSD doesn’t care about your trade; most likely, it will feed on it while you are volunteering as liquidity.
If this article helped you today and brought you more clarity:
Drop a 🚀 and follow us✅ for more trading ideas and trading psychology. Thank you.

USDCAD potentail longs due to weaker than expected CAD CPI y/y The Canadian Consumer Price Index (CPI) for July 2025 showed a year-over-year (YoY) increase of 1.7%, down from 1.9% in June 2025 and below the forecast of 1.8%. The decline in headline inflation was largely due to falling gasoline prices, though food and shelter costs continued to push inflation higher.
Due to the weaker-than-expected economic data, we expect the CAD to weaken against the USD.

5 Lessons from My First 100 TradesAfter executing and reviewing over 100 real trades in crypto, forex, and gold — I found patterns. Bad patterns. Repeating mistakes. And lessons I wish someone had told me earlier.
So I broke them down into 5 key insights that changed how I trade — and might just save you thousands.
📘 Here’s what’s inside:
1️⃣ Smart Profit-Taking:
How I turned 10 R/R into 32 R/R using a dynamic exit plan.
📘Further resource:
Cycle Mastery (HWC/MWC/LWC)
---
Multi-Timeframe Mastery
2️⃣ The Sleep Edge:
70% of my losing trades happened after bad sleep. Here’s why that matters more than emotions.
3️⃣ No More Blind Stop Orders:
Why I stopped using buy/sell stops without real candle confirmation — and what I do instead.
📘 Further reading:
Breakout Trading Mastery
---
Indecision Candle Strategy
4️⃣ Multi-Layered Setups Win:
How structure, S/R, patterns, and timing stack into high-probability entries.
5️⃣ News Trading? Just Don’t.
The data behind why most of my SLs were hit near news time — and how I avoid the trap.
💡 These aren’t theories. These are real lessons from real trades.
If this video helped you or sparked an “aha” moment, give it a boost, commenting your takeaway, and sharing it with a fellow trader.
lets grow together :)

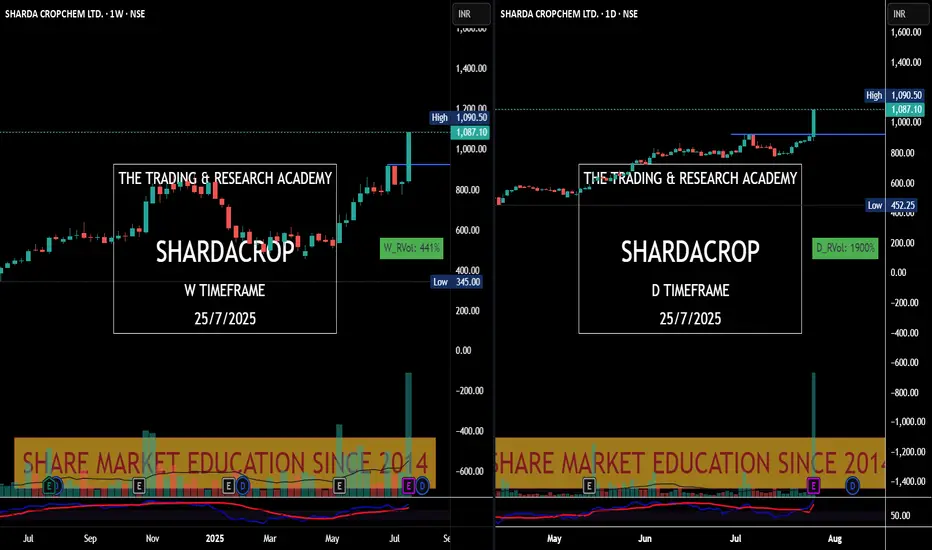
Charts Speak #Sharada Cropchem
Sharada Cropchem
Charts always lead the News! This is yet another example where price was leading & News came later.
Stock was under accumulation since June with higher qty. In fact since May 25, it was getting bought in average 2-3M qty weekly. What a planned buying..
28th May, 4 June, 18th July were nice buying alarms for us. Today it was just a final nail in the coffin.
$GOOGL Breakdown – AI Risk Is No Longer "Future Tense"🚨 BREAKING: NASDAQ:AAPL confirms they are exploring AI-powered search within Safari after a decline in browser searches for the first time ever.
💥 NASDAQ:GOOGL is down over 8% intraday, cracking long-term trendline support and decisively below the 200DMA ($173).
📉 The setup is ugly:
Insiders sold post-earnings (again).
Trendline + moving average both lost.
Volume spike and vertical price action = capitulation risk ahead.
🔻 Downside momentum could accelerate if price fails to reclaim $155 quickly.

Possible H&S Forming – It’s All About the News NowOANDA:XAUUSD
📉 Watching closely: Possible Head and Shoulders formation developing on the 4H and 1H charts
As of April 24, 2025, Gold (XAU/USD) is forming a potential Head and Shoulders pattern on the shorter timeframes (4H and 1H), which could indicate a reversal setup. While multiple scenarios are still in play, the price action around the $3368 level will be crucial.
If price fails to break above this resistance in the near term, it could suggest weak bullish momentum and open the door for a pullback toward and possibly below the neckline around $3250 .
🔔 Key Economic Events – April 24
08:30 EDT – Durable Goods Orders MoM
Forecast: +2.0%
Personal outlook: Numbers might come in weaker than forecasted.
Durable goods orders are a solid gauge of industrial demand. Weaker-than-expected numbers would likely weaken the USD and could offer some upside pressure on Gold.
10:00 EDT – Existing Home Sales
Forecast: Lower than previous.
As a key barometer of consumer confidence and economic stability, lower-than-expected figures could also put pressure on the USD, potentially providing Gold a short-term bullish impulse.
📊 Potential Scenarios
Scenario 1 – Bullish Breakout
Weak economic data → USD weakens → Gold spikes above $3400
If both data points disappoint, we could see a rally in Gold, possibly breaking the resistance and invalidating the H&S pattern.
Scenario 2 – Bearish Breakdown (Preferred H&S Scenario)
Strong data → USD strengthens → Gold falls below $3200
While less likely, if economic data comes in stronger than forecasted, Gold could see a significant drop, forming the right shoulder and breaking the neckline – confirming the Head & Shoulders reversal.
Scenario 3 – Sideways Movement
Neutral data + Tariff talks in focus
In the absence of impactful data or if figures come in as expected, Gold might consolidate sideways. Ongoing developments around US-China tariff negotiations could dominate sentiment, delaying or nullifying the H&S pattern entirely.
📉 Market Sentiment Snapshot
US stocks are rallying on optimism around tariff reductions
Trump administration signaling potential easing of China tariffs
➡️ Gold under pressure as risk-on sentiment rises
📍 Conclusion
Keep an eye on the $3368 level and $3250 neckline. Short-term moves will likely be dictated by today’s economic releases and the evolving trade narrative. A confirmed break below the neckline would validate the bearish H&S scenario with potential downside toward $3200 and below.
👉 Stay nimble and trade the reaction, not just the forecast.
-------------------------------------------------------------------------
This is just my personal market idea and not financial advice! 📢 Trading gold and other financial instruments carries risks – only invest what you can afford to lose. Always do your own analysis, use solid risk management, and trade responsibly.
Good luck and safe trading! 🚀📊

XAUUSD NFPGold price remains depressed above $2,900, US NFP awaited
Gold price edges lower on Friday amid some repositioning ahead of the crucial US NFP release. Rising trade tensions, the risk-off mood, and a weaker USD lend support to the precious metal. Bets for more interest rate cuts by the Fed contribute to limiting losses for the XAU/USD pair.
Signals update shortly

EURUSD - Analysis and Potential Setups (Intraday- 12.02.25)Overall Trend & Context:
The pair is in an overall downtrend on the higher time frames and we are now waiting for the lower time frames to shift in accordance with the narrative.
Technical Findings:
Price is at a daily level of supply (as well as refined zones down to the 15m & 5m)
LTF oversold conditions.
We could still see further upward movement so will wait for either a break at 1.03650 or for our OANDA:GBPUSD trade to run into profits (or both).
Potential Scenarios:
For now I will only be considering shorts.
Risk accordingly and be safe for CPI today.

US500 Trade insight Price breaks above December high 6102.21 so I believe we are currently on a retracement to 5901.87 for continuing to the upside.
If the ISM manufacturing PMI news happening at 10:00 UTC-5 NY push proce to my POI then I'll stick to my buy bias but if it pushes price to the upside without getting to my point of interest then I might look for a short sell from 6024.40 down to my Poi for buy.
If you find this insightful, 🫴 kindly boost and share

GBP/USD - H1 Chart - Triangle Breakout (31.01.2025)The GBP/USD Pair on the M30 timeframe presents a Potential Selling Opportunity due to a recent Formation of a Triangle Breakout Pattern. This suggests a shift in momentum towards the downside in the coming hours.
Possible Short Trade:
Entry: Consider Entering A Short Position around Trendline Of The Pattern.
Target Levels:
1st Support – 1.2342
2nd Support – 1.2295
🎁 Please hit the like button and
🎁 Leave a comment to support for My Post !
Your likes and comments are incredibly motivating and will encourage me to share more analysis with you.
Best Regards, KABHI_TA_TRADING
Thank you.

CADJPY: SHORT! BOC ON TAP!As expected, the Bank of Canada rate decision cuts rates by 25 basis points. As a result, we expect the Canadian dollar to weaken against the Japanese yen since we didn't get any surprises from the BOC.

AUDJPY LONG: BOJ ON TAPThe BOJ is expected to cut Japan's interest rate buy 0.50% or 50 basis points, which could see JPY weaken hence we are opting for a buy/long AUDJPY Trade. If they hold rates unexpectedly, we still plan to go buy/ long AUDJPY.

Airtel Vs (TTML, MTNL, IDEA) - Pre-Rally Vs Post-RallyHere’s an assertive revision of your content:
---
**Why Airtel Dragged While TTML, MTNL, and IDEA Blasted?**
The government’s consideration of waiving 50% interest and 100% penalties on AGR dues created a buzz, and certain "gurus" began hyping a potential rally in **Bharti Airtel**, a fundamentally strong telecom stock compared to **TTML**, **MTNL**, and **Vodafone Idea**.
**But the market did the exact opposite.**
TTML (+16.5%), MTNL (+10.5%), and IDEA (+9.11%) soared, while Airtel struggled below 1%. The question is **why?**
**The Answer: The Importance of Technical Structures, Supports, and Resistances.**
Market participants often assume that fundamentals drive prices. This is the **biggest myth.** Fundamentals (valuations, PE ratios, book value, order books, quarterly results) can create momentum but never dictate its **direction.** Supports and resistances are the **primary drivers** of price movement. Relying solely on fundamentals is like pressing the accelerator while trying to reverse park—damages are inevitable.
Now, let’s review the technical factors behind the explosive moves in TTML, MTNL, and IDEA compared to Airtel’s stagnation.
---
### **TTML**
On the **monthly chart**, TTML formed a **bullish flag pattern**, breaking out in **July 2024**. However, the lack of momentum in the telecom sector kept it range-bound until now.
**Key Points:**
1. A **77% correction** from its all-time high (ATH) formed the flag.
2. Sideways consolidation since March 2024 created a **strong base**.
3. This base aligned with the **Fib 0.618 retracement** from the previous high.
TTML was primed for a move. The AGR news provided the necessary trigger, leading to the much-anticipated breakout.
---
### **MTNL**
The **monthly chart** of MTNL shows a **multi-decade bullish inverted head and shoulders pattern**. After breaking out, the stock faced resistance at ₹103 and retraced **58.5%**, aligning perfectly with the breakout zone and the **Fib 0.618 retracement level.**
**Why the Rally?**
MTNL’s bounce was overdue, and the AGR news acted as a catalyst, triggering the massive move.
---
### **IDEA**
Vodafone Idea, the weakest of the group, also surged 10% (hitting an intraday high of 15% before closing at 9.11%). Despite its struggles, IDEA displayed critical technical alignments:
1. A **65.54% correction** from its previous high.
2. Support at the **Fib 0.786 retracement** level.
3. A bounce from the **bottom of a rising parallel channel**.
Though IDEA lacked the fundamental strength of TTML and MTNL, it still rallied due to the technical setup.
---
### **Bharti Airtel: Why Didn’t It Rally?**
**Quarterly Chart** (Right):
1. Airtel has been traveling within a **multi-decade parallel channel**.
2. After consolidating for 13 years, it broke out in **October 2018**, delivering **613% returns** since then.
3. The stock reached an **extended Fibonacci target (Fib 2.618)**—an exhaustion zone.
**Weekly Chart** (Left):
1. Airtel corrected only **15%** from its ATH.
2. It is still in a **lower high-lower low (LH-LL)** bearish formation.
3. The price was at a critical juncture of **two resistances**:
- The **falling trendline** from ATH.
- A **weekly resistance** at ₹1640.
**Verdict:**
Airtel had already rallied significantly before the news and was in an exhaustion phase. Strong resistances at current levels obstructed its movement.
---
### **Key Takeaways:**
- TTML, MTNL, and IDEA rallied because they **completed major corrections, formed strong bases, and awaited a trigger.**
- Airtel, having already rallied, was in a consolidation phase with significant resistance levels.
**Conclusion:**
Blindly trading based on news or fundamentals without considering technicals is a recipe for disaster. Fundamentals may create momentum, but the **direction** is always governed by supports and resistances.
A sector-wide news event will not trigger the same momentum across all stocks unless their **technical structures** align. Always combine fundamentals with technical analysis for informed decision-making.
**Disclaimer:**
With over **3 years of teaching experience** in the stock market, including **Technical Analysis**, **Behavioral Analysis**, **Advanced Patterns**, **Emotional Management**, and **News-based Trading**, we are dedicated to educating, not advising on buy/sell decisions.
We are **NOT SEBI Registered** and do not provide specific **Buy/Sell recommendations or calls**. Our primary goal is to deliver **detailed analysis** on how to review charts and offer multi-timeframe perspectives purely for **educational purposes**.
We strongly recommend that our followers **"Learn to Ride the Tide, Regardless of Its Side."**
**Important:** Always consult with a **financial advisor** before making any investment decisions.
If you appreciate our detailed analysis, we encourage you to **rate, like, boost, and share your feedback**.
**- Team Stocks-n-Trends**

US30 Bullish Play for the WeekUS30 hit my zones perfectly and I am excited for this week to be a continuation. I will be looking for another entry to this swing trade on the dips to 42.600-42.700 anything below 42.550 has potential to retest 42.250 which would suck ! Lol so let’s hope the whales are full and ready to leave this area.. next stop 43.500
Scenario: if scenario plays out the week will start bullish with a potential drop back into the KILL ZONE on Wednesday w the red folder news that day but afterwards buyers will clean all that liquidity back up and NFP Friday will propel it to the 1st major target 43.500 w the week closing very Bullish.
Will monitor the play through out the week and update accordingly but if it does close as predicted the following week will most likely be a continuation to the next Major Zone at 44.450 & beyond.
May the pips be in our Favor !

$GLD boiling, $253.99 targéPosted a chart before, this seems to be setting up for a EOY pop. Flagging, spinning stop doji, tight one at least, on the green side. $250 calls for Jan-Feb. Bitcoin CRYPTOCAP:BTC vs. Gold Trust $GLD. Money is on both.
Wall street Loser

GSAT Update and Plan OverviewI've been long for awhile with my entire position in stock and options paid for with profit from calls and puts worked. I'll will be adding stock and options on dips in a ratio that will match post spilt as to not end up holding non-standard options. The ratio has not been announced yet and I will be actively adjusting positions as needed. I intend to accumulate over the coming years. Good luck if you play. No where but up long term.
I don't have a specific target, but I'm focused on GSAT's FCC spectrum, the Qualcomm partnership, and their terrestrial network. They're developing a new cell modem to utilize Band 53 (n53) in standard handsets, coupled with their Apple deal. The more devices sold, the greater the benefit for GSAT, particularly as climate emergency applications gain attention. This creates a self-sustaining cycle of demand for devices and satellite connectivity.
Investor Day on December 12 could act as a catalyst, especially given recent positive developments like expanded licensing, the Qualcomm partnership, and progress with Apple. Price action may see accumulation leading up to the event as investors position for updates. Post-event, the trajectory will likely depend on the depth of announcements and forward guidance. Given the past month's price consolidation, a breakout above key resistance levels is possible if news aligns with expectations


