Next

Bitcoin BTCUSD Next Buy Points TodayBitcoin: BTCUSD
The flag formation stayed good up to the point when the Far East session took over, with no further visits to the lower
parallel - 2 strikes = 'hot' - and Bitcoin then duly broke higher as the flag had warned it would. But the rally only got as high
as 13462, some 18 points shy of the target before falling away again. So was 22 points out on the downside limit yesterday
(meant to test the lower parallel but it stopped just short) and 18 out on the limits of upside for the day - important to
follow how accurate or not these calls are so you can work out an acceptable margin of error to trade off them, is all.
The forecast should have said 'look to short again from upside target' which was remiss as no other upside targets were
mentioned - this was expected limit of upside. Should have covered that. But we make over 1000 points on downside and
took 2 longs which yielded close to 900 points on upside yesterday - where else can you do that on a quiet Saturday?
The first long was brave and not very easy to enter right off the lows as it never hit the lower big parallel, but the second
long at the other end of the day (as China opoened) was worth waiting for and worth following - but even that fell 18
shy of the intended target. No cigars, again. But Ok in quite tough conditions. We could have been wrong-side of this - in
fact since starting to hunt Bitcoin in deadly earnest from November 3rd - over 60 days of intense tracking and trading -
we have never been the wrong side of this monster once...when the chart has said bullish we have followed and
vice versa when it told us it was turning bearish. And then when it told us to stop being bearish, we stopped being
bearish. If we just accept that the chart is boss here and not us we can keep doing OK, hopefully.
Since then Bitcoin has relapsed back 800 points to retest the support line at 12617 and bounced...it should test 13000 and
come off again - still no really good clue that this bear phase is done yet - would be helpful to us to see a double bottom
created on next decline. Failing that, Bitcoin is hammering out a continuation pattern now which can be followed long
once 12987 is broken to upside for move to 13460-13489 again.
Day traders may look to short from 12987 with stops 50 above but ready to reverse long if 13000 is broken, as above. A
break of any support/resistance line by more than 20 points should lead to a test of the next line for day traders.

Bitcoin: BTCUSD Still trying to make its escape even nowBitcoin: BTCUSD
The big lower parallel came to Bitcoin's rescue and gave as good reason as any to close out shorts from here...but it
didn't quite hit the line perfectly, which was then lying at 12028 - the low of the day was in fact 12050 - so quite close,
22 out, but no cigar. If you managed to get out and switch long close to the lows you therefore did really well. We were
then looking to switch long to 12480 for about 400 points - but should have stayed much longer (in hindsight) as Bitcoin
went on to rise by another 700 points or so. Not good. But OK in tricky conditions.
Right now Bitcoin is busy hammering out a little flag with 2 strikes on the lower line. If this can hold up and not revisit
the lower parallel now Bitcoin will stand a chance of another temporary escape - but to do so it will have to break above
12987. Only then would it worth risking a long for 500 points to 13480.
On the downside the lower small parallel of the putative flag formation has to hold up at all costs now to stop Bitcoin
falling away to 12301 -12255. If this then fails it will fall at least back to the low at 12050 and more likely lower still to
11923 and to the big lowest parallel at any selling extreme.
At all costs the lower big parallel must continue to hold this decline or it will go into a bigger tailspin. And should it fail
and then 11090 fail to hold at any point over the weekend it will tip Bitcoin further into very negative territory, forcing
price lower still, to 10486 to start with and then, once this fails back to 8342.

Ripple: XRPUSD Ripple Effect - next buy pointsRipple XRPUSD
Ripple continues to avoid the worst of the fall-out across most
other Alts - still riding high. It's consolidating recent gains
having doubled from 124 to 248, after near doubling again
before that from 64. It's making a U shaped top formation and
now struggling to bust above the old support line which has
become resistance to the upside - and now the range is
beginning to narrow. It has some more unwinding to do yet
but can be bought on dips, though would really only look to
day trade it for now though as this U -shape pattern has some
way to play out yet - the range between 212 and 197 and dips
to 185 could prove profitable in nearterm.
Others looking to buy this rising star can place orders at 197
and even 186 which should get struck if patient enough.

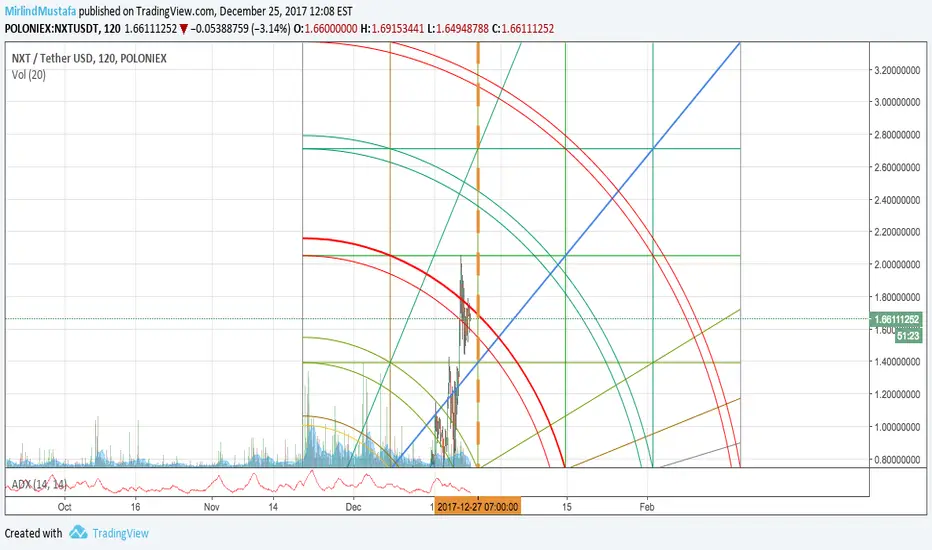
Buy Next (NXT) and hold!Next will have another Energy point on 27 December. Price will reach around 2.7$ at least. Happy trading!
Bitcoin BTCUSD Next buy points from hereBitcoin. BTCUSD
After spending an hour or so dancing between the two bigger parallels Bitcoin finally broke higher when China opened, and
buyers drove it in a straight line 600 points higher in 15 minutes of frenetic buying, seen in the strong green candles
on chart - and rising up through 4 blue lines of resistance before peaking and now falling back to where we were at the
start of this break yesterday. Frustratingly the advice to raise stops on longs to break even was too timid (at 14250) and so
apologies for losing out on a good trade, as so often, when China kicks in. (it was getting
late, UK time and had to protect the position overnight - honestly would not have had to do this if not for time factors
- think need to shift sleep patterns if a UK or European based trader to somehow last up to around 3am UK time - otherwise
so many good moves are missed - but then some great moves start at 5 to 6am UK time too...it's not easy to decide)
There is no trade still - but that little parallel it's working down now may present an opportunity to go long once it's
broken to the upside, with stops under the parallel by 100 points (either follow quickly on exit of the upper parallel or
wait for a retest from above once broken) - at around 14200 with a stop 50 to 100 below. Otherwise we can wait to see if
there is another test of 113542-13456 zone to try another long from here.


BTCD, 50 - 80% GainBecause of the BTC fork i guess it's impossible to know what will happen to other coins.
I went in big here, Looking for a 50 - 80% gain, Hopefully before the fork.
Once it's time to fork BTC i will go to BTC, Gain my BitCoin Gold and fast as hell sell all to USDT and let the market calm down.
I have absolutly no idea what will happen and for BTCD, i will sell on super tight stop/loss.

ETHUSD Opportunity knocks for next Bull PhaseETHUSD
A fabulous weekend has developed into a terrible week for
the Alts. This should create another fabulous buy opportunity
over the coming 12 to 24 hours...and potentially lead into
another good weekend ahead...if we can pick this up at lower
levels without getting stopped out in the process.
First support is nearby at 630 which if broken now should lead
to further weakness back to 557-551 range (a good short when
triggered). Ideally though, for bulls still wanting to get long
here, ETH will plunge even lower, to 512 and maybe, if lucky
right back down to the rising dynamic support at around 447
before bouncing strongly. It might not reach here, but we can
still place orders in market at a coiuple of points above 447
and see if it gets struck. The 488-481 range is the other range
to target as a potential antry zone for longs on any further
weakness but any stops will have to remain below the 440
mark to keep from being hit...if you can handle the potential
9% downside from 481 there is 100% upside from 447.
Look to buy over the next 24 hours, when the pips are really
screaming. Need a plan and the courage to execute. The
stage is set...let's see how close we can get to the bottom
before committing to next long from here.

BCHUSD Flag Formation: Next long set-up on breakBCHUSD Update
What a difference a week makes. Within hours of the last comment BCH had fallen away to a low at 1631, 7 points
lower than the perfect entry point at 1638, before ripping 300% higher in 6 days flat. Facebook eat your heart out.
Now it's in the process of making a flag formation which will stay good so long as the rising dynamic from the beginning of
the move holds up price on all tests. A break above the upper parallel that's containing this downwave will be worth
following for another retest of the highs...
And on the flip side of this particular coin, if that dynamic from the 'lows' at 1766 gets broken at any point now it will
then fall away further down the same parallel to 2420 where it should bounce once more.Although it looks more likely to
break up rather than down from here, we don't really have to second guess this right now. The chart will tell us and we
can follow.


Bitcoin BTCUSD Entry points for shorts: Clean chartBitcoin: BTCUSD Trading The Breakdown
The massive head and shoulders top formation that has been building since the weekend highs has been completed today.
Though quite loosely defined and with two potential neck-lines lying 300 points apart at 15814 and 15509 the pattern is
undeniably bearish for the next 24 to 48 hours by look of the chart. But in very near term Bitcoin is staging a counter-rally
which has taken it back to the upper neckline at 15814 where it's meeting resistance - it will now have to push on through
here and hold up to trigger a further unwinding of shorts back up to 16447 and into the upper parallel before it crashes back
down again. But whilst unable to beat 15814 and hold Bitcoin is vulnerable - a sell from 15800 with stops 60 higher for small
loss if wrong and it can beat this level and hold - in which case it should rally a further 800 points to the upper parallel
and then come off from there - so presenting a second chance to short from highest extreme likely with a stop about 80
points above the patrallel. So two chances to short from here.
It should fall away from 15814 (and from 16447/upper parallel at highest) - to test 14040 at least and more likely 13086.
The minimum downside target implied by the head and shoulders is 11391. The blue lines of support and then resistance
have been working OK so far since the descent began - as usual a fall below any line by more than 25 points or so should
lead to further weakness to the next. The new parallels guiding this descent are wide and strong - wider than any of
the up-trends on the other side of this mountain. It's big. Obviously. The chart shows it clearly.
Right now Bitcoin is making a little continuation pattern - under the neckline - it will fight at 15000 and just above - a
lot of orders still determined to buy at this round number - but they are matched by equally determined sellers at 15814.
Eventually the bears are likely to win...use any last rally up to 15814 as a selling opportunity with stops just 60 points higher
for small loss if wrong, looking for a fall to 14035 initially, then lower still, as above.
If not already short any break below 15000 by more than 10 points can be followed for a fall to 14040. And when this gives way
another short opens up, this time to 13086. Or look to use this little rally attempt to sell from 15500 with stops 60 points higher
*Stops - cannot be used in traditional manner with Bitcoin. You have to keep a stop number in your head and set an alert
so if it comes within 50 points or so you get a notification and then have to watch to see price action: is it a spike down to
your level and quickly bought back up or is it sticking... be cold, emotionless, machine-like. Easier said than done sometimes.

ARDOR breakout after NXT going crazyWondering if ARD will follow his big brother NXT.
It surely is at the level where it could breakout and go North ;)
What are your thoughts?

NXT ascending flag pattern! Bullrun ahead! + 65%NXT/BTC showing nice ascending flag pattern.
Strong bullish movement ahead.
target 1 around 6.8k as indicated in the chart.
Best of luck to you!
This is no financial advice...


LITECOIN: LTCUSD Next entry point close at handLITECOIN LTCUSD
The breakout above the upper parallel of the flag formation
was very disappointing. The failure has forced LTC back down
the same parallel and rinsed out stale bulls along the way.
It's now back to the start point and if it's going to rally now, it
should be from here. Look to enter long again between 288
and 284 with stop below 282 for small loss if wrong from here

IOTA: IOTUSD Next Buy PointIOTUSD IOTA Buy and Sell Points
Next buy point comes on a break above the small dynamic
resistance line which is currently holding back price or
from the first support line at 4.363 with stop below the
lower (rising) dynamic that underpins the rally today. Look
for rally back to the upper dynamic that holds back price
on chart around 5.148.
Next Sell Point will come on any break of that same
dynamic at 4.273 now, looking for a fall to 3.569. Reverse
any shorts here with stops below 3.500, if entry is struck.
Looks good still whilst 4.363 holds up .

BITCOIN: BTCUSD Retesting underside of larger parallel alreadyBitcoin: BTCUSD
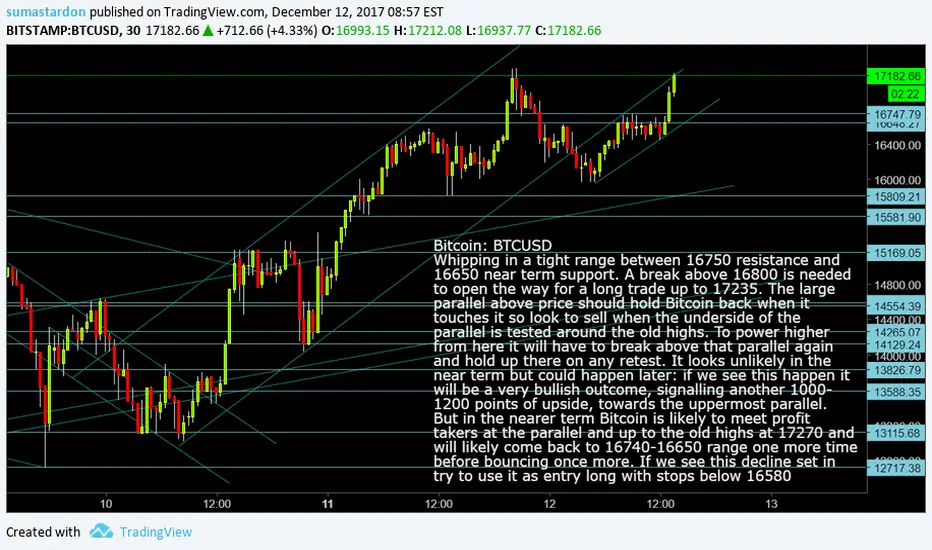
Whipping in a tight range between 16750 resistance and
16650 near term support. A break above 16800 is needed
to open the way for a long trade up to 17235. The large
parallel above price should hold Bitcoin back when it
touches it so look to sell when the underside of the
parallel is tested around the old highs. To power higher
from here it will have to break above that parallel again
and hold up there on any retest. It looks unlikely in the
near term but could happen later: if we see this happen it
will be a very bullish outcome, signalling another 1000-
1200 points of upside, towards the uppermost parallel.
But in the nearer term Bitcoin is likely to meet profit
takers at the parallel and up to the old highs at 17270 and
will likely come back to 16740-16650 range one more time
before bouncing once more. If we see this decline set in
try to use it as entry long with stops below 16580

IOTA: IOTUSD Trying to base here - buy points todayIOTA IOTUSD Update Trying to base here - Buy points
Within minutes of publication the little dynamic support line that had held upyesterday's rally was broken, flipping IOTA
from positive back to negative on a dime. Stops for longs were running up under the parallel as price moved north. Well it
was good whilst it lasted but once that little dynamic was lost we can see the damage done. That stop was at around 4598
when the parallel was finally lost, so by using this method of exit on longs the vast majority of the rally was locked in and
no real damage has been done. We live to fight again from lower levels now...
Iota is now trying to base out at 3037 by look of chart but is likely to have a problem at the tangled mass of resistance just
above here, where fixed and dynamics meet...no way do we get long again here until that has been beaten through...it
has to get back above the upper parallel, now around 3400 and survive any retst of that parallel from above once broken
to trigger next long from here. Maybe we will get a better entry long from lower down still...need to watch this and look
for potential double bottom/loss of downside momentum at 3037 for fist clue we have a low forming now...if it fails here
we stand back looking to see if 2.865 offers support - if not it means 2.172 is the next level to look for a buying opprtunity.
So we are left with 4 potential entry points here: at 3400 ish on a break of the upper parallel with stops kept under the
parallel by 50 points or more. Or at a potential yet-to-be-decided double bottom at 3037
And should this fail to hold from 2.865 or at lowest from 2.172 if we see it.
That's a little complicated but covers the levels. The easiest will be the break above the upper parallel. It should attract
quite a lot of buyers as well as shorts closing down/buying back too. watch it and follow when the signal is given on the
chart. Use stops though. Yesterday should have taught you that by now. Lesson learned.

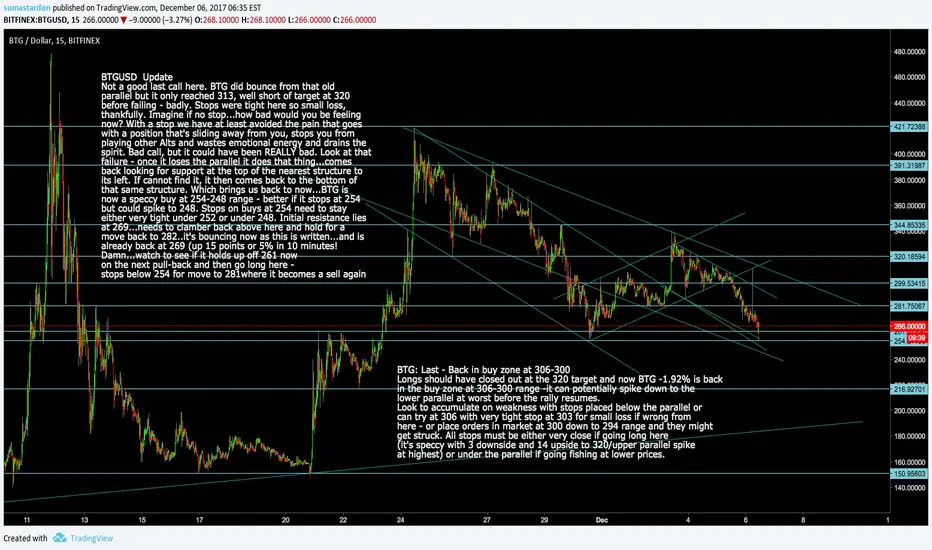
BTGUSD: Back in the next Buy Zone on next pull-backBTGUSD Update Buy on next Pull-Back
Not a good last call here. BTG did bounce from that old
parallel but it only reached 313, well short of target at 320
before failing - badly. Stops were tight here so small loss,
thankfully. Imagine if no stop...how bad would you be feeling
now? With a stop we have at least avoided the pain that goes
with a position that's sliding away from you, stops you from
playing other Alts and wastes emotional energy and drains the
spirit. Bad call, but it could have been REALLY bad. Look at that
failure - once it loses the parallel it does that thing...comes
back looking for support at the top of the nearest structure to
its left. If cannot find it, it then comes back to the bottom of
that same structure. Which brings us back to now...BTG is
now a speccy buy at 254-248 range - better if it stops at 254
but could spike to 248. Stops on buys at 254 need to stay
either very tight under 252 or under 248. Initial resistance lies
at 269...needs to clamber back above here and hold for a
move back to 282..it's bouncing now as this is written...and is
already back at 269 (up 15 points or 5% in 10 minutes!
Damn...watch to see if it holds up off 261 now
on the next pull-back and then go long here -
stops below 254 for move to 281where it becomes a sell again
Bitcoin: BTCUSD Just a another Manic Sunday/Next buy pointBitcoin: BTCUSD Wave and Price just keeps Growing
Life and Times: Just Another Manic Sunday - Bear Witness to the Fastest Market in History - Bar none.
Next Buy Point for last 500
Update/positions: Yesterday we got stopped out at 10900 for a 900 point win from 10008 and were looking to re-enter from
10638 in a perfect set-up - it was close but no cigar with the subsequent low being 20 points higher. See how it made that
base under the highs? Hardly bearish was it? If it was bearish it just would not have behaved like that. Remember this
behaviour! You're going to see a lot of it in this environment on other Alts at different points ...see how it behaves under
old highs: does it recoil hard, big red candles of rejection or it lazy, almost disinterested? Long term holders don't give a hoot
for whether price is 12 or 13 or 9 or 21. it's just a number. They ain't selling. No supply. Lots of demand, and - as humans
are wont to do - we are somehow much happier paying 11.5 now than 9.5 just 48 hours ago. Humans! Are we not, like
Bitcoin itself, a piece of work to behold ?
Traders' Update
Look at this wave now. It's tidal, tsunamic in size. It grows as fast as Alien and moves 100 times quicker.
If day trading, or holding long again from 10650 ish lows of later yesterday prepare to take profits as the upper parallel is
tested, spiking up into the top-most parallel at best before falling away again... looks likely to come back to 11385 at
some point and potentially to 11070 - note the two little pins at the top - a tiny tiny fractal flag is forming by the look of
things before the next surge to the upper parallel. it looks like it will consolidate close to the highs and at worst
dip to 11500 and perhaps spike to 11385 at lowest before it rallies again to hit the upper parallels. Next buy/add point if
we don't fall away further from here comes on the break of the tiny dynamic coming off the highs. But close out again at
the parallel for 400 to 550 gains. If we see this challenge above 12000 and into 12150 range it is possible that we then
see a large collapse start from there ...doesn't have to happen, but would be 'normal' behaviour in any other 'stock'.
The problem is Bitcoin is hardly 'normal'. Supports shown on the chart are the most likely spots to expect support to step
in later on today/tomorrow.
* Sorry once again: was banned for 24 hours for posting a text wall to chat room. Bad bad bad

DASHUSD: Continuation pattern ahead of next surgeDASHUSD Continuation pattern under highs
Longs left in the market were triggered by the spike down to
641 level (low at 639) so we got filled, just! Ain't fishing great?!
Now Dash is unwinding again but doing it in a flag/pennant
formation under the highs. two striles of the lower parallel
signifies hot, still. Don't want to close this position unless the
lower parallel fails, in which case it will tumble back to 673
and spike at 641-639 again. If this happens close and buy again
at 643 with stops 20 lower.
On upside, look to add or follow on a break above the upper
smaller parallel of the flag for move to up to the bigger
parallel above it where look to take profits again and buy
back from lower once more.
