Japan's GDP sparkles, yen pushes higherThe Japanese yen is in positive territory on Monday. In the European sesssion, USD/JPY is trading at 147.87, down 0.35% on the day.
The week has started on a positive note in Japan, as GDP for the second quarter was revised sharply higher to 2.2% y/y, up from the initial reading of 1.0% and above the Q1 gain of 0.3%.
This was the fastest pace of growth since Q3 2024, as private consumption was higher, in part due to government subsidies for rice and energy. Exports were higher as firms rushed to ship to the US before the blanket 15% tariffs kicked in. On a quarterly basis, GDP expanded 0.5%, up from the initial reading of 0.3%.
The increase in exports could be short-lived, as the US tariffs are making Japanese exports more expensive. Tariffs concerns could delay the Bank of Japan from raising interest rates, and third-quarter GDP will help gauge the effect of the tariffs on Japan's economy.
The political uncertainty in Japan is another factor which supports the BoJ staying on the sidelines. Prime Minister Shigeru Ishiba has resigned after a disastrous election in which Ishiba's coalition lost its majority in the lower house of parliament. It remains unclear who will replace Ishiba, with a leadership vote expected in October.
US nonfarm payrolls disappointed with a marginal gain of 22 thousand, well below the upwardly revised gain of 79 thousand in July and the market estimate of 75 thousand. The unemployment rate edged up to 4.3% from 4.2%, the highest level since December 2021.
The money markets responded to the weak nonfarm payrolls report by fully pricing in a rate cut at next week's meeting, with a 90% probability of a quarter-point cut and a 10% chance of a half-point cut, according to CME's FedWatch. Prior to the jobs release, there was a 0% chance of a half-point cut.
USD/JPY is testing support at 147.60. Next, there is support at 146.62
There is resistance at 148.37 and 149.35
Nfp

ETH 1H Analysis - Key Triggers Ahead | Day 14💀 Hey, how's it going ? Come over here — Satoshi got something for you!
⏰ We’re analyzing ETH on the 1-hour timeframe timeframe.
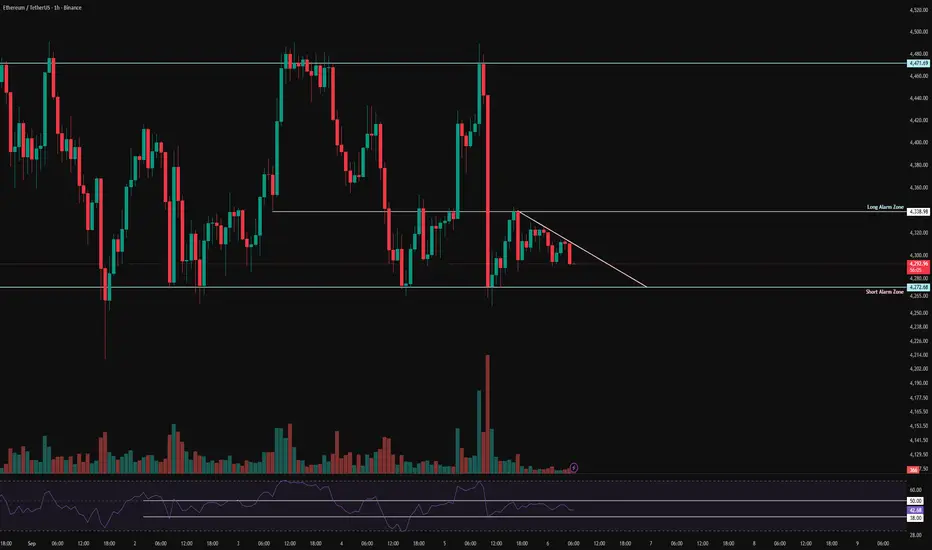
🔭 On the 1H timeframe for Ethereum, we can see that after yesterday’s news, ETH pushed upward toward the top of its range but failed to break out. From that resistance, it faced a heavy rejection, and this drop happened within just two 1H candles! At the moment, ETH is in a consolidation zone, and breaking out of this compression could provide us with an entry.
⛏ The key RSI oscillator levels are at 38 and 50. Once RSI breaks above or below these zones, Ethereum could start its next move following the effects of yesterday’s NFP news.
💰 The size and volume of red candles have increased sharply, showing strong selling pressure. The corrective bounce happened step by step, but then another fairly large red 1H candle was printed. With continued selling pressure, Ethereum may test lower price levels.
🪙 On the 1H timeframe for the ETHBTC pair, we can see it is moving inside a multi-timeframe range. Each time it reaches the bottom of the box, volume increases and the price reacts with zig-zag moves. Note that the bottom of this box is at 0.03864, which has already been tested twice. This area should be considered as a short alert zone for ETHBTC.
💡 The alert zones for Ethereum itself are at 4,272$ and 4,338$. If either of these levels is broken, ETH could start a strong move, especially considering the momentum after yesterday’s NFP News.
❤️ Disclaimer : This analysis is purely based on my personal opinion and I only trade if the stated triggers are activated .
BTC 1H Analysis - Key Triggers Ahead | Day 34💀 Hey, how's it going ? Come over here — Satoshi got something for you!
⏰ We’re analyzing BTC on the 1-hour timeframe timeframe.
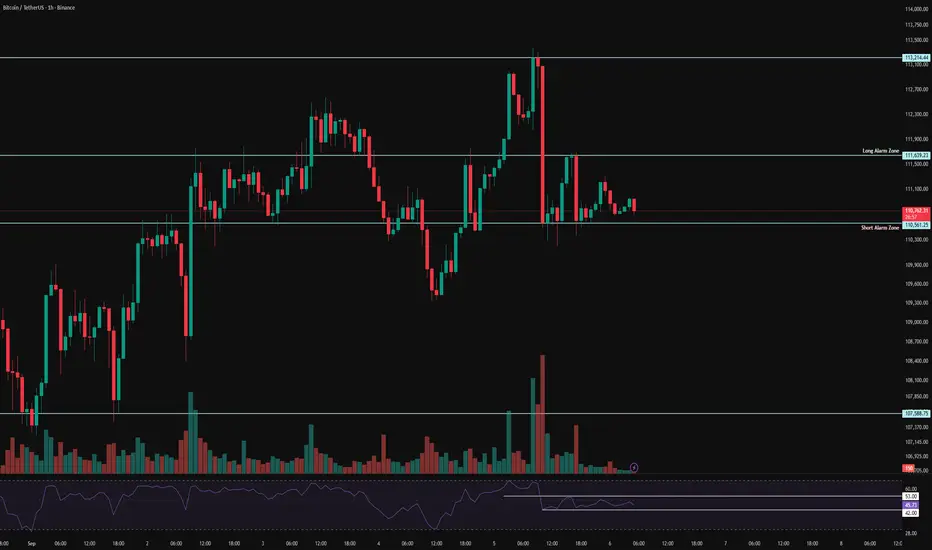
👀 On the 1H timeframe for Bitcoin, we can see that after yesterday’s NFP news, Bitcoin moved toward its resistance levels but then faced a very strong rejection. Personally, I expected some big green candles after that news. Right now, Bitcoin is consolidating, and the top and bottom of this range should be considered as breakout zones.
⚙️ The key RSI levels for Bitcoin are around 42 and 53. Once RSI breaks out of this range, Bitcoin can start its new move following the impacts of yesterday.
🕯 The size and volume of the red candles after the news increased sharply, and with one strong selling-pressure candle, the price dropped from the top of the range to the bottom.
💵📊 On the 1H timeframe for USDT.D, we can see that after yesterday’s news it had a very strong reaction from its support area and, with one massive hourly whale candle, pushed up toward its resistance at 4.49%. From there, it got rejected with several red candles and formed a higher low compared to its previous bottom. Keep in mind that if 4.49% is broken, Bitcoin could go into a deeper correction.
🔔 The alert zones for Bitcoin are the top and bottom of this range, which can give us entry signals. Our long alert zone is at 11,600$, and if this level breaks, Bitcoin could move higher. On the other hand, 11,056$ is our short alert zone, and with a breakdown of this level and selling pressure, Bitcoin could push toward lower levels.
❤️ Disclaimer : This analysis is purely based on my personal opinion and I only trade if the stated triggers are activated .
THE KOG REPORT - NFP THE KOG REPORT – NFP
This is our view for NFP, please do your own research and analysis to make an informed decision on the markets. It is not recommended you try to trade the event if you have less than 6 months trading experience and have a trusted risk strategy in place. The markets are extremely volatile, and these events can cause aggressive swings in price.
For this months NFP, due to the aggressive stretch on gold upside, we’re only looking for the extreme levels to attempt the trade. Even then, we’re of the view that we will let this play out for today and next week look for a clean reversal before getting in and taking what is needed.
We have the immediate level of support below 3550-40, which needs to be held in order to attempt the upside levels of 3580-5 and if that level is broken 3603-10. It’s that higher level that we feel if attempted, could present a decent opportunity to attempt the short trade, unless broken of course.
Lower down, the red box bias level is sitting at 3540 which needs a clean break below to then confirm the bearish move has started and we can then either capture the retracements in attempt to target the 3480-5 level or, wait lower for price to exhaust, and once a clean reversal is formed, attempt the long trade back upside.
The ideal scenario here is a break above the 3585 level an attempt on 3600, exhaustion there and then a possible short for next week. It’s been a choppy week but we’ve hit all of our bullish targets so lets observe more than we trade today.
RED BOXES:
Break above 3555 for 3561, 3568, 3576 and 3588 in extension of the move
Break below 3540 for 3533, 3530, 3520, 3506 and 3490 in extension of the move
Please do support us by hitting the like button, leaving a comment, and giving us a follow. We’ve been doing this for a long time now providing traders with in-depth free analysis on Gold, so your likes and comments are very much appreciated.
As always, trade safe.
KOG

UK retail sales beat estimate, US nonfarm payrolls sink, pound jThe British pound has pushed higher on Friday. In the North American session, GBP/USD is trading at 1.3519, up 0.66% on the day. About half the pound's gains have come following today's weak US nonfarm payrolls report.
It was a good-news-bad news retail sales report out of the UK today. July retail sales rose a respectable 0.6% m/m, up from a downwardly revised 0.3% in June and higher than the market estimate of 0.2%. The improvement was driven by warm weather and the women's European soccer championship.
The bad news was the sharp downward corrections to the the previous months' data. Retail sales for June was revised lower to 0.3% from 0.9%. Annualized retail sales posted a with a gain of 1.1%, missing the market estimate of 1.3%. This was above the June reading of 0.9%, which was revised from 1.7%.
All eyes were on today's US nonfarm payrolls, which disappointed with a marginal gain of 22 thousand, well below the upwardly revised gain of 79 thousand in July and the market estimate of 75 thousand. The unemployment rate edged up to 4.3% from 4.2%, the highest level since December 2021.
Employers remain cautious about hiring in an uncertain economic environment and the Trump tariffs aren't helping to restore confidence.
This key employment release has taken on double significance, coming shortly before the next Federal Reserve meeting on September 17. There could be calls for the Fed to consider a jumbo half-point cut as the labor market is cooling quickly, although the most likely scenario is a modest quarter-point cut.
GBP/USD has pushed above several resistance lines and is testing 1.3499. Next, there is resistance at 1.3552
1.3415 and 1.3395 are providing support

USDJPY | NFP helped pushed Price down since USD is weakIt looks like the price has moved into our area of interest. All that remains is to secure our position and anticipate further downward movement.
Right now, the price is at a previous high-volume area. We'll have to observe closely to see if this changes the bias, providing us with bullish intent or continuing on a bearish trend.
For now, we wait and watch the market closely.

BTC 1H Analysis - Key Triggers Ahead | Day 33💀 Hey , how's it going ? Come over here — Satoshi got something for you !
⏰ We’re analyzing BTC on the 1-hour timeframe timeframe .
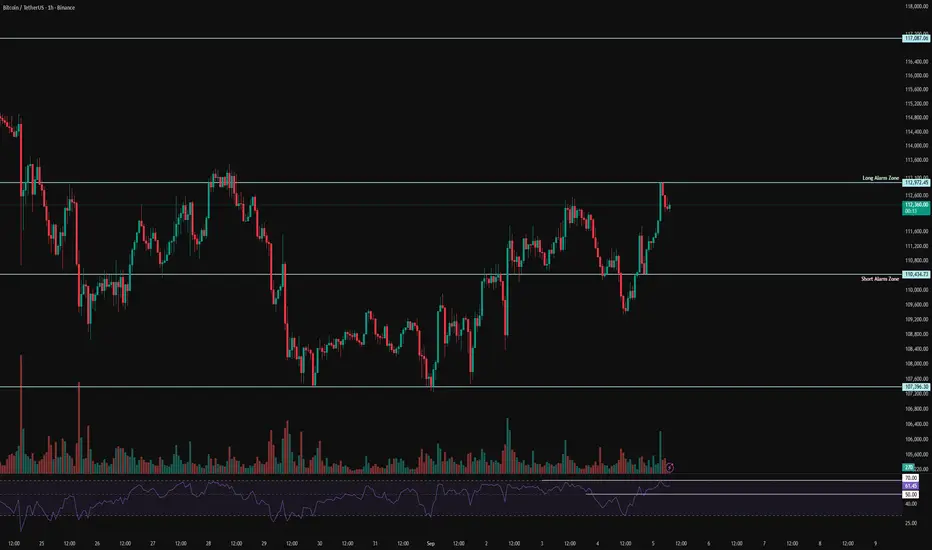
👀 On the 1H timeframe of Bitcoin, we can see that BTC moved upward after breaking through its taker-seller zone, with the breakout fueled by high volume and a whale candle. A strong resistance has now formed at $113,000, while a solid support floor is holding at $110,400. With today’s news, one of these levels is very likely to break. Keep in mind, today’s news is extremely important—if it turns out positive for crypto, the market could push higher and start a strong bullish leg.
⚙️ The RSI key zones are at 50 and 70. If volatility increases and momentum crosses above these levels, Bitcoin could kick off a strong move.
🕯 The size and volume of green candles have increased, building a very solid support around $110,400. Price is currently sitting in a resistance area, and with the NFP release we could see strong candles forming with high volume.
📊 On the 1H timeframe of Tether dominance (USDT.D), we see that after its recent bullish leg, it formed a trendline which has now been broken, followed by a pullback. Currently, USDT dominance is sitting at a very important support floor. If this floor breaks, a significant amount of Tether could flow into Bitcoin and altcoins.
🔔 The alarm zones for Bitcoin are set at $113,000 and $110,400—these are the levels to watch and place alerts on. Since we have the NFP news release today, a potential whale move is likely. If you’re planning to trade the news, define a small risk, use trigger orders, and make sure to apply strict risk management!
❤️ Disclaimer : This analysis is purely based on my personal opinion and I only trade if the stated triggers are activated .
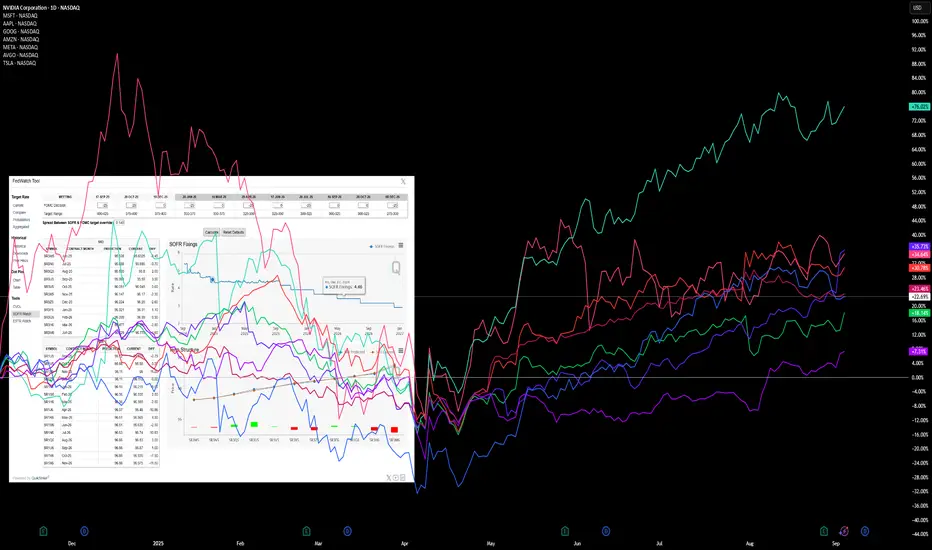
Labor Market vs. Inflation Risks: What Traders Should WatchCME_MINI:NQ1! CME_MINI:ES1! CME_MINI:MNQ1! CME_MINI:MES1! CBOT_MINI:YM1! CBOT:ZN1! CBOT:ZB1! ECONOMICS:USNFP
The stock market is currently holding near all-time highs. Today, the BLS (Bureau of Labor Statistics) report, which includes the NFP (non-farm payrolls), will be released at 7:30 am CT.
Market participants are closely watching the non-farm payrolls, with the forecast at 75K, as well as any prior revisions to earlier NFP numbers. The unemployment rate is expected at 4.3%, a slight increase of 0.1%.
Looking ahead, upcoming key events include inflation data and the September FOMC rate decision:
• Aug PPI (Sep 10): A gauge of upstream price pressures. Hot numbers would signal renewed inflation risks.
• Aug CPI & Core CPI (Sep 11): Critical headline data. A softer print would support the dovish case.
• Fed Decision (Sep 17): This meeting comes after the Aug NFP data release (Sep 5).
While there is broad optimism and euphoria in the market, we remain cautious based on our analysis of major futures indexes. Traders should be mindful of signals that could point to a pullback.
Our reasoning:
Markets are currently pricing in two 25 bps cuts for the September and October FOMC meetings, which would bring the target rate down to 3.75%–4.00%.
Additionally, markets are now pricing in four 25 bps cuts in 2026. Prior to the Jackson Hole meeting and recent Fed-related developments, expectations were for three cuts in 2025 and two cuts in 2026.
Does this imply that the effective tariff rate is benign? Is inflation expected to fall, or does this suggest that the Fed is willing to tolerate average inflation in the 2.5%–3.0% range?
The upcoming Fed meeting is likely to emphasize risks to the labor market, while downplaying inflation risks, highlighting the tradeoff within the Fed’s dual mandate.
Other considerations:
Seasonal and cyclical flows also suggest that equity indexes tend to underperform in September and October on average.
Risk-Monitoring Framework: Signs of a Pullback
Given the deteriorating macro backdrop, further steepening of the yield curve, persistently high long-end yields, and the heavy concentration of stock market capitalization in the Mag 9 stocks, it is critical to monitor:
1. Rates & Yield Curve
• 2s10s & 5s30s steepening: Excess steepening with long-end yields above 4.5% would tighten financial conditions.
• SOFR futures spreads: Divergence vs. FOMC guidance can signal rate-path misalignment.
2. Labor Market Signals
• NFP revisions: Downward revisions of >50K would reinforce labor weakness.
• Unemployment rate: Sustained above 4.3% could mark a turning point for the Fed’s labor mandate.
3. Inflation Data
• PPI upside surprises: A risk that supply-side shocks re-ignite inflationary pressures.
• CPI/Core CPI stickiness: Core >3.1% YoY would challenge the market’s dovish pricing.
4. Equity Market Internals
• Mag 9 leadership: Watch for relative weakness in NVDA, AAPL, MSFT, AMZN, META, TSLA, GOOG, AVGO, and BRK.A.
• Breadth indicators: Advance/decline line and % of S&P 500 above 200-day MA. Narrowing breadth = fragility.
• Volatility (VIX): A spike above 20 would indicate stress returning to equity risk sentiment.
5. Cross-Asset Indicators
• Credit spreads (IG & HY): Widening signals stress in funding markets.
• USD & Commodities: Rising USD and higher energy prices would tighten global liquidity.
Conclusion
While optimism remains strong, we caution that macro deterioration, yield curve dynamics, and concentrated equity leadership create fragility. Pullback risks rise if:
• NFP disappoints sharply,
• inflation re-accelerates, or
• outperformance in the Mag 9 begins to roll over.
Traders should monitor these risk indicators closely, as they often precede market drawdowns in September–October.
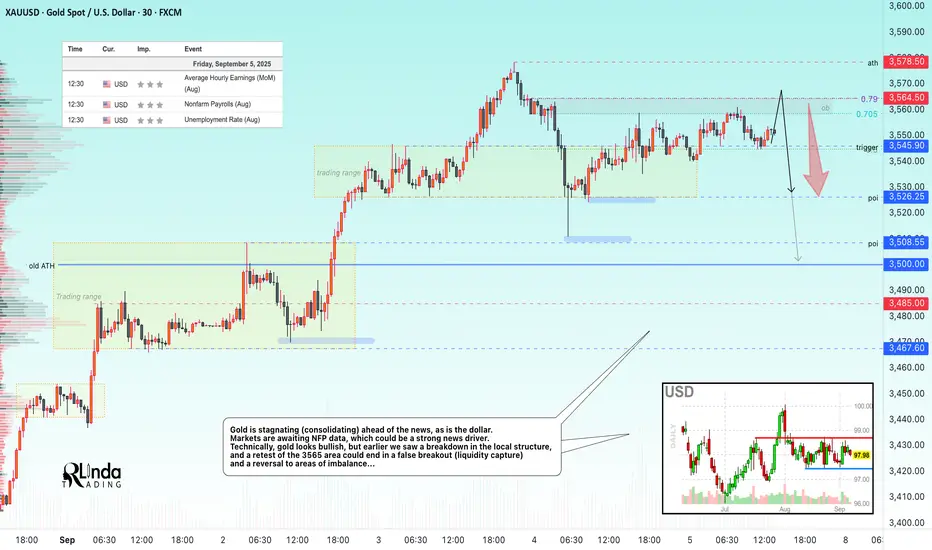
GOLD → ATH retest before NFP. High risk level...FX:XAUUSD remains in a bullish trend, but short-term dynamics depend on NFP. A break above $3578 will open the way to new highs, but profit-taking at record levels could increase volatility.
Gold remains strong ahead of US NFP data, which may confirm the Fed's policy easing. Weak data (forecast: +75K new jobs) will reinforce expectations of a rate cut and support gold. However, the risk of a correction is quite high, and any nuances could trigger liquidation. Weak employment data, namely rising unemployment and low ADP figures, are strengthening bets on a Fed rate cut, which overall only increases interest in the metal.
Resistance levels: 3564.5, 3578.5
Support levels: 3545.9, 3526, 3508
NFP data will determine the short-term trend. A weak report will lead to growth to $3600+, while a strong report will lead to a correction to 3450-3400. Technically, I expect a correction after the local bullish structure breaks down. It is not worth trading on the news; it is better to wait 20-40 minutes after the release to make decisions based on fundamental data.
Best regards, R. Linda!
Fed cut odds hit 97% ahead of Friday’s jobs report Markets are waiting for Friday’s U.S. NFP jobs report, which could heavily influence the Federal Reserve’s next move on interest rates.
Traders want a result that supports the case for rate cuts but doesn’t raise fears of a weakening economy. The ADP private payrolls report showed 54,000 new jobs in August. Stocks moved higher on the news, as wall street saw the number as weak enough for the Fed to cut rates in September, but not so weak that it signals a recession.
According to CME Group’s FedWatch tool, there is now a 97% chance the Fed will lower rates when it meets in two weeks.

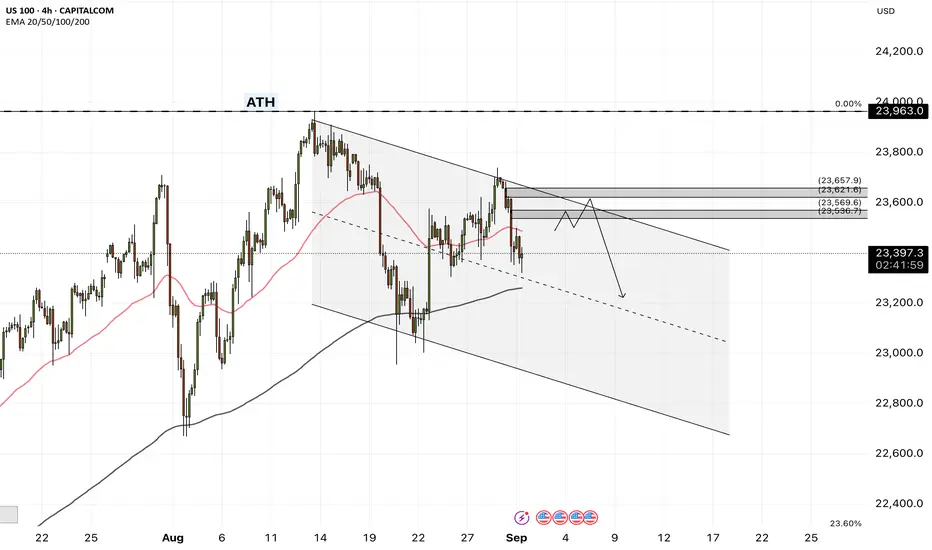
NASDAQ on the Edge: Head & Shoulders + Bearish SeptemberOn the daily chart, a clear Head & Shoulders formation has developed: left shoulder in mid-July, head in early August, and right shoulder completed at the end of August. The neckline has been broken with volatility, and price is now retesting the supply zone at 23,600–23,800. This pullback aligns with a weekly area of strong supply, suggesting a potential rejection.
The projected target of the pattern points toward 22,800–22,600, an area overlapping with a key structural support. RSI shows bearish divergence and remains below the midline, reinforcing the short bias.
COT Report (August 26, 2025)
Non-Commercials (funds/speculators): +1,875 longs, -362 shorts → small long increase, but without strong conviction.
Commercials (hedgers): -5,832 longs, -1,579 shorts → clear reduction in long exposure, less bullish protection.
Net change: -5,275 longs → overall unwinding of long positioning, signaling underlying weakness.
Interpretation: Speculators remain net long, but commercials significantly cut exposure, suggesting caution on further upside.
Seasonality (September)
Historically, September has been a negative month for NASDAQ:
10-year average: -148 pts
5-year average: -313 pts
2-year average: -804 pts
The seasonal pattern supports a bearish bias, with weakness usually concentrated in the first half of the month.
Synthesis & Trade Bias
Technical: Bearish Head & Shoulders → target 22,800–22,600.
COT: Net long reduction by commercials → bearish pressure.
Seasonality: September statistically weak.
➡️ Bias: Short on NASDAQ (NQ).

This week’s main event: Non-Farm Payrolls – Friday at 15:30!This Friday, September 5, 2025 at 15:30 EET , the U.S. Department of Labor will release one of the most anticipated macroeconomic reports — the Non-Farm Payrolls (NFP) . This release could confirm whether hopes for a near-term Fed policy shift are justified — the very hopes that helped U.S. equities climb to historic highs in late August. Markets see this report as a checkpoint for both the ongoing rally and rate expectations.
NFP and the markets: 3 possible scenarios
Strong report: If job creation exceeds expectations, unemployment falls, and wages accelerate — markets may believe the Fed will stay cautious on cutting rates. Typically, this boosts the dollar and bond yields, while growth stocks and tech underperform. More traditional sectors like banking, industry, and energy tend to hold up better. Gold and crypto often dip under pressure from a stronger USD and rising yields.
Weak report: If job gains disappoint, unemployment rises, and wage growth slows — this strengthens the case for a faster Fed pivot. In this case, the dollar usually softens, yields fall, and growth stocks, gold, and major crypto (BTC/ETH) gain on expectations of lower rates.
Neutral report: If numbers align closely with forecasts and there’s no big surprise, markets may remain range-bound. Initial reactions fade quickly, and focus shifts to the details — such as wage data and revisions to past reports. Price action often becomes choppy and short-lived until the next key catalyst.
The September 5 NFP release is a crossroads moment before the Fed’s September 16–17 meeting. Volatility is almost guaranteed, and the market’s reaction will depend on the combination of headline jobs number, unemployment rate, wage growth, and revisions. According to FreshForex , this setup offers tactical trade setups across forex, metals, and crypto pairs.

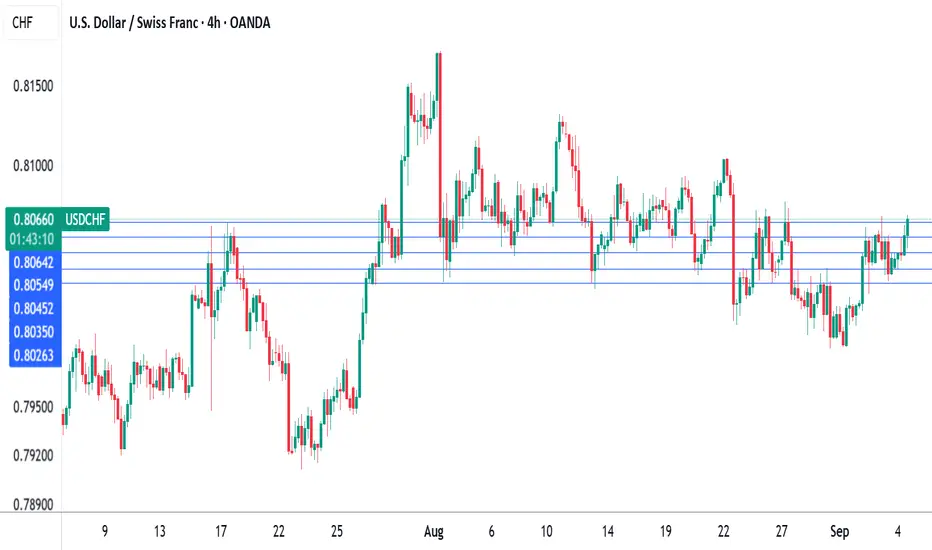
Swiss CPI declines, will SNB revert to negative rates?The Swiss franc has edged lower on Thursday. In the North American session, USD/CHF is trading at 0.8052, down 0.13% on the day.
Swiss inflation declined in August for the first time since January. CPI slipped 0.1%, following the July reading of zero and the market estimate of zero. Yearly, CPI rose 0.2%, unchanged from July and in line with the market estimate.
The soft inflation report could support the case for the Swiss National Bank to return to negative interest rates. The SNB had a negative rate policy in effect for eight consecutive years until 2022, when high inflation forced the bank to sharply tighten policy. The markets widely expect the SNB to hold rates at this month's meeting, but if inflation continues to sag, there will be pressure on the central bank to lower rates.
SNB President Martin Schlegel has stressed in the past that the central bank could revert back to negative rates if necessary but would try to avoid doing so since it causes difficulties for businesses and consumers.
The SNB is also keeping a close eye on the value of the Swiss franc. The Swiss currency has soared against the US dollar, gaining 11.3% since the start of the year. In June, USD/CHF fell below the psychologically significant 0.80 level for the first time 2011. The central bank does not want the franc to continue appreciating, since it means that Swiss exports are more expensive and thus less competitive.
US tariffs have dealt a blow to the export-reliant Swiss economy. Switzerland has had to absorb US tariffs of 39% on most goods, which has put the country at a serious disadvantage against the neighboring European Union, which faces tariffs of only 15% on most goods.
The USUSD/CHF is testing resistance at 0.8045. Next, there is resistance at 0.8054 and 0.8064.
0.8035 and 0.8026 are providing support
US job numbers this week. Keeping an eye on USD and US indicesWe are keeping a close eye on the US job numbers this week, as those fall into the Fed's spotlight. The expectations are low, so it would be interesting to see if the numbers can get even lower. Let's take a look.
MARKETSCOM:DOLLARINDEX
FX_IDC:EURUSD
Let us know what you think in the comments below.
Thank you.
75.2% of retail investor accounts lose money when trading CFDs with this provider. You should consider whether you understand how CFDs work and whether you can afford to take the high risk of losing your money. Past performance is not necessarily indicative of future results. The value of investments may fall as well as rise and the investor may not get back the amount initially invested. This content is not intended for nor applicable to residents of the UK. Cryptocurrency CFDs and spread bets are restricted in the UK for all retail clients.

BULLISH Tone for EURUSDEURUSD attempts to sell are still met with a rejection from buyers and at the same time buy attempts are slowed by sellers. Despite Powell changing his Hawkish stance, the dollar is held back by good GDP and traders already anticipate NFP growth which means Hawkish for the dollar. So this week if THE 1.17200 resistance zone holds the pair will likely retest deeper. Therefore, any better than expected NFP will be bad for Powell dovish remarks. ISM is expected to be out tomorrow and I am looking forward to more buy positions if it comes out lower than expected. Buys momentum seem to still be there. If NFP confirms buy we are likely to reach 1.18900 zone.

NAS100 - Stock Market, in the Work Week!The index is below the EMA200 and EMA50 on the four-hour time frame and is in its short-term descending channel. If this channel is maintained and the specified range is reached, a close sale can be made with a suitable reward.
Economists anticipate that customs tariffs will push consumer prices higher while slowing economic growth in the coming months. Inflation is expected to accelerate, though not to the extreme levels of the 1970s when the term “stagflation” was coined to describe the combination of high inflation and economic stagnation. Unlike a recession—where the economy contracts and prices fall—stagflation features rising prices despite economic weakness. The U.S. economy could be heading toward a 1970s-style stagflationary environment, though analysts believe this time it will be far less severe.
Many experts argue that the U.S. is on the verge of a period of sluggish growth paired with accelerating inflation. The root cause lies in President Donald Trump’s tariffs, which simultaneously raise consumer costs and weigh on the labor market. However, economists expect this inflationary wave to be much milder than the double-digit annual increases that strained household budgets in the 1970s.
On the corporate front, Nvidia released its second-quarter earnings last week. Revenue reached $46.7 billion, exceeding analysts’ expectations of $46.23 billion. The company’s data center unit—the main growth driver—generated $41.1 billion, slightly below the $41.29 billion forecast. Adjusted earnings per share came in at $1.05, while the adjusted gross margin stood at 72.7%.
Looking ahead, Nvidia projected third-quarter revenue of around $54 billion, with a margin of error of plus or minus 2%. Its board also approved an additional $60 billion share repurchase program. Regarding China, the company reported zero sales of H20 chips to Chinese clients during Q2 and stated that no shipments are planned for that market in the near future.
In the earnings call, CEO Jensen Huang emphasized that the Chinese market could present a $50 billion opportunity for Nvidia this year. He estimated annual growth in China at nearly 50%, noting that the country is the world’s second-largest computing market and home to half of global AI researchers. Huang stressed that maintaining a presence in China is vital for the company’s long-term future, even amid ongoing political and trade tensions between Washington and Beijing.
On the monetary policy side, UBS warned that weakening the independence of the Federal Reserve—especially following Trump’s threat to remove Fed board member Lisa Cook—could have significant economic consequences. In its analysis of Jerome Powell’s speech at the Jackson Hole symposium, UBS described it as “classic Powell”: hinting at the possibility of a September rate cut to offset tariff effects but lacking a broader long-term framework for the evolving economy.
UBS emphasized that failure to strongly defend Fed independence could heighten political risks and destabilize markets.The bank warned that if the central bank comes under political influence, potential outcomes include the reemergence of inflationary instability, a one-percentage-point increase in real borrowing costs, and negative effects on fiscal policy, corporate investment, housing affordability, household savings, and speculative activity.
This week begins with one fewer trading day due to the Labor Day holiday, yet the economic calendar remains packed, with the labor market at the center of attention. On Tuesday, the ISM Manufacturing PMI for August will be released, followed by the JOLTS job openings report on Wednesday.
Thursday will be particularly important, bringing the August ADP private payrolls report, weekly jobless claims, and the ISM Services Index—all at once. These data points are especially significant given the recent large revisions to the Nonfarm Payrolls (NFP) report, which have renewed focus on the degree of convergence or divergence between ADP and NFP figures.
Historically, ADP and NFP reports have often diverged, leaving traders mispositioned when relying too heavily on ADP data. A recent example occurred in July, when ADP reported a decline of 33,000 jobs, while NFP the following day showed a gain of 147,000—well above expectations of 110,000. However, after NFP revisions, the actual trend proved more consistent with ADP’s numbers.
The most important event of the week will take place on Friday: the release of the August U.S. Nonfarm Payrolls report. Investors will be monitoring it closely, as any signs of labor market weakness could reinforce expectations for a Fed rate cut in mid-September.
Despite growing stagflation risks and heightened market volatility, Bank of America (BofA) suggested that autumn could be an attractive entry point for bullish investors. The bank cautioned that while volatility may exert short-term downward pressure, potential pullbacks could serve as buying opportunities.
The VIX volatility index fell to its lowest level of the year following Powell’s dovish remarks at Jackson Hole. Still, concerns about stretched stock valuations, a potential AI-driven bubble, and political risks tied to Fed independence suggest that this calm may not last.
EUR/USD range and USD/CHF breakdown risk into payrollsIn a shortened US week, August jobs data will be the key event.
Nonfarm payrolls, the unemployment rate, wage growth, the ADP report, the JOLTS, and Challenger job cuts will all reveal whether the labour market continues the sharp slowdown seen in prior releases.
For Europe, attention will be on inflation prints from both the Eurozone and Switzerland, providing fresh direction for EUR- and CHF-linked pairs.
On the 4H chart, EUR/USD is trading around 1.1680, caught in a choppy sideways range. Price has repeatedly tested both support near 1.1640 and resistance. Strong jobs data could weigh on the pair and push it back below 1.1640, while weaker labour data may allow a breakout toward 1.1740–1.1780.
USD/CHF shows a rounding top pattern on the 4H timeframe, with price pressing the neckline near 0.8000. Sellers have steadily pushed lower highs since mid-August, and this pattern could hint at further downside momentum.

EURUSD: NFP and JOLTsThe most important macro data for the US economy posted during the previous week was related to GDP growth rate. As posted under the second estimate, the GDP Growth rate stands at 3,3% on a quarterly basis, which was higher from market expectations of 3,0%. The second important indicator was the PCE Index posted on Friday, which is Fed's favorite inflation gauge. As per posted data, the PCE was increased by 0,2% in July, bringing it to the level of 2,6% on a yearly basis. Both figures were in line with market forecasts. The Core PCE was standing at 0,3% in July. The Personal Income in July was increased by 0,4% on a monthly basis, while personal spending was higher by 0,5%.
As for other data posted for the US economy, the New Home Sales in July dropped by -0,6% for the month, which was lower from forecasted -1,1%. The Durable Goods Orders in July dropped by -2,8% compared to previous month, slightly lower from forecasted -2,5%. On the other hand, the Durable goods orders excluding transportation were higher by 1,1% in July, beating forecasted -0,4%. The CB Consumer Confidence was standing at 97,4 in August, a bit higher from market estimate of 96. The Pending home sales in July dropped by -0,4% for the month, above market estimate of -0,2%. Friday brought final figures for University of Michigan Consumer Sentiment, which closed the month at 58,2. The inflation expectation stands at 4,8%, and 3,5% for the period of next five years. Both figures were lower from market forecasts.
The Ifo Business Climate in Germany reached 89,0 in August, modestly above estimated 88,6. The GfK Consumer Confidence for September in Germany is standing at -23,6, slightly higher from market expectations of -21,3. The final Consumer Confidence for the Euro Zone ended August at -15,5, which was in line with the forecast. Retail Sales in Germany in July dropped by -1,5% on a monthly basis, which was significantly higher from forecasted -0,3%. Retail sales are still holding in a positive territory of 1,9% when compared to the previous year. The Unemployment rate in Germany in August was 6,3%, unchanged from the previous month. The inflation rate in Germany preliminary for August reached 0,1% for the month and 2,2% on a yearly basis.
Monday started with a strong correction of the eurusd currency pair from the level of 1,1720 down to 1,16 support. This level managed to sustain selling pressure, so the market reverted back toward the 1,1686, where the currency pair is closing the week. The RSI continues to oscillate around the level of 50 indicating that the market is still not ready to clearly decide on a trading side. At the same time, the MA50 continues to diverge from MA200, without any indication of a potential slowdown in the coming period.
For one more time since the start of August, the support level of 1,16 managed to resist the selling pressure. This is indication that currently, this level holds strong grounds. The reversal to the upside during the second half of the previous week indicates a high potential that the resistance at 1,17 might be tested at the start of the week ahead. At this moment on charts, there is no clear indication that 1,17 could be clearly breached toward the upside. It should be considered that two currently important macro indicators for the US economy, the NFP and JOLTs, will be posted in a week ahead. Any deviation of these figures from market expectations, might trigger the breach of the 1,17 level and the move toward the 1,18 as the next short term resistance. However, in case that there are no surprises, then there is equal probability that the market might revert for one more time back toward the 1,16 support.
Important news to watch during the week ahead are:
EUR: Unemployment rate in the Euro Zone in July, Inflation rate flash for August in the Euro Zone, Retail Sales in the Euro Zone in July,
USD: ISM Manufacturing PMI in August, JOLTs Job Openings in July, ISM Services PMI in August, Non-farm Payrolls in August, Unemployment rate in August

BTC 4H Analysis – Key Triggers Ahead | Day 27💀 Hey , how's it going ? Come over here — Satoshi got something for you !
⏰ We’re analyzing BTC on the 4-hour timeframe timeframe .
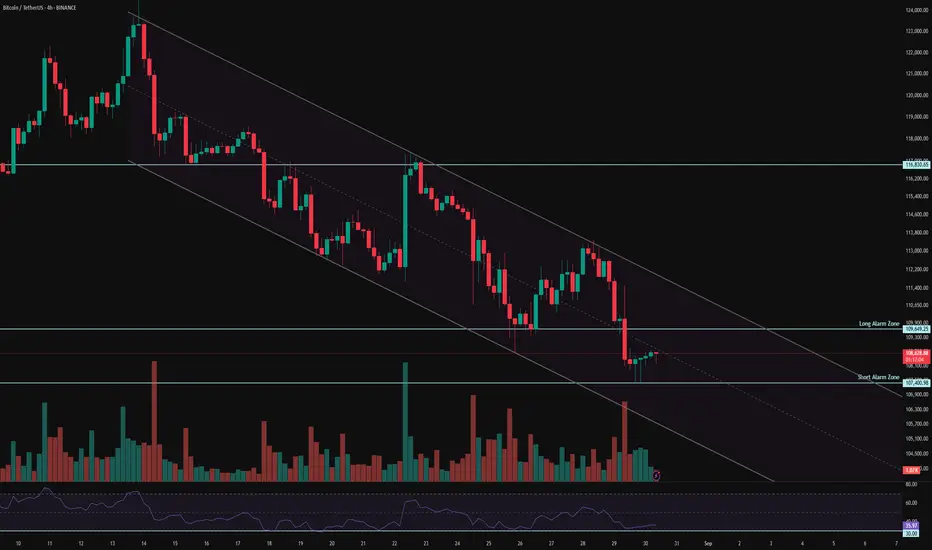
👀 In the 4-hour timeframe of Bitcoin, we can see that Bitcoin is moving inside a descending channel where each time it touches the top or bottom of the channel, it shows a reaction to these levels and then leaves a reversal move. Currently, Bitcoin has an important support at the 107,400 area, and if this level breaks, it can move towards its lower supports. On the other hand, there is a resistance at the 109,700$ area, and breaking this resistance could give us a long position.
⚙️ Our key RSI zone is at the 30 level, and the fluctuation is ranging above this level in a close environment. With an increase in volatility and selling pressure, if RSI passes below 30, it could be a confirmation for a deeper correction.
🎮 With a Fibonacci tool, we are going to identify Bitcoin’s key levels. The Fibonacci is drawn from the 117,000$ breakout area down to the 107,300$ support area. The price behavior at the 0 and 0.236 levels can help us for taking trades.
📊 In the 4-hour timeframe of Tether dominance, we can see that similar to Bitcoin but with an ascending difference, it is moving inside a channel. The 4.52% area is very important, as the midline of the channel is located here. In the previous leg of movement, it also reacted to this area and got rejected. Breaking this area could bring more selling pressure into the market and also on Bitcoin.
🕯 The size and volume of the red candles at the breakout zones are getting bigger, each time accompanied by higher selling volume. The presence of maker buyers is seen between the two highlighted zones. With an increase in Bitcoin’s volume, it can start its main trend. Keep in mind that we are in the holiday season.
🔔 The zones considered as alarm zones are the 107,400$ area and the 109,600$ area. The price action in these zones can help us with our trades. With an increase in Bitcoin’s volume, it could break one of these levels and move either up or down. Keep in mind that August has ended, and in the new month we have 3 important news events from the Federal Reserve, which could either bring strong inflows into the market or pull money out of it.
❤️ Disclaimer : This analysis is purely based on my personal opinion and I only trade if the stated triggers are activated .
NFPUSDT Forming Bullish PennantNFPNUSDT is showing a promising technical setup with the formation of a bullish pennant pattern, a classic continuation signal that often leads to strong upward momentum. After a strong upward leg, the price has entered a brief consolidation phase, creating a pennant structure that is now hinting at the possibility of a breakout. The market volume is supportive, which strengthens the bullish outlook and suggests that traders and investors are closely watching this move.
The expected gain for NFPNUSDT is projected between 40% to 50%+, which aligns with the measured move from the pennant formation. This makes the setup attractive for short to mid-term traders aiming to capitalize on breakout opportunities. If the breakout sustains with strong volume, the next resistance levels could be tested quickly, providing momentum-driven gains.
Investor interest in this project continues to grow, which could serve as a catalyst for further upside. With the combination of strong technical structure, solid volume, and increasing market participation, NFPNUSDT has the potential to see significant price appreciation in the coming sessions. Monitoring the breakout level will be key for traders looking to enter at optimal points.
✅ Show your support by hitting the like button and
✅ Leaving a comment below! (What is You opinion about this Coin)
Your feedback and engagement keep me inspired to share more insightful market analysis with you!

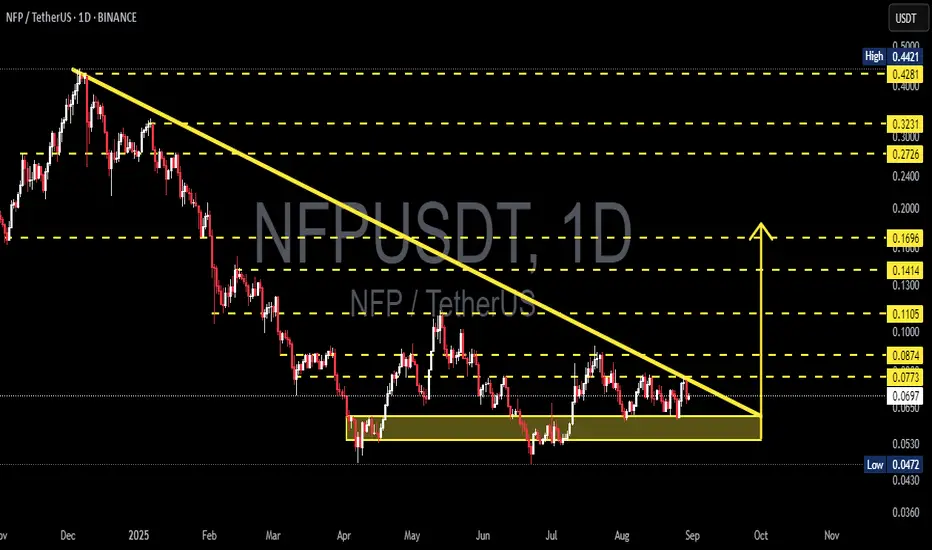
NFP/USDT — Descending Triangle, Watch for Breakout or Breakdown?The pair NFP/USDT is currently at a critical juncture. The chart shows a clear Descending Triangle pattern: a series of lower highs (seller pressure) aligned with a falling trendline, while a strong horizontal support zone around 0.047 – 0.062 continues to hold as buyers defend it.
Typically, this formation suggests a bearish continuation, but as the price approaches the triangle’s apex, the probability of a bullish breakout also rises if supported by strong volume. In other words, NFP is now in a “do or die” position — preparing for its next major move.
---
🔎 Technical Structure & Key Levels
Main Pattern: Descending Triangle → generally bearish bias, but breakout upside is possible.
Current Price: ~ 0.0697, very close to the apex, signaling an upcoming strong move.
Strong Support Zone: 0.047 – 0.062 (demand area repeatedly tested).
Key Resistance near trendline: 0.077 – 0.087 (bullish breakout confirmation zone).
Next Resistances: 0.1105, 0.1414, 0.1696, then 0.2726 – 0.3231, and 0.4421 (major historical resistance).
---
📈 Bullish Scenario — Breakout Potential
If NFP breaks above the descending trendline and closes a daily candle above 0.077 – 0.087 with strong volume, a medium-term reversal could be underway.
🎯 Short-term target: 0.1105
🎯 Next targets: 0.1414 – 0.1696
🎯 Extended targets: 0.2726 – 0.3231, up to 0.4421 if momentum sustains
🔑 Additional confirmation: successful retest of the breakout zone, proving buyer strength.
---
📉 Bearish Scenario — Breakdown Continuation
If price breaks below the strong support 0.0472, the descending triangle confirms as a bearish continuation pattern.
🎯 First target: 0.036 – 0.030 (next historical support zone).
🎯 Deeper targets possible if selling pressure accelerates.
🔑 Additional confirmation: failed retest of the broken support, turning into resistance.
---
⚖️ Key Takeaways
NFP/USDT is at a decision point. The descending triangle is tightening and a big move is near.
Bias: Slightly bearish due to the pattern, but bullish reversal remains possible with a breakout above 0.087 and strong volume.
Conservative traders: Wait for confirmation before entry. False breakouts/breakdowns are common without volume.
Risk management is crucial: set stop-loss below the support zone for longs, or above breakout levels for shorts.
---
As price approaches the apex of the triangle, volatility usually spikes. That means a decisive move is coming soon — either a breakout rally or a bearish continuation. For now, NFP/USDT is a must-watch: will buyers flip the script, or will sellers win the battle?
#NFP #NFPUSDT #Crypto #TechnicalAnalysis #DescendingTriangle #SupportResistance #Breakout #BearishOrBullish #CryptoTrading
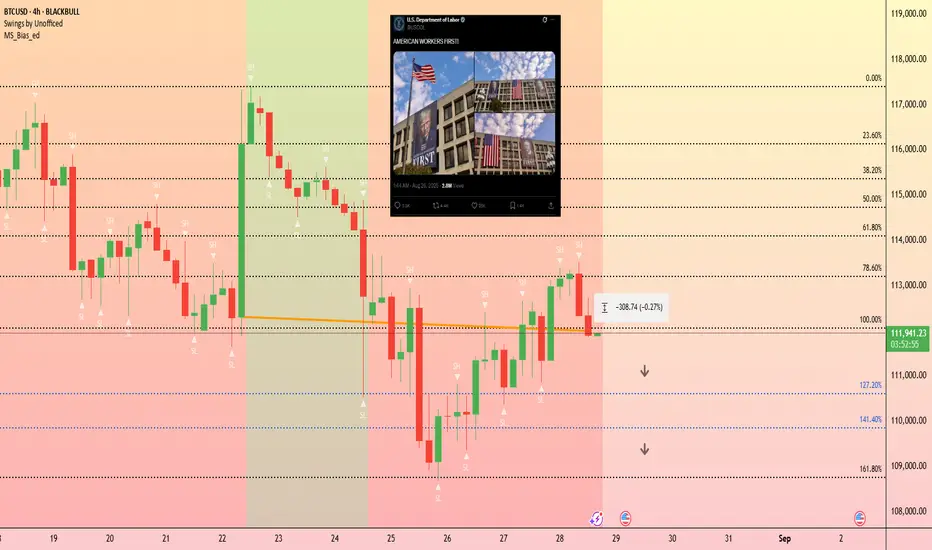
How Potentially Manipulated NFP Data Could Affect BTC's PricBitcoin rallied last Friday after Federal Reserve Chair Jerome Powell's prepped the market for an interest rate cut in September.
However, these gains have faded, with Bitcoin back to where it started last Friday; around $112,000.
The market's focus is now shifting to the upcoming U.S. Non-Farm Payroll (NFP) report, scheduled for release next week, which could greatly influence interest rates expectations.
Strong job data may reduce the likelihood of a September rate cut.
And with an Orwellian portrait of Trump now hanging from the Department of Labor Building, and his administration potentially pressuring the Bureau of Labor Statistics to inflate job numbers, this scenario is becoming a real possibility. If this happens, we could expect price action to test the lower Fibonacci retracement levels, such as the 141.4% at around $109,900 or further at $108,700.
USDJPY Rebound Faces 148.300 Resistance, Eyes on 146.900 Target!Hey Traders, In today's trading session we are monitoring USDJPY for a selling opportunity around 148.300 zone. USDJPY has been moving lower overall, with price currently correcting toward the 148.300 area.
Structure: The broader bias has been bearish, but recent price action is showing a short-term pullback.
Key level in focus: 148.300 — previously acted as support/resistance.
Next move: Rejecting this zone could resume the bearish move, with 146.900 as a potential target since it aligns with the partial trend and a key support area. A break above 148.300, however, would question the downside bias.
Monitoring how price reacts around 148.300 to see whether sellers regain control or if the correction deepens.
Trade safe,
Joe.
