Natural Gas Is Hibernating Ahead of an Upcoming SwingToday, we will discuss why natural gas is hibernating ahead of an upcoming swing. We will deep dive into:
1) the impact of inflation on commodity prices,
2) the technical outlook, covering both long-term and short-term perspectives, and
3) the fundamental confirmation of this view, based on the “Five Things to Watch in Energy Markets in 2026.”
Henry Hub Natural Gas Futures & Options
Ticker: NG
Minimum fluctuation:
0.001 per MMBtu = $10.00
Disclaimer:
• What presented here is not a recommendation, please consult your licensed broker.
• Our mission is to create lateral thinking skills for every investor and trader, knowing when to take a calculated risk with market uncertainty and a bolder risk when opportunity arises.
CME Real-time Market Data help identify trading set-ups in real-time and express my market views. If you have futures in your trading portfolio, you can check out on CME Group data plans available that suit your trading needs www.tradingview.com
NG

CRUDE OIL (CL) PREDICTIONCRUDE OIL (CL) PREDICTION
📊 Market Sentiment
Crude oil prices had been trending lower following signs of de-escalation in the Israel–Palestine conflict, easing tensions with Iran, and emerging peace signals from the Russia–Ukraine front.
However, recent statements from Trump and the possibility of a U.S. military action against Venezuela have shifted sentiment back to the upside.
Venezuela holds approximately 18% of the world’s proven oil reserves and ranks as the 12th largest oil producer globally. Any potential conflict involving the U.S. could significantly disrupt supply expectations, acting as a strong bullish catalyst for oil prices.
📈 Technical Analysis
CL swept monthly liquidity around the $55 level and has since shifted into a bullish structure on the daily timeframe.
In my view, this move indicates that price has gathered sufficient energy for either continuation higher or a controlled retracement before the next bullish leg.
📌 Prediction – Game Plan
I entered a long position at 56.24$.
🎯 TP1: 57.70$
I will take partial profits here and move the remaining position to breakeven.
🎯 TP2: 58.90$
🛑 Stop Loss: Daily close below 55.40$
💬 For deeper sentiment and strategy insights, subscribe to my Substack free access available.
This analysis is for educational purposes only and does not constitute financial advice. Always conduct your own research before trading or investing.

Natural Gas on January 26I expect to see short to 3$ at long term.
Nearly targets are 3.75 /3.5/ 3.2
Principal is simple if the SL reached we wanting until it's goes back at the price reached and open the same position. The direction is considered is only on Short scenario

Hitting prior highs…Ok so I’m thinking we break this top as a fake out for bulls to get momentarily trapped. We will break the high earlier this month then bulls will pile in, price will pullback over the next day or two then we will continue our way toward $5 and above. Major move happened last week and I think there may be some refuel and exhaustion at the start of the week. I started a short to scalp but will be closing it immediately upon profit. Looking to pile in and rebuy when this contract retraces to 4.6ish.

A lot happening…Greater uptrend channel still in tact. New downtrend channel in formation but will probably be negated due to the shifting 4 hour timeframe. I think this contract will settle around 4.5 at expiration and the next contract (Jan) will drop like a rock on the switch. I am buying shorts for Jan 4.7 and above. And buying longs for this contract anything below 4.3

Natural gas Near expiration, the spread between spots and future is about 1000 pounds, it may goes to ranges between 3.5-3 7. But near target is about 3 95

Natural Gas Market Outlook — September 01, 2025.VANTAGE:NG #NaturalGas #NatGas (NYMEX:NG1!) 🔵 Natural Gas Market Outlook — September 01, 2025.
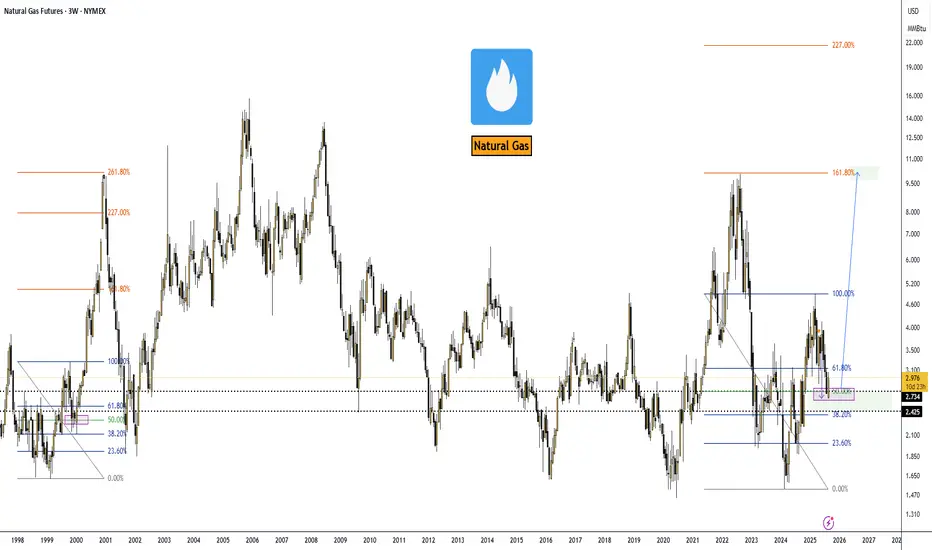
Alright, here’s the skinny on NatGas. Back on April 28, 2025, I was calling for a dip into the $2.74 zone—and guess what? We tagged it right on schedule.
Now the game flips: I’m hunting long entries with the first serious target sitting at $10.00.
Could we overshoot? Absolutely. If momentum really gets cooking, the Fibo 227% extension lines up at roughly $21.00. But let’s not get greedy yet—$10 stays the main milestone for the next big leg.
Macro Drivers
➖ Exports: LNG shipments are the elephant in the room. Europe’s still thirsty, Asia’s paying up, and U.S. cargos are cashing in.
➖ Production: Flat. Shale guys aren’t rushing to flood the market unless we break above $3.20+.
➖ Geopolitics: Russia’s LNG rerouting and Middle East jitters keep a bid under global gas.
➖ Utilities & Consumers: Domestic demand is softer thanks to renewables transitions, but that’s a sideshow compared to export flows.
Big Picture
EIA pegs Henry Hub at $3.60 in 2025 and $4.30 in 2026, but frankly, that’s conservative. With demand from data centers, electrification, and global LNG growth, upside is more likely than not.
Trade View
➡️ I’m treating $2.74 as the cycle low. Any dips near that level look like golden tickets for long positioning into 2026. First pit stop: $10.00. If bulls get rowdy, keep an eye on $21.00 as the stretch target.
➡️ Bottom line: NatGas just gave us the reset we were waiting for. From here, risk/reward favors the long side. Strap in—it’s gonna be a volatile ride, but that’s where the money gets made.
Natural Gas (NG) - Technical Analysis Report - 20250908Analysis Date: September 8, 2025
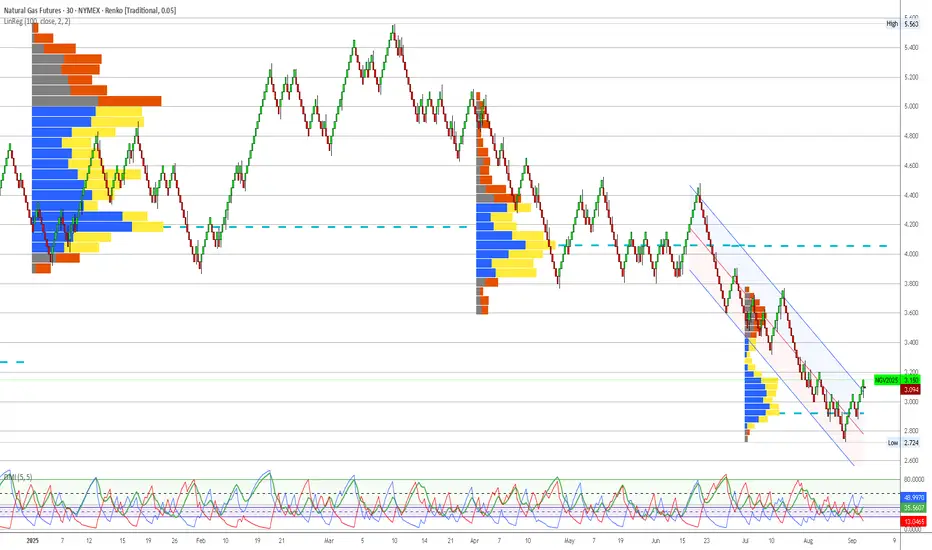
Current Price: $3.125
Market Session: Post-Market Analysis
---
Executive Summary
Natural Gas presents the highest conviction opportunity in the current market environment, with exceptional alignment between institutional positioning and technical momentum. The quarterly volume profile reveals massive institutional accumulation at current levels, while execution chart signals confirm a validated reversal pattern. This represents a classic institutional intelligence-based setup with superior risk/reward characteristics.
---
Quarterly Volume Profile Analysis
Institutional Positioning Intelligence
The quarterly volume profile (Q3 2025) displays the most compelling institutional accumulation pattern across all analyzed markets:
Primary Institutional Accumulation Zone: $2.90-$3.15
Extraordinary blue volume concentration representing massive institutional positioning
Current price ($3.125) sits in the optimal zone within this accumulation area
Volume density indicates sustained institutional commitment over extended period
Width and intensity of blue volume suggests major strategic positioning campaign
Volume Profile Architecture:
Core Accumulation: $3.00-$3.10 (heaviest institutional activity)
Extended Support: $2.90-$3.00 (secondary institutional positioning)
Breakout Level: $3.15-$3.20 (upper boundary of accumulation zone)
Void Zone: Below $2.85 (minimal institutional interest, evacuation territory)
Resistance Structure Analysis:
$3.25-$3.40: First institutional resistance with mixed volume
$3.60-$3.80: Moderate yellow volume indicating previous distribution
$4.00+: Historical distribution zones from earlier 2025 highs
Price Structure Context
Historical Pattern Recognition:
The current Natural Gas setup mirrors successful commodity reversal patterns, particularly the proven crude oil institutional accumulation model. The exceptional width and intensity of institutional volume at current levels suggests this represents a major strategic allocation by smart money participants.
Critical Structure Validation:
Institutional Floor: $2.90 represents absolute lower boundary of smart money positioning
Volume Point of Control: $3.05 shows peak institutional activity within accumulation zone
Conviction Level: Volume density indicates highest institutional commitment in analyzed market set
Risk Definition: Clear institutional boundaries provide precise risk management parameters
Seasonal and Fundamental Context
Seasonal Dynamics Supporting Institutional Positioning:
September-October: Transition into heating season demand
Storage injection season ending: Supply/demand dynamics shifting
Winter weather preparation: Industrial and residential demand increases
Power generation demand: Continued baseload electricity requirements
---
Execution Chart Technical Analysis
Current Technical Configuration - BULLISH ALIGNMENT
DEMA Analysis - CONFIRMED BULLISH SIGNAL:
Black Line (Fast DEMA 12): Currently at $3.14
Orange Line (Slow DEMA 20): Currently at $3.10
Configuration: Strong bullish crossover confirmed and expanding
Trend Bias: Technical momentum strongly bullish, aligned with institutional positioning
DMI/ADX Assessment - STRONG TRENDING CONDITIONS:
ADX Level: 44+ indicating powerful directional movement
+DI vs -DI: +DI clearly dominant over -DI
Momentum Direction: Confirming sustained bullish bias
Trend Strength: Exceptional ADX reading suggests institutional conviction
Stochastic Analysis - MOMENTUM CONFIRMATION:
Tactical Stochastic (5,3,3): Bullish configuration with room for extension
Strategic Stochastic (50,3,3): Confirming longer-term bullish momentum
Divergence Analysis: No negative divergences, clean momentum structure
Support and Resistance Levels
Immediate Technical Levels:
Current Support: $3.075 (DEMA 20 orange line)
Key Support: $3.00 (institutional accumulation core)
Major Support: $2.95 (institutional floor approach)
Immediate Resistance: $3.20 (accumulation zone breakout)
Key Resistance: $3.30 (first institutional resistance)
Major Resistance: $3.50 (significant distribution zone)
---
Trading Scenarios and Setup Criteria
Scenario 1: Continuation Long Setup (PRIMARY)
Optimal Conditions for Long Entry:
DEMA bullish maintenance: Black line remaining above orange line
DMI confirmation: +DI sustaining dominance over -DI
ADX persistence: Maintaining strong trending conditions above 40
Volume respect: Price holding above $3.00 institutional core
Momentum alignment: All timeframes confirming bullish bias
Entry Protocol:
Primary Entry: Current levels $3.10-$3.15 (within institutional accumulation)
Secondary Entry: $3.00-$3.05 on any pullback to core accumulation
Position Sizing: Full 2% account risk given exceptional setup quality
Stop Loss: Below $2.90 (institutional floor violation)
Profit Targets:
Target 1: $3.35 (first institutional resistance) - Take 40% profits
Target 2: $3.60 (major resistance zone) - Take 30% profits
Target 3: $3.80-$4.00 (distribution zone approach) - Trail remaining 30%
Scenario 2: Pullback Accumulation Setup (SECONDARY)
Conditions for Pullback Entry:
Price retracement to $3.00-$3.05 core accumulation zone
DEMA holding bullish configuration during pullback
Stochastic oversold providing tactical entry signal
Volume profile respect at institutional support levels
Pullback Setup Parameters:
Entry Range: $3.00-$3.05 (core institutional accumulation)
Stop Loss: Below $2.90 (institutional positioning violation)
Targets: Same as primary scenario with enhanced risk/reward
Position Sizing: Maximum allocation given superior entry point
Scenario 3: Breakout Acceleration Setup (AGGRESSIVE)
Breakout Trading Framework:
Breakout Level: Above $3.20 (accumulation zone upper boundary)
Volume Confirmation: Increased volume supporting breakout move
Technical Validation: DEMA gap expansion confirming momentum
Momentum Persistence: ADX remaining above 40 with +DI dominance
Breakout Parameters:
Entry: $3.22-$3.25 on confirmed breakout
Stop: Below $3.10 (failed breakout)
Accelerated Targets: $3.50, $3.75, $4.00+
Position Management: Trail stops using institutional levels
---
Risk Management Protocols
Position Sizing Guidelines
Aggressive Approach (Recommended for NG):
Maximum Risk: 2.5% of account (increased allocation due to exceptional setup quality)
Contract Calculation: Account Size × 0.025 ÷ (Stop Distance × $10)
Example: $100,000 account with $0.25 stop = 1,000 contracts maximum
Rationale: Highest conviction setup justifies maximum allocation
Stop Loss Hierarchy
Tactical Stop: $3.05 (execution chart support)
Strategic Stop: $2.95 (institutional accumulation boundary)
Emergency Stop: $2.85 (institutional floor violation)
Profit Management Framework
Systematic Profit Taking:
First Target (40%): Lock in profits at institutional resistance
Second Target (30%): Capture extended move through distribution zones
Final Position (30%): Trail for potential acceleration beyond $4.00
Trail Stop Method: Use $0.05 structure chart levels once in profit
---
Market Context and External Factors
Fundamental Catalysts Supporting Bullish Thesis
Supply/Demand Dynamics:
Storage levels approaching seasonal norms
Production discipline from major operators
Export capacity utilization supporting demand
Power generation baseload requirements
Seasonal Factors:
Heating season demand preparation (September-October)
Industrial consumption patterns shifting higher
Weather derivatives market positioning for winter volatility
LNG export commitments providing demand floor
Technical Market Structure
Commitment of Traders Alignment:
Commercial hedgers reducing short positions
Large speculators building long exposure
Small traders exhibiting contrarian pessimism (bullish indicator)
Open interest expansion confirming institutional participation
---
Monitoring Checklist and Alert Levels
Daily Monitoring Requirements
DEMA Configuration: Maintain bullish black above orange relationship
Institutional Respect: Confirm price behavior above $3.00 core zone
Volume Analysis: Monitor for any changes in accumulation patterns
External Events: EIA storage reports, weather forecasts, export data
Correlation Tracking: Monitor relationship with heating oil and power prices
Critical Alert Levels
Bullish Escalation Alerts:
Break above $3.20 with volume expansion
DEMA gap expansion indicating acceleration
+DI moving above 40 with ADX persistence above 50
Weather forecasts showing early cold patterns
Risk Management Alerts:
DEMA bearish crossover (black below orange)
Break below $3.00 institutional core support
ADX declining below 30 indicating momentum loss
Negative storage surprise significantly above expectations
---
Strategic Outlook and Conviction Assessment
Risk/Reward Analysis
Exceptional Setup Characteristics:
Risk: $0.25 to institutional floor ($2.90)
Reward: $0.50+ to first major resistance ($3.60+)
Risk/Reward Ratio: 2:1 minimum, potential 3:1+
Probability Assessment: High (75%+) based on institutional alignment
Portfolio Allocation Recommendation
Maximum Conviction Positioning
Natural Gas represents the highest quality setup in the current market environment. The exceptional alignment between institutional accumulation and technical momentum, combined with supportive seasonal factors, justifies maximum allocation within risk management parameters. This setup exemplifies institutional intelligence-based trading at its finest - clear smart money positioning validated by technical execution signals.
Allocation Framework:
Primary Portfolio Weight: 35-40% (maximum conviction)
Entry Method: Scaled entry over 2-3 trading sessions
Hold Period: Expect 2-6 week position duration
Exit Strategy: Systematic profit-taking at institutional resistance levels
---
Conclusion and Strategic Assessment
Natural Gas presents a textbook example of institutional intelligence confirmed by technical momentum. The massive quarterly accumulation zone, combined with validated execution chart signals, creates optimal conditions for systematic position building. Current positioning within the institutional sweet spot offers exceptional risk/reward characteristics with clearly defined parameters for both profit-taking and risk management.
Implementation Priority: Immediate action recommended - this setup quality rarely presents itself with such clear institutional validation and technical confirmation.
Next Review: Daily monitoring of DEMA configuration and institutional level respect
Position Management: Systematic profit-taking protocol with trailing stops at institutional levels
---
Important Disclaimer
Risk Warning and Educational Purpose Statement
This analysis is provided for educational and informational purposes only and does not constitute financial advice, investment recommendations, or trading signals. All trading and investment decisions are solely the responsibility of the individual trader or investor.
Key Risk Considerations:
Futures trading involves substantial risk of loss and is not suitable for all investors
Past performance does not guarantee future results
Market conditions can change rapidly, invalidating any analysis
Leverage can amplify both profits and losses significantly
Individual financial circumstances and risk tolerance vary greatly
Professional Guidance: Before making any trading decisions, consult with qualified financial advisors, conduct your own research, and ensure you fully understand the risks involved. Only trade with capital you can afford to lose.
Methodology Limitations: Volume profile analysis and technical indicators are tools for market assessment but are not infallible predictors of future price movement. Market dynamics include numerous variables that cannot be fully captured in any single analytical framework.
The views and analysis presented represent one interpretation of market data and should be considered alongside other forms of analysis and individual judgment.
Potential Decline of Natural Gas Prices to $2.43–$2.74Brief Overview of Events and News Explaining the Potential Decline of Natural Gas Prices to $2.43–$2.74.
➖ Weather Forecast and Reduced Demand
On April 23, 2025, the U.S. National Weather Service forecasted milder-than-average weather across the U.S. for late spring and early summer 2025, particularly in key gas-consuming regions like the Northeast and Midwest.
Warmer weather reduces the demand for heating, a primary driver of natural gas consumption. This led to a 2.5% decline in Henry Hub natural gas futures, settling at $3.05 per MMBtu on April 24, 2025.
Source: Reuters
➖ High U.S. Natural Gas Inventories
The U.S. Energy Information Administration (EIA) reported on April 17, 2025, that natural gas inventories increased by 75 billion cubic feet (Bcf) for the week ending April 11, 2025, significantly exceeding the five-year average build of 50 Bcf. Total U.S. inventories are now 20% above the five-year average, indicating an oversupply that pressures prices downward.
Source: EIA, "Weekly Natural Gas Storage Report," April 17, 2025
➖ Weak Global LNG Demand
On April 22, 2025, Bloomberg reported a decline in demand for liquefied natural gas (LNG) in Asia, particularly in China, due to an economic slowdown and a shift to cheaper coal alternatives. China’s LNG imports in Q1 2025 dropped 10% year-over-year, reducing export opportunities for U.S. gas producers and adding pressure on domestic prices.
Source: Bloomberg, "China’s LNG Imports Fall as Coal Use Rises," April 22, 2025
Technical Analysis
Natural gas futures (NYMEX) are currently around $3.15 per MMBtu as of April 28, 2025, following a recent decline from a peak of approximately $4.90 in 2025.
Fibonacci retracement levels indicate correction targets at 38.2% ($2.74) and 50% ($2.43).
Fundamental factors, such as oversupply and reduced demand, support a bearish scenario that could drive prices to these levels in the near term.
Nearest Entry Point Target:
• $2.74
Growth Potential:
Long-term:
• $10
Screenshot:


NATGAS Expected Growth! BUY!
My dear followers,
This is my opinion on the NATGAS next move:
The asset is approaching an important pivot point 3.541
Bias - Bullish
Safe Stop Loss - 3.373
Technical Indicators: Supper Trend generates a clear long signal while Pivot Point HL is currently determining the overall Bullish trend of the market.
Goal - 3.834
About Used Indicators:
For more efficient signals, super-trend is used in combination with other indicators like Pivot Points.
Disclosure: I am part of Trade Nation's Influencer program and receive a monthly fee for using their TradingView charts in my analysis.
———————————
WISH YOU ALL LUCK

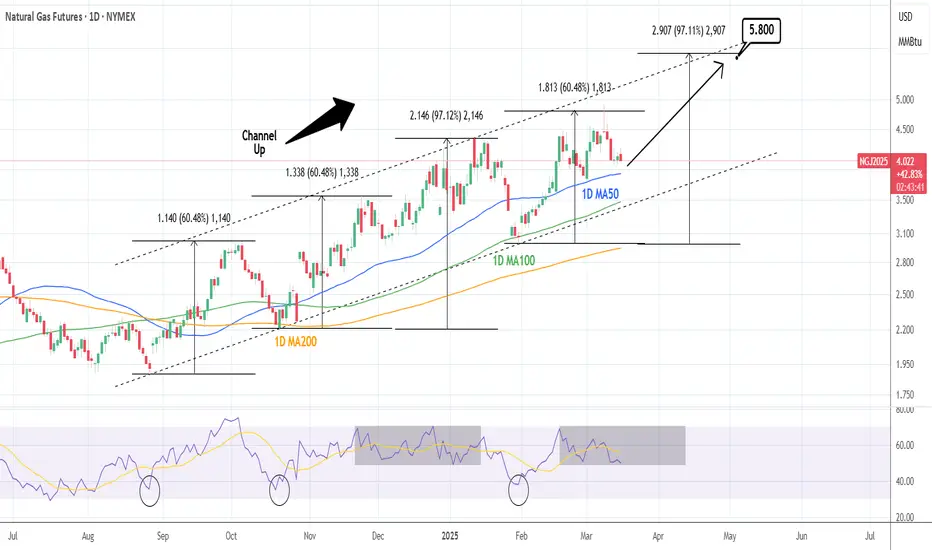
NATURAL GAS: One more technical push.Natural Gas is neutral on its 1D technical outlook (RSI = 49.489, MACD = 0.098, ADX = 23.222), which is the ideal buy opportunity inside its 8 month Channel Up, as long as the 1D MA100 holds. The last HH peaked at +97.12% before pulling back to the 1D MA100. The trade is long, TP = 5.800.
See how our prior idea has worked out:
## If you like our free content follow our profile to get more daily ideas. ##
## Comments and likes are greatly appreciated. ##
Natural Gas Shows Bullish PatternVANTAGE:NG Natural gas looks to be turning bullish after a projected five-wave impulse from the lows, followed by an ABC correction. It gave us a nice bullish setup formation by Elliott Wave theory, so more upside is in view, especially if breaks back above 4.0 bullish confirmation level, just watch out for short-term intraday pullbacks.


Natural gas long term projectionsOne of the most exciting assets around, who needs btc when you got NGAS,
Inverse HS, targets: 3.60$ / 5.60$
Mogalef weekly volatility bands seem to have been useful in the past predicting supports and resistances, top band matches the inverted HS target as well.

NatGAS is heating upA close above the white Center-Line projects higher prices to come.
There are 2 scenarios I see:
1. pull-back to the white CL, then up.
2. cross above the petrol CL, further and fast continuation to the north.
...oh, there's 3rd scenario:
3. price is getting punched back below the white Center-Line again. If that comes true, price has another chance to go south, with a target at the 1/4 line, or even way down to the L-MLH.

Copper breached the supportThe L-MLH is a most likely support.
This support is breached in Copper, and a fllow through would indicate way lower prices.
What I really like in this Chart is the tiny pullback to the L-MLH, since this is totally expected after a breach of it.
Arrows mark potential targets.

NG. - Long: bull flag breakout NG. has formed a bull flag with a falling parallel channel and is about to breakout. Bull flag is a continuation pattern so woith complete formation of bull flag, expected price target is 1230 which 24% profit from current price.
If we connect two highest points on a weekly point, they coincide with the same price target of 1230, completing formation of a bull flag.
Price is also above SMA200.
If price retraces back to lower parallel channel trendline, this would be a good add level as there is strong support zone in Weekly timeframe
Enter: Current Market Price
SL: 930
TP: 1230
R/R: 1:3.89

NG, prepping for a multi weekly gain come December 2023NG based on monthly data is registering very significant net buy volume at the current price range.
Seller's strength is certainly fading out based on thinning price volatility this past few days / weeks -- as shown on yellow price lines on chart.
NG is currently sitting at a strong major support at 2.0 to 2.5 area, a 1.0 FIB discount level -- this is where most buyers converge.
Initial trend shift has been spotted at the present price range.
Spotted at 2.50
TAYOR
Safeguard capital always.

Smart Money's Secret Signal - Commercials Loading Up on NattySmart Money's Secret Signal: Commercial Traders Are Loading Up on Natural Gas
The natural gas market is displaying compelling signals that suggest a potentially significant bullish trend change on the horizon. Through careful analysis of the Commitment of Traders (COT) report and several other key market indicators, we're seeing a convergence of bullish factors that warrant close attention from market participants.
Commercial Positioning at Multi-Year Extremes
Perhaps the most significant indicator is the current positioning of commercial traders, who are now more long than they've been in over three years. Commercial traders, often considered the "smart money" in commodity markets, tend to have the most comprehensive understanding of supply and demand dynamics. Their extreme long positioning is a powerful bullish signal that shouldn't be ignored.
Open Interest Analysis Confirms Bullish Outlook
Recent weeks have shown a notable increase in open interest concurrent with price declines. This relationship between price and open interest becomes particularly meaningful when we examine who's driving the increase of OI. In this case, the increase in open interest is primarily attributed to commercial traders building long positions – a highly bullish indication that suggests strong hands are accumulating positions at current price levels.
Contrarian Indicators Support the Bullish Case
Several contrarian indicators are aligning to support the bullish thesis:
-Investment advisor sentiment is currently very bearish, which historically has been a reliable contrarian indicator.
-Small speculators are showing extreme short positioning, and this group tends to be wrong at market extremes.
-Natural gas is undervalued when compared to historical relationships with gold and U.S. Treasuries.
Technical Confirmation Signals
The technical picture is adding weight to the bullish case:
-The Average Directional Index (ADX) has triggered a buy signal, dropping below 20 while commercials shifted to extreme long positioning.
-A bullish spread divergence has emerged between front-month and second-month contracts, implying immediate commercial demand for the front month, which is bullish.
-A major weekly bullish divergence has recently confirmed, suggesting potential for significantly higher prices.
Market Structure and Timing
While these indicators paint a compelling picture for higher natural gas prices, it's crucial to understand that this analysis doesn't necessarily call for immediate long positioning. Rather, it suggests that the market is fundamentally "setting up" for an upward move. Traders should wait for confirmation through a daily bullish trend change before considering positions.
The Power of COT Analysis in Trading
The Commitment of Traders report remains one of the most powerful yet underutilized tools in market analysis. Understanding how to interpret this data, particularly when combined with other technical and fundamental indicators, can provide traders with a significant edge in the markets. While many traders focus solely on price action or technical indicators, the COT report offers unique insights into the positioning of the market's most informed participants.
Ready to master the art of COT analysis and gain access to professional-grade market insights? Reach out to us today to take your trading to the next level.
Risk Disclaimer
IMPORTANT: The analysis provided in this article is for educational and informational purposes only and should not be construed as investment advice or a recommendation to buy or sell any security or derivative. Trading natural gas futures, options, or any other financial instruments involves substantial risk of loss and is not suitable for all investors. The market analysis presented here represents the opinion of the author based on the data available at the time of writing, but markets are dynamic and can change rapidly.
Past performance is not indicative of future results. The indicators and analysis techniques discussed in this article may not work in all market conditions and should not be relied upon as the sole basis for any investment decision. Before trading, you should carefully consider your investment objectives, level of experience, and risk appetite. You should only trade with money you can afford to lose.
It is strongly recommended that you conduct your own research and due diligence before making any investment decisions. You should also consult with a licensed financial advisor or broker regarding your specific situation. The author and the trading community mentioned may have positions in the securities discussed and may trade in these securities at any time.

Natural Gas is Ready For a Commercially Driven Bull MoveNatural gas is nicely setup for longs if we get a confirmed bullish trend change on the daily.
-Extreme commercial long positioning (most long they've been in the last 3 years) - bullish.
-Investment advisor sentiment very bearish - which is actually bullish.
-Undervalued vs gold & treasuries - bullish.
-ADX under 40 while commercials got extremely long - bullish.
-Bullish spread divergence between front month and next month out - bullish.
-Small specs at extreme in short positioning - bullish.
-True seasonal & some cycles are not supportive of going long, but these are the last things I look at. Enough indicators are supporting longs that I'm not going to worry about this.
-Bullish momentum divergence has triggered on some high timeframes, implying much higher prices are on the cards for Natty. There is also some smaller bullish weekly divergence currently setup (but not confirmed).
Have a good week.

NGAS cup and handle / inverse HSForming a bullish inverse HS, or a cup and handle. If the trend line is finally broken, PT 3.50$ and 4.20$ in the horizon, NGAS usually spikes around year end due to increasing storage

NATURAL GAS: Peak reversal. Strong sell signal.Natural Gas is about to turned neutral on its 1D technical outlook (RSI = 58.678, MACD = 0.175, ADX = 30.811), previously from an overbough state, as it made a standard LH rejection at the top of a year long Triangle pattern. The 1D RSI peaked like all prior LH, the 1D MACD is forming a Bearish Cross (again like all prior LH), so we have a prime sell signal in our hands. Common target on all was the 1.786 Fibonacci extension (TP = 2.165).
## If you like our free content follow our profile to get more daily ideas. ##
## Comments and likes are greatly appreciated. ##
