The trend says all "BUY"GOOD EVENING
There is no doubt with the war between Russia and Ukraine, the price of fuel and gas will rise to a level we have never seen before, in addition to all candles and the resistance line that I drew before has been broken. so it's a good time to buy now especially since there is no indication that this crisis will end soon
business is a business that.
so open your wallets it's a chance for you
GOOD LUCK
Ng!

NATURAL GAS MARKET OVERVIEWOur idea is we are in a late stage of wave 2 development. Bottom line, we are bullish for wave 3 after wave 2 completion. -- Pengiran

Natural Gas - Elliott Wave AnalysisExpecting a retracement then moving higher for Wave iii of Wave (iii) - Pengiran

Natural Gas - Lower to complete wave c of wave (ii).Expecting price to move lower to complete wave c of (ii). 3.536 served as our invalidation level for this idea. Moving above 4.390 will strengthen this idea and indicate that early-stage development of wave (iii) is in progress. -- Pengiran

cup and handle pattern - Natural gas - Day tfspotted a cup and handle pattern on the daily chart, which explains why bullish support trendline on weekly tf still hold, and it can potentially back to the top (October high). The fundamental point of view also supports the technical analysis with Russia, US and Ukraine going on. I think this makes perfect sense - and from there we might never see 3.5 again this year :)

NLong

Natgas Weekly TFMy bet would be up, I am eyeing the October high ($5.7 -$6.4), as the weekly trend line holds and possibly test the high again. my analysis is based on technical analysis only no fundamental (as the market make no sense)
N

Natural Gas LONG Natural Gas LONG
Analysis based on pure technical - trend line analysis - Fib retracement (power of Fibonacci Retracement , so we can use as like our advantage in the future), I think now patience is the essential key as always. It is about understanding FLOW (flow of markets) and following the news (swing trading)

NATURAL GAS SHORT TERM VIEW 1 Week 1. trade as per levels with strict stop loss will bounce bck from Volumetric mean positions
======================
LIKE IF YOU AGREE
======================

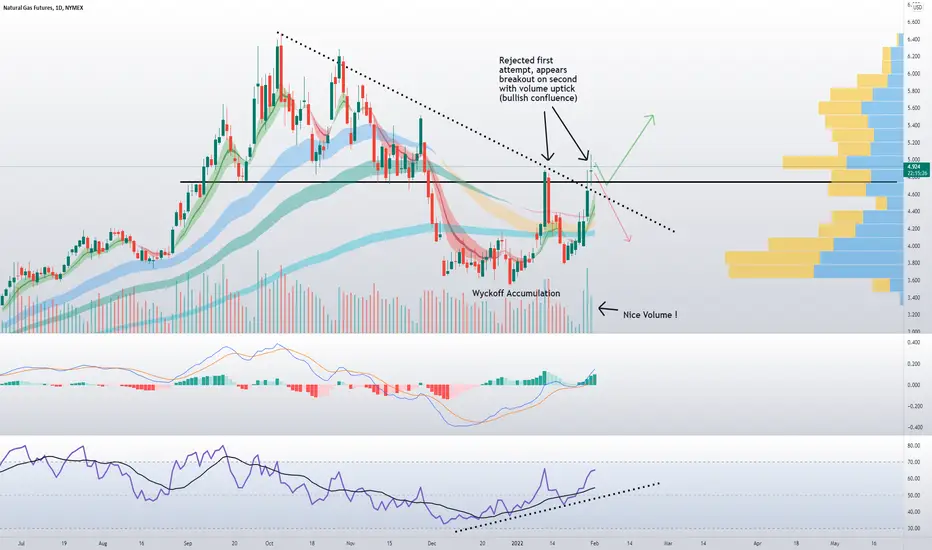
$BOIL NG LongNatural Gas appears to be breaking out of a classic Wyckoff Accumulation pattern and has now accelerated through overhead trend line resistance.
Good Volume uptick
Bullish RSI Confluence
Positive MACD
I'm Long BOIL shares as a sister trade, holding for more upside.
Expecting an RSI cool off, but as long as price stays above green EMA cloud, I'm bullish on this trade.
NATURAL GAS 1D Death Cross ahead. Lower Lows expected.It was last September (2021) where I first starting calling for a market top on Natural Gas, which at the time seemed odd to the majority of the energy market participants as it was coming off a very aggressive 6 month rally. It wasn't odd though based on NG's long-term, multi-year cyclical behavior as I accurately displayed on the following chart:
Back to today, and the 1D time-frame, the price is about to form a 1D Death Cross, which happens when the 1D MA50 (blue trend-line) crosses below the 1D MA200 (orange trend-line) and is considered to be a bearish formation. The last 1D Death Cross after a Cycle Top was formed on February 21 2019. It was on that period that NG made a new Low and gradually entered a structured bearish pattern on Lower Lows (Channel Down ish), with the 1D MA50 acting as Resistance. Check also the MACD indicator which is virtually identical between those two periods.
My long-term targets are the 1.236, 1.5 and 1.618 Fibonacci extensions successively, which were the Lower Lows targets of the 2019 pattern.
--------------------------------------------------------------------------------------------------------
** Please support this idea with your likes and comments, it is the best way to keep it relevant and support me. **
--------------------------------------------------------------------------------------------------------

Natural Gas SHORTNatural Gas SHORT
Analysis based on pure technical - trend line analysis - Fib retracement (power of Fibonacci Retracement , so we can use as like our advantage in the future), I think now patience is the essential key as always. It is about understanding FLOW (flow of markets)

Natural Gas - Bullish Month Ahead - BUYNatural Gas Will See An Increase In Purchasing Volume Due To High Demand.
Push It Up ^
CURRENCYCOM:NATURALGAS
CAPITALCOM:NATURALGAS
MCX:NATURALGAS1!
MCX:NATURALGAS2!
AMEX:BOIL
AMEX:UNG
SKILLING:NATGAS
MOEX:NG1!
MOEX:NG2!
MOEX:NGF2022
NYMEX:NG1!
MOEX:NG2!
MOEX:NGF2022
AMEX:FCG
GLOBALPRIME:XNGUSD
PEPPERSTONE:NATGAS
NYMEX:TTF1!
NYMEX:TTF2!
NYMEX:TTFG2022
NYMEX:TTFH2022
FXOPEN:XNGUSD
Guaranteed Buy
NLong

Elliott Wave View: Natural Gas (NG) Near The End of CorrectionElliott Wave View in Natural Gas (NG) suggests it is correcting cycle from June 22, 2020 low in larger degree 3, 7, or 11 swing. The decline is unfolding as a flat elliott wave structure. Down from October 6, 2021 peak (6.47), wave ((A)) ended at 4.825 and rally in wave ((B)) ended at 6.291. Wave ((C)) lower is in progress as a 5 waves impulse. The 1 hour chart below shows wave (3) of ((C)) ended at 3.617. Wave (4) of ((C)) bounce ended at 4.261 as an expanded flat structure.
Up from wave (3), wave A ended at 4.041, and pullback in wave B ended at 3.599. Wave C higher ended at 4.261 which also completed wave (4). The commodity has extended lower in wave (5) with internal subdivision as an impulse. Down from wave (4), wave ((i)) ended at 4.045 and wave ((ii)) ended at 4.181. Near term, expect rally to fail in 3, 7, or 11 swing as far as pivot at 4.261 high stays intact for further downside. Once the 5 waves down from wave (4) high is complete, it could either complete wave 1 of (5), or it could end the entire wave (5).

KOLD - Our Biggest Bet YetWhat is KOLD?
KOLD is 2x bear Natural Gas ETF that moves based on the price of Natural Gas futures.
Natural Gas futures shot up to insane levels this year, and we believe that natural gas prices will drop very quickly.
Natural gas futures usually rally 3-4 months before winter starts.
This is because energy providers across the world are trying to price in a good deal for when the winter season comes.
Now that winter is here and will be over quickly due to global warming, Natural Gas prices are dropping fast.
Making KOLD gain quickly.
We've been buying KOLD since it was $7, and slowly adding in at $8,$11,$12.
We will be adding more as this is one of our biggest positions.

The Natural Gas Dip is for BuyingI do not usually trade these types of assets but I figured I would take advantage of the volatility to buy some short-term dips and sell the recoveries. Extremely oversold and waiting for a retest on Fibonacci levels.

NATURAL GASNG is approaching a support zone. If the support zone hold, NG could rocket to $7 handle next.

Natural Gas is wanna ready to big move to $6 Natural Gas can reach to $3.1 in coming week , then a correction to $2.8- $ 2.9 is possible
and is ready to break big Resistance $3.1 to $6 in 6 month .
%100 profit in 6 month is not bad :-)
NLong

NATURAL GAS The top is in. But how low can it go?Exactly two months ago by making use of Natural Gas' clear long-term cycles, I called for a potential Top of the current Cycle after the formation of a Golden Cross on the 1W time-frame:
Even though the price rose a bit more, the peak was made shortly after. This time I am narrowing the horizon to 5-6 years and as you see the Cycle's peak was made exactly on the Higher Highs trend-line that started after the December 2016 High. An important technical development is that the 1W MACD made a Bearish Cross, which when formed on that Higher Highs trend-line, is a Top. Even though on a multi-year basis, the technical outlook has Natural Gas going as low as the Support Zone, on the less long-term, it may follow a consolidation phase as in 2017.
A long-term startegy for a cyclical investor would be to sell every rebound as the current one and gain from such swings on a 1-2 year horizon. In 2017/2018 it was only when the 0.618 Fibonacci retracement level broke, that NG broke down towards the Support Zone. So in such strategy long-term traders may resume selling once the current 0.618 Fib breaks (3.374) towards the Support Zone.
--------------------------------------------------------------------------------------------------------
** Please support this idea with your likes and comments, it is the best way to keep it relevant and support me. **
--------------------------------------------------------------------------------------------------------

Natural Gas - LongsPrice tapped major demand zone, i'm expecting Bullish move. i'm not expert in Natural Gas Trading, this is my first analysis in NG after long time. Hence look for the proper confirmation before trade

ng buyThe world is demanding energy for an economic recovery and a winter in Europe.
Natural gas prices have been rising in recent months, due to the great demand for various factors, including the search for and implementation of cleaner energies, in this process some countries such as China are entering a stage of de-carbonization, In China's attempt to gradually reduce the use of coal, natural gas is becoming more in demand, the key factor behind the rise in natural gas prices is its demand, the European Union is also stopping the use of coal and needs to supply This energy need with other means, until generating a dependence on natural gas, this benefits Russia a lot since they are one of the largest gas producers and as in OPEC they can manipulate the supply, in some geopolitical scenarios it would benefit them to pressure the European Union in certain gas pipeline projects.

Price is moving high to a very solid resistanceprice is moving high to a very solid resistance which was the highest price before
