NATURAL GAS Buy SignalPattern: Bullish Megaphone on 1D.
Signal: Bullish as the price bounced off the bullish trend-line. The 1D RSI is on an ascending Channel since February, indication that the bullish trend is getting stronger.
Target: 2.050 (Resistance).
** Please support this idea with your likes and comments, it is the best way to keep it relevant and support me. **
NG

$UGAZ: Natural Gas NG is Looking for DirectionNatural Gas July futures NG gapped up on the open from $1.63 to $1.75, but then dropped to $1.71. 2 Hr MACD chart crossed forming some sort of consolidation zone. NG is trading higher July contracts.
The fundamentals remain bearish: oversupplied condition vs. low demand. For the next two weeks, the weather is not expected to be hot enough to generate substantial demand. Although, the economy is re-opening, we may remain in oversupplied territory at least until June. The US natural gas rig count fell only by 1 (EIA), meaning production is still high.
UGAZ: A divergence between price and momentum has been observed on the 2 Hr chart, pointing toward near-term higher prices, or consolidation. RSI is in oversold territory. A near-term resistance for UGAZ is seen at $19-$21 level. NG showed nearest resistance at $1.75. If we can break through this level, then the price can go higher toward $1.8-$2.0. That may bring UGAZ to $25-$27 level, if natural gas prices rebound sharply during this week. Otherwise, lower levels should be expected. If NG stays low for the next 2-3 weeks, UGAZ may drift down into $8-$12 range.
The pattern emerging on NG 4 hr chart is reminiscent of the consolidation period between 3/16 and 3/30. New lows are still possible before we go higher.
As we are approaching a high cooling demand summer period and re-opening of the economy, natural gas demand is expected to rise, although, gradually. Without sharp rise in demand, or sharp decline in supply, NG prices will remain capped.

UGAZ: Bounced, But Still Forming a BottomNG: Natural Gas June futures rallied on Thursday into EIA report, which showed in-line storage build of $103 bcf. Natural gas stocks were 799 bcf higher than this time last year. The fundamentals remain on the bearish side with low consumption and warming weather. However, the economy is reopening, which is a bullish factor.
NG chart dipped after reaching nearest resistance at $1.7 level, still within existing downward trend. Short-term support was found at $1.66. The chart appears to be forming a bottom, bouncing off oversold condition observed earlier on 4 Hr chart. Short-term momentum is positive, medium-term momentum is negative pointing toward consolidation, or lower prices. Support is seen at $1.6, resistance at $1.85.
UGAZ: Based on Daily charts MACD, Chande Momentum, and CCI, a definitive bottom has not been formed yet. No divergences between momentum and price, similar to the pattern observed in late March, have been observed at this time. However, 4 Hr RSI chart (not listed here) showed a bottoming pattern at $1.6 NG level. For UGAZ, a level around $16 may hold as support, as long as NG price stays above $1.65 level. Otherwise, $15 handle may correspond to $1.6 level on NG chart.

UGAZ: Still Looking for a Bottom - UpdateNatural gas futures contracts NG has drifted lower on Wednesday reaching $1.6 with corresponding UGAZ price at $15.27. The NG chart moved a little higher from there trying to establish a bottom. Should we not hold $1.6 level, the next possible level of support is $1.5. In that case, UGAZ may go lower toward $13 handle. Near-term resistance is seen at $1.8 and $1.87.
Short term momentum is negative. The fundamentals are still bearish ahead of EIA report, as total consumption per day is expected to decline by 3.9% from 2019 average. Thursday report - 103 bcf build is expected.

UGAZ: Looking for a Bottom? Natural gas futures contracts moved lower this week on low demand due to ongoing COVID lockdowns and warming weather. Support seen earlier at $1.72, has been broken. Next possible levels of support are $1.6 and $1.5. Another triple digit injection of around 104 bcf is expected on Thursday (EIA report). Supply-Demand deficit is expected to narrow: April -6.64 bcf/d; May -0.3 bcf/d; June - 1.99 bcf/d. Consumption growth is projected to keep slowing down: April +7.7%; May +0.3%; Jun +0.05% YoY (BlueGold Research). Supply is still stronger than demand in the near-term, unless companies will start filing bankruptcies.
MACD crossover for UGAZ on 2 Hr chart is pointing toward lower prices. If NG prices are to drop to $1.5, a bottoming pattern for UGAZ may form this week at around $17 -$15 levels. NG futures are oversold on 4 Hr chart, but may continue sliding on a daily chart. We may see a recovery after Thursday EIA report, once all the news is priced in.


NATURAL GAS Buy SignalPattern: 1-month Channel Up
Signal: Bullish once the MACD turns bullish within the Triangle. Potential rebound zone as seen on chart.
Target: 2.030 (Resistance 1).
** Please support this idea with your likes and comments, it is the best way to keep it relevant and support me. **


Strong Bearish downside Target 200-33 points weekly BASE#NG Gas
Last some week Pirce sideways and fake break, Currently price hit long term downside trend resistance.
Next, some month now Demand of Gas VERY LOW as Summer period starts, we will see come next week Price go back 1.510$ support
🛑SUPPORT/RESISTANCE
✅S1= 1.725
✅S2=1.510
✴️R1=1.840
✴️R2=1.920
Please like, share, comments and follow me to get daily base analysis
Thank you for your support, I appreciate it.

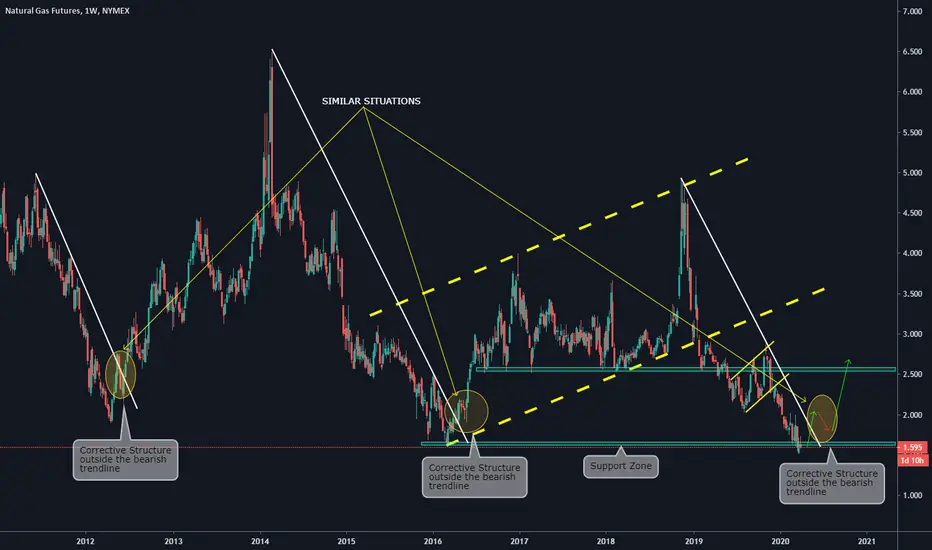
Weekly Chart on Natural Gas (NG) by ThinkingAntsOkUse this as a guide to develop your view of the situation.
Main items we can see on the Weekly Chart:
a) Take a look at the 2 previous descending trendlines (white) in the past
b) Observe how in both of them the price broke the descending trendline and after that, a corrective movement came
c) That corrective movement took about 3 to 5 weeks to be ready
d) After that, the beginning of a huge bullish movement started again
e) Currently, we think we are in the phase where the price is breaking the descending trendline, now we have to wait for more candlesticks to come before setting orders.

Natural Gas Storage Data Shows Build of 43bcf For the Week- This week has seen the Natural Gas Storage Data post a build of 43bcf for the week.
- This is slightly lower than last weeks numbers, however, is still recorded as a build for the week.
- This is now the 3rd consecutive build we have seen

NG 2 two point 3Looking for follow through to the macro fib retracement (2016-2018) @ 2.3 by Summer.
By Winter, stay tuned.

Weekly Analysis of NatGas by ThinkingAntsOkUse this as a guide to develop your view of the chart.
Main items we can see on the Weekly Chart:
a) The price is on a significant Support Zone
b) We can see two similar situations on the past that can work as filters
c) Those situations had in common the next steps: Broken Descending Trendline + Corrective Structure
d) We will be waiting for a similar situation now
e) Our Macro Target will be 2.6

Novagold $NGNew high is for #Novagold today but #rsi is still weak and may pull back on next week before it continues.

NATURAL GAS Trading opportunitiesPattern: Channel Down with underlying Bearish Megaphone on 1D.
Signal: (A) Bearish if the price breaks the MA50 (blue line), (B) Bullish if the price breaks above the red Triangle.
Target: (A) 1.500 (just above the Support), (B) 2.140 (projected contact with the MA200 (orange line)).
Previous successful Buy Signal on Natural Gas:

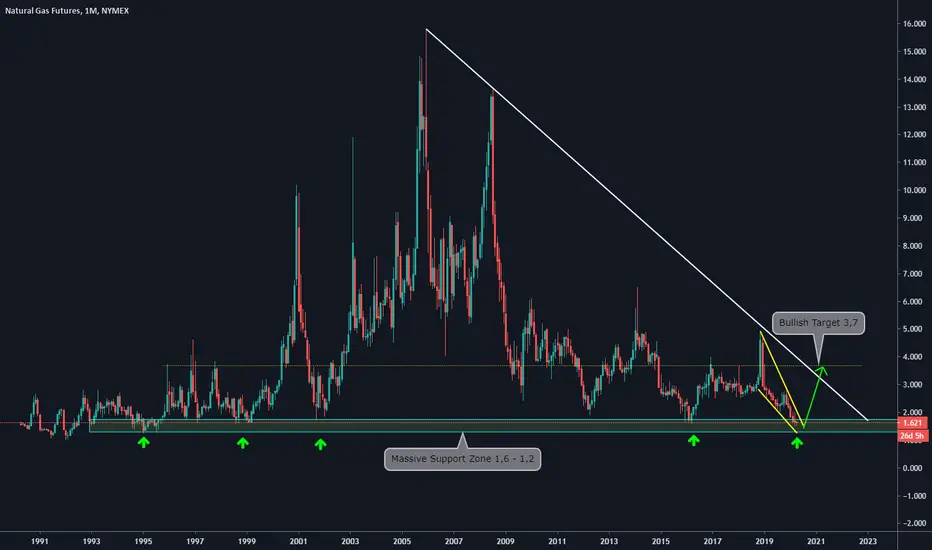
Massive Support zone on NATGAS by ThinkingAntsOkUse this as a guide to develop your view of the chart
Main items we can see on the Monthly Chart:
a) There is a massive Support zone between 1,6 - 1,2
b) This Support has been working since 1992
c) Currently, the price is on 1,6 / The first contact with the support zone
d) We think the price will make reversal structures before starting the bullish movement
e) This Monthly chart provides us with an idea of a bullish potential of 120% towards the next Resistance zone at 3,7
What we are expecting on NATGAS by ThinkingAnts Use this as a guide to develop your view.
Main items we can see on the weekly chart:
a) The price is on a significant support zone
b) We expect a reversal movement based on the previous situations
c) If the price goes up respecting previous structures that happened on the past, these are what we will be waiting
-Breakout of the descending trendline
-Corrective structure of 3 weeks at least, above the broken trendline or on its edge
-Our Target for the bullish movement will be the next resistance zone at 2.5
NATURAL GAS Buy SignalPattern: Channel Down on 1D.
Signal: Bullish once the MACD makes the bullish cross.
Target: 1.700 (projected +15% rise from the low).
Previous signal:

UGAZ Performance During 2012 and 2016 RalliesThis is a continuation of my 2020 bull rally theory, finding the best way of capitalizing on the potential opportunity in front of us is the next step.
UGAZ did not perform well long term during the bull rallies of 2012 and 2016, substantial gains were seen initially but the decay and volatility prevent this product from having long term gains. After the initial natural gas high the following heating season decay really took its toll on this product, with new lows before the final monthly cycle high. 2016 is substantially worse due to the extended time from the high in 2016 till the monthly cycle high in 2018.
UGAZ does present a opportunity for swing trading as can be seen by the substantial moves over 4-6 week periods. The daily cycle can like be used to swing trade UGAZ.
Leveraged ETN's are not designed to be held long term so these result do not surprise me. There are many things working against UGAZ, futures decay, futures contago, borrowing fees, rebalancing fees, rebalancing volatility.
This product should not be used by novice investors!!!


NatGas probably already bottomed1.753 set on Feb. 11 is probably a major long-term bottom. Historically, #natgas has tended to bottom out in the week ending Feb. 21
bluegoldresearch.com

Top and Bottom analysis on Natural Gas (NG) by ThinkingAntsOkUse this as a guide to develop your view on the Chart.
Main Items we can see on the 4hs Chart:
a)After the breakout of the Massive corrective structure, we saw the beginning of a new bearish motive wave
b)Our main target for the end of the bearish trend is the Daily Support zone at 1.650
c)The main structure for the down move is a descending channel, is very important to pay attention to it and see if the price keeps respecting it.
d)If you have a short position opened the support zone can be an excellent target
e)If you want to open Long positions, wait for the price to reach the support zone, and give at least one week to see a formation there.
Daily Chart
