Nifty Analysis EOD – September 30, 2025 – Tuesday🟢 Nifty Analysis EOD – September 30, 2025 – Tuesday 🔴
Expiry drama continues, but no reversal in sight
🗞 Nifty Summary
Nifty opened with a 31-point gap up, quickly filled the gap, and then added 50 points from the low to test 24,731.80 — the same level that acted as strong resistance yesterday. Once again, the index failed to cross this barrier, triggering a sell-off to 24,593, breaking below the PDL.
However, this breakdown turned out to be false, sparking a 90-point recovery back to the PDC at 24,677.50. Multiple attempts to reclaim the PDC failed. Post 2 PM, volatility spiked — with wild candles and sharp shadows around key levels like PDL, trapping both sides of traders.
Eventually, Nifty settled at 24,633.60, marking the 9th consecutive red close. While the fall seems to be slowing, there is still no sign of reversal yet.
🛡 5 Min Intraday Chart with Levels
🛡 Intraday Walk
Gap up +31 pts → gap filled early.
Bounce of +50 pts to test 24,731.80, yesterday’s resistance.
Sharp sell-off to 24,593 (below PDL).
False PDL breakdown → 90-pt recovery to PDC (24,677.5).
Multiple failures to reclaim PDC.
After 2 PM → wild, volatile candles with traps around PDL.
Closed at 24,633.60.
📉 Daily Time Frame Chart with Intraday Levels
🕯 Daily Candle Breakdown
Open: 24,668.55
High: 24,731.80
Low: 24,593.05
Close: 24,633.60
Change: −1.30 (−0.01%)
🏗️ Structure Breakdown
Tiny red body → indecisive close.
Range: ~139 pts → lower than yesterday.
Long shadows on both ends → strong tussle between bulls and bears.
📚 Interpretation
Rejection repeated at 24,731.
False breakdown below PDL shows buyers defending.
Closing near mid-range with tiny body → indicates pause in momentum.
🕯Candle Type
Small-bodied candle with long shadows → Indecision candle / Doji-like structure.
Signals exhaustion but no confirmation of reversal.
🛡 5 Min Intraday Chart
⚔️ Gladiator Strategy Update
ATR: 173.37
IB Range: 95.80 → Medium
Market Structure: Balanced
Trade Highlights:
10:50 Long Trade – Target Achieved (R:R 1:2.1)
12:15 Long Trade – Trailing SL Hit (R:R 1:0.26)
13:20 Short Trade – Target Achieved (R:R 1:1.96)
📌 What’s Next? / Bias Direction
Bias remains bearish below 24,731. A decisive close above this level could trigger a short-term reversal. Until then, sideways-to-downtrend movement dominates with volatility around support zones.
📌 Support & Resistance Levels
Resistance Zones:
24685 ~ 24675
24735
24750 ~ 24775
24868
24890 ~ 24915
Support Zones:
24600 ~ 24572
24500
24430 ~ 24400
💡 Final Thoughts
“In trading, sideways days are often the market’s way of loading energy. The trap candles test patience — the real move begins once levels finally break.”
✏️ Disclaimer
This is just my personal viewpoint. Always consult your financial advisor before taking any action.
NIFTY

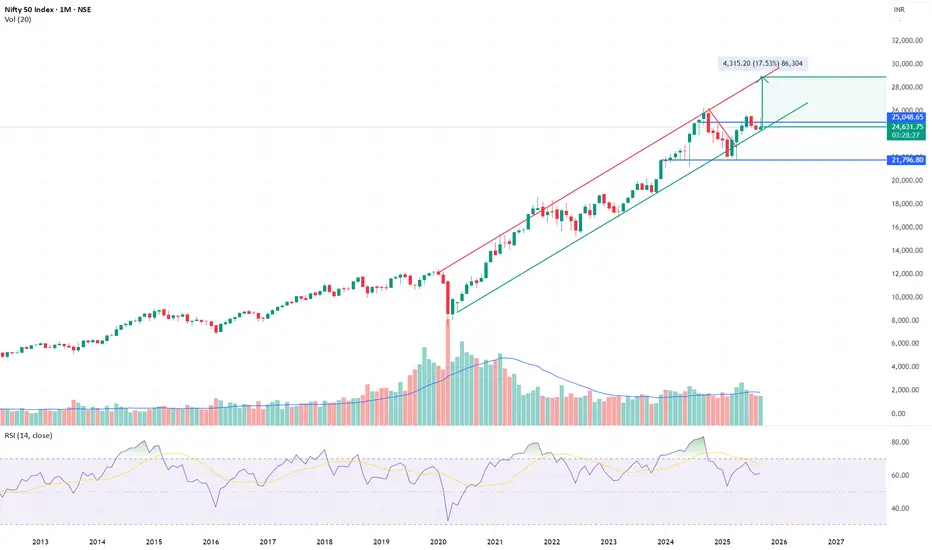
NIFTY 50 – Holding Lower Channel, Eyeing Continuation Above 26kNIFTY is respecting the lower boundary of its long-term upward channel near 24.5–24.6k. This zone remains the key support for the secular uptrend.
Support: 24,000–24,200 must hold to preserve structure.
Trigger: A sustained break above 26,000 would mark continuation of the bull leg, with targets at 28,500–29,000.
Risk: Losing 24k opens room for a deeper slide toward the 21,800 channel base.
Macro Context: Domestic earnings growth remains constructive, but global liquidity, crude oil, and US yields will dictate the timing of the next leg.
Verdict: NIFTY is at the lower channel inflection, not the top. As long as 24k holds, the setup remains bullish, with 26k as the breakout trigger for continuation.
For educational purposes only. This is not investment advice.
Review and plan for 30th September 2025Nifty future and banknifty future analysis and intraday plan.
This video is for information/education purpose only. you are 100% responsible for any actions you take by reading/viewing this post.
please consult your financial advisor before taking any action.
----Vinaykumar hiremath, CMT

Nifty Analysis EOD – September 29, 2025 – Monday 🟢 Nifty Analysis EOD – September 29, 2025 – Monday 🔴
Bulls wrestle, but bears still dictate the close
🗞 Nifty Summary
Nifty opened with a 39-point gap up, far below the 100+ points Gift Nifty indicated. After adding 32 more points, the index slipped to fill the gap, only to stage a strong recovery towards the 24,750–24,775 resistance zone.
At this zone, a Head & Shoulders pattern formed with a neckline at 24,735. Once broken, Nifty quickly tumbled below the day’s low, meeting the H&S target within minutes. After a brief box pattern breakdown, price dipped below the PDL — but this turned into a false breakdown trap, sparking a 132-point recovery back to the neckline level at 24,735.
Despite multiple bullish attempts, the neckline flipped into strong resistance. Bears regained control, dragging Nifty back below PDL, though another late bounce of 77 points lifted the close to 24,677.55.
Overall, the 185-point wide range offered rich intraday trading opportunities, but the close below PDC keeps the index in a bearish framework with no clear reversal yet.
🛡 5 Min Intraday Chart with Levels
🛡 Intraday Walk
Gap Up +39 pts, minor push to +71 pts, then slipped for gap fill.
Strong rebound to 24,750–24,775 resistance, rejected at neckline (H&S setup).
H&S breakdown → hit target quickly, flushed below day’s low.
False PDL breakdown → 132-pt recovery back to neckline (24,735).
Neckline polarity shift to resistance → multiple failed bull attempts.
Another bear move below PDL, but bulls rescued with 77-pt bounce into close.
📉 Daily Time Frame Chart with Intraday Levels
🕯 Daily Candle Breakdown
Open: 24,728.55
High: 24,791.30
Low: 24,606.20
Close: 24,634.90
Change: −19.80 (−0.08%)
🏗️ Structure Breakdown
Small red body (~93.65 pts).
Range: ~185.10 pts → decent volatility.
Upper wick: ~62.75 pts → sellers rejected upside.
Lower wick: ~28.70 pts → mild buying near lows.
📚 Interpretation
Bulls attempted a rally but met heavy resistance at 24,790.
Bears dragged price down to 24,606.
Close near low → bearish tilt despite recovery attempts.
🕯Candle Type
Small-bodied bearish candle → Spinning Top with bearish bias.
Signals indecision but sellers still defending control.
🛡 5 Min Intraday Chart
⚔️ Gladiator Strategy Update
ATR: 175.10
IB Range: 110.20 → Medium
Market Structure: ImBalanced
Trade Highlights:
11:30 Long Trade – Target Achieved (R:R 1:3.3)
📌 What’s Next? / Bias Direction
Bias remains bearish below 24,800. A sustained breach above this level can revive bullish momentum, else further weakness toward 24,600–24,420 is likely.
📌 Support & Resistance Levels
Resistance Zones:
24735
24750 ~ 24775
24868
24890 ~ 24915
24990 ~ 25000
25048
Support Zones:
24600 ~ 24572
24500
24430 ~ 24400
💡 Final Thoughts
“Markets don’t lie — they trap. False breakouts and breakdowns are the real test of discipline. Those who chase often lose, those who wait often win.”
✏️ Disclaimer
This is just my personal viewpoint. Always consult your financial advisor before taking any action.

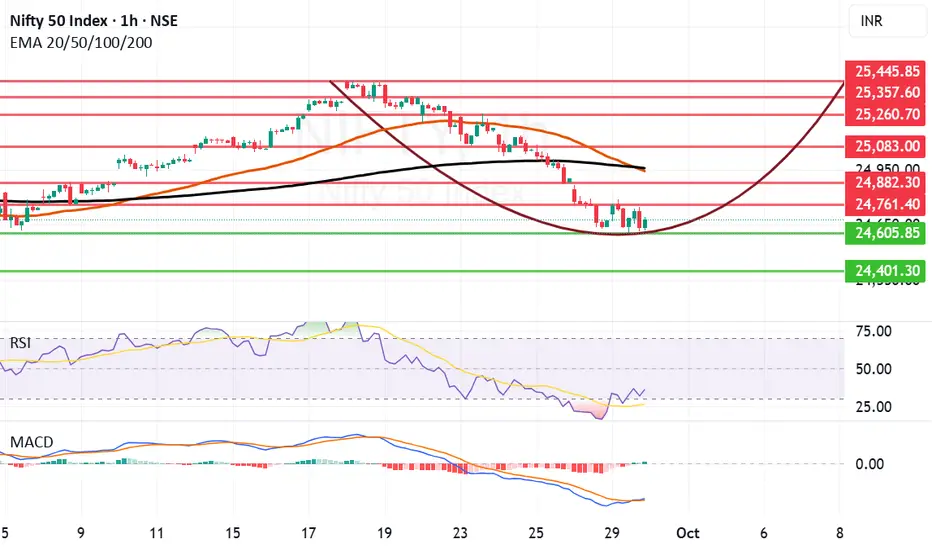
Temporary Bottom formations seems to be happening in Nifty. It seems that Nifty is trying to form a bottom around 24605 levels. If this level is broken the next support seems to be near 24401. On the upper side the seem to be near 24761 and 24882. If we get a closing above 24882 the most important resistance will be at 24944 and 24960 where we have the Mother and the father line respectively. Bulls will get back in business above 24960 with further resistances at 25083 and 25260. these seem to be the levels to watch out this week.
Mark Mobius veteran investor looks at Sesex reaching 100,000 within 1 year. Corresponding level for Nifty can be close to 27K+ this is the news on the positive side. RSI has started to move in a positive direction. Moving Average Convergence and Divergence has given a slight indication showing the trend might change sooner rather than later.
To learn more about my Mother, Father and Small Child Theory, RSI, MACD, Profit booking averaging and other Techno-Funda aspects of investing you can read my book THE HAPPY CANDLES WAY TO WEALTH CREATION. It is a book considered by many as a hand book to equity investment. Currently the book enjoys 4.8/5 Star rating on Amazon. Paperback edition or Kindle edition can be bought from there or many other sources.
Disclaimer: The above information is provided for educational purpose, analysis and paper trading only. Please don't treat this as a buy or sell recommendation for the stock or index. The Techno-Funda analysis is based on data that is more than 3 months old. Supports and Resistances are determined by historic past peaks and Valley in the chart. Many other indicators and patterns like EMA, RSI, MACD, Volumes, Fibonacci, parallel channel etc. use historic data which is 3 months or older cyclical points. There is no guarantee they will work in future as markets are highly volatile and swings in prices are also due to macro and micro factors based on actions taken by the company as well as region and global events. Equity investment is subject to risks. I or my clients or family members might have positions in the stocks that we mention in our educational posts. We will not be responsible for any Profit or loss that may occur due to any financial decision taken based on any data provided in this message. Do consult your investment advisor before taking any financial decisions. Stop losses should be an important part of any investment in equity.
Review and plan for 29th September 2025Nifty future and banknifty future analysis and intraday plan.
This video is for information/education purpose only. you are 100% responsible for any actions you take by reading/viewing this post.
please consult your financial advisor before taking any action.
----Vinaykumar hiremath, CMT

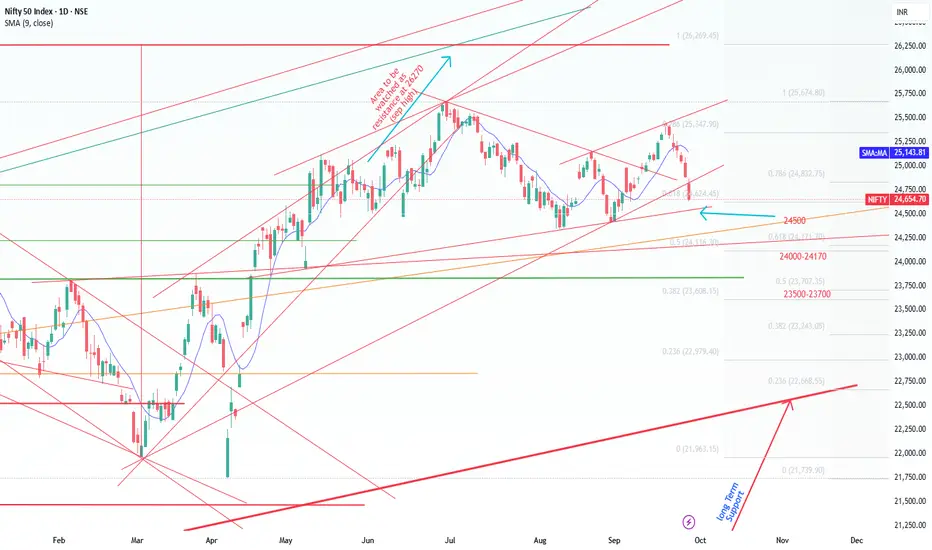
Market Weekly Wrap – Nifty & S&P 500 AnalysisNifty had a tough week, closing at 24654, down 673 points (-2.7%) from last week’s close. This was exactly in line with the downtrend warning I’ve been sharing over the past 3-4 weeks.
Key Highlights:
Weekly Range: High 25331 – Low 24629
Two-Week Correction: Down 3.15% from the recent high of 25448
Key Support Levels: 24474 / 24500 – watch closely!
If Nifty holds 24474/24500, we could see a short-term bounce of 1–2% toward 24950/25000.
But below 24300, brace for a deeper correction — Nifty could retest 23185 support levels.
Investor Tip:
The old saying still applies: "Be greedy when others are fearful."
This is a great time to start deploying capital — either by picking fundamentally strong stocks or through SIP/MF/ETF routes. If the market dips further, you’ll get opportunities to average your positions at better prices.
Sector to Watch Next Week: METALS — this sector looks strong and can outperform if market sentiment turns positive.
My Nifty Range for Next Week: 25050 – 24250
A breakout or breakdown beyond this range could trigger fast, directional moves.
US Markets – S&P 500 Update:
S&P 500 closed at 6643, down just 20 points, holding strong near its key Fibonacci support at 6568.
Upside Levels: Needs to sustain above 6689 for targets at 6780 / 6930 / 6959
Downside Risk: Below 6568, watch for 6502 / 6454 / 6376
Pro Tip: Keep a trailing stop-loss (SL) at 6524 to lock in profits
📌 Key Takeaways:
✅ Market correction was expected – use this opportunity wisely
✅ Watch 24474 support for potential bounce
✅ Metal sector could lead gains next week
✅ S&P 500 holding key support, but keep SLs in place

Nifty Short & Medium Term SupportsNifty on a decline mode because of new Tariff's imposed by Trump mainly on Pharma this week.
Primarily New announcement on IT - H1 B Visa and Tax for Outsourcing IT and the recent pharma tarrifs are the concern.
Use the dips (Opportunity) and buy through SIP or through multiple parcel in this uncertain times with a goal of 3-5 years.
Nifty Short Term Supports:
1. 24500 ( Trend Line as shown )
2. 24000-24170 (Fibonacci Retracements Supports- Two Supports in this zone 24116 & 24171 as shown)
Medium Term Support:
3. 23500-23700 ( Fibonacci Retracements Supports- Two Supports in this zone 23608 & 23707 as shown)
4. 23000
Resistance:
1. 25000
2. 25200 ( 25154 Aug 2025 high)
3. 25500 ( 25441 Sep 18th 2025 High )
Medium Term:
1.25670 ( Jun 2025 High)
2.26269 ( Sep 2024 High)
Nifty Short Term Analysis: Nifty Next Week. Nifty on chart looks very close to being oversold. some It and few Pharma companies are reaching the range were they seem oversold but when the chips are down they can stay that way for a long time. So we cant be sure if the fall will continue or persist. But some IT companies are already trading at mouth watering levels irrespective of H1B visa restriction/fee hike announcements. Pharma manufacturers have also taken the fall due to 100% Tariff on pharma announcement. However the point to be noted is that majority of Indian Pharma export to US is generic in nature and generic pharma is exempt from Tariff! Auto sector was still doing quite well in comparison. There is a new related to 20% stake sale to foreign investors in PSU Banks. Additionally there is a news related of Mega-merger of PSU Banks. Most of Auto purchase whether institutional or personal or corporate happens via Auto loans. So those who provide these loans can benefit. With reduction of GST and relief on Income tax front consumption will also increase. There are many NBFC which can also benefit because there is an increasing trend in buying goods on loan along with holidaying and leisure on loans. Defence spending is also set to increase for sure with ongoing tense environment in the neighbourhood. These are the sectors in my opinion which one must look at. With all these things in mind medium term outlook and long term outlook for India still remains positive.
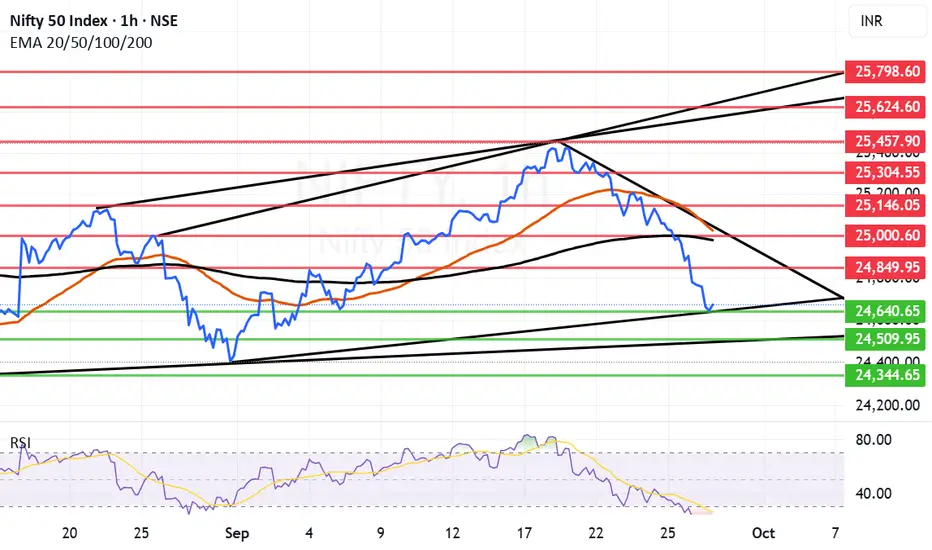
Resistance zone for Nifty with short term perspective seem to be at: 24849, 24980 is the father line, 25000 is an important resistance level and 25026 is the mother line. All the three resistances are close by. So once we get a closing above 25026 things will smoothen out and move towards 25146 or even 25304+ levels.
Support level for Nifty with short term perspective are at: 24640, 24509 and 24344.
Disclaimer: The above information is provided for educational purpose, analysis and paper trading only. Please don't treat this as a buy or sell recommendation for the stock or index. The Techno-Funda analysis is based on data that is more than 3 months old. Supports and Resistances are determined by historic past peaks and Valley in the chart. Many other indicators and patterns like EMA, RSI, MACD, Volumes, Fibonacci, parallel channel etc. use historic data which is 3 months or older cyclical points. There is no guarantee they will work in future as markets are highly volatile and swings in prices are also due to macro and micro factors based on actions taken by the company as well as region and global events. Equity investment is subject to risks. I or my clients or family members might have positions in the stocks that we mention in our educational posts. We will not be responsible for any Profit or loss that may occur due to any financial decision taken based on any data provided in this message. Do consult your investment advisor before taking any financial decisions. Stop losses should be an important part of any investment in equity.
Nifty approaching major support zones very fast. We saw a slide in Nifty this week due to Tariff related concerns and H1B Visa related concerns. The announcements triggered major sell off from FIIs (Who are anyway on a sell path for a long time) and the retail investors. DII and probably HNIs too are buying every sell off which is helping the market from not having a catastrophic fall. Now Nifty is fast approaching the points which can be potential turnaround zones.
Supports For nifty remain at: 24501, 24209 Mother Line Support) falling below Mother line of weekly chart (Very strong support)(50 Weeks EMA) can help the bears to tighten the grip over the market. If we get a closing below 24209 the next support levels will be at 23912, 23116. In very unlikely circumstances Nifty can reach 21741 or 20936 (Father line support).
Resistance For Nifty remain at: 25030, 25516 (Trend line resistance)(Strong resistance), 26277 (Nifty All Time High). If and when we are able to close above 26277. Nifty will gallop quickly towards 27K or even 28K.
It has been a long wait to reach 27K so far after we reached the All time high of 26277 in September 24. 1 year on we are having negative returns on Nifty due to International wars, Indo-Pak war episode followed by Trump Tariff but ones the tide turns a bright upside awaits us. Indian GDP is still expected to grow at 6.5% as per IMF and many other agencies. The night will end and there will be daylight soon. Sometimes it is the darkest before the sun is about to shine. Keep the faith. Sectoral rotation is always advised.
Emphasise on sectors that will benefit from local consumption increase due to Income tax relief, GST relief and Government spending, Chip making, on Infra, Power and defense, Banking, NBFCs and Finances. Sometimes it is just the question of shifting the sail in the direction of the tailwind.
Disclaimer: The above information is provided for educational purpose, analysis and paper trading only. Please don't treat this as a buy or sell recommendation for the stock or index. The Techno-Funda analysis is based on data that is more than 3 months old. Supports and Resistances are determined by historic past peaks and Valley in the chart. Many other indicators and patterns like EMA, RSI, MACD, Volumes, Fibonacci, parallel channel etc. use historic data which is 3 months or older cyclical points. There is no guarantee they will work in future as markets are highly volatile and swings in prices are also due to macro and micro factors based on actions taken by the company as well as region and global events. Equity investment is subject to risks. I or my clients or family members might have positions in the stocks that we mention in our educational posts. We will not be responsible for any Profit or loss that may occur due to any financial decision taken based on any data provided in this message. Do consult your investment advisor before taking any financial decisions. Stop losses should be an important part of any investment in equity.

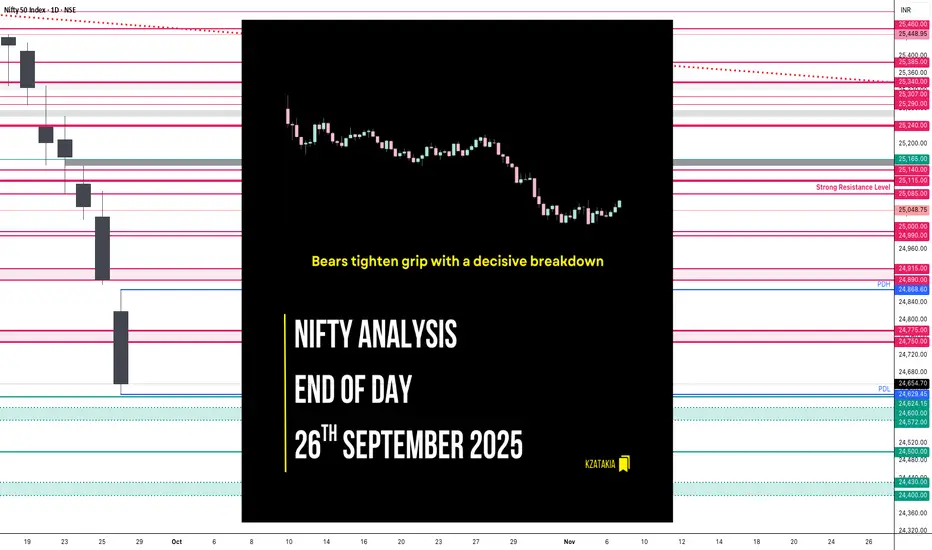
Nifty Analysis EOD – September 26, 2025 – Friday🟢 Nifty Analysis EOD – September 26, 2025 – Friday 🔴
Bears tighten grip with a decisive breakdown
🗞 Nifty Summary
Nifty opened with a Gap Down of 61 points, below the Previous Day Low, and made an initial attempt to recover but stretched only 25 points. From there, a strong selloff dragged it down 109 points from the day high, finding temporary support at the 24,775–24,750 zone.
Multiple attempts to hold this zone failed, and finally around 13:20, the level gave way, triggering a sharp fall of ~125 points to the day’s low at 24,629.50. The index closed weak at 24,673.10, just above the low.
Today’s 239.15-point range was significantly above the Gladiator Avg Range (175.68), highlighting heightened volatility. Importantly, Nifty tested key supports from 5th Sept and 1st Sept closes, while also closing below the 3rd Sept close.
This marks the 7th consecutive red candle session, with none crossing the previous day’s high or close — a clear sign of strong bearish dominance. If Monday breaks 24,430–24,400, the structure shifts from retracement to a new leg of breakdown.
🛡 5 Min Intraday Chart with Levels
🛡 Intraday Walk
Opened Gap Down 61 points below PDL.
Attempted to fill gap, capped at +25 points.
Fell further 109 points from high, tested 24,775–24,750 support zone.
Bears broke this zone at 13:20, sparking a 125-point sharp decline to 24,629.5.
Closed weak at 24,673.10, near the low.
📉 Daily Time Frame Chart with Intraday Levels
🕯 Daily Candle Breakdown
Open: 24,818.55
High: 24,868.60
Low: 24,629.45
Close: 24,654.70
Change: −236.15 (−0.95%)
🏗️ Structure Breakdown
Strong red candle (Close << Open).
Body: ~163.85 points → large bearish body.
Range: ~239.15 points → wide volatility.
Upper wick: ~50 points → firm rejection at 24,860 zone.
Lower wick: ~25 points → minor buying attempt.
Close near lows → clear bear dominance.
📚 Interpretation
Overnight sentiment carried into the gap down.
Bulls tried a mild recovery but failed at 24,868.
Bears controlled the day with a near Marubozu-like structure.
🕯Candle Type
Bearish Marubozu-like candle → decisive bearish continuation with minimal lower shadow.
🛡 5 Min Intraday Chart
⚔️ Gladiator Strategy Update
ATR: 175.68
IB Range: 125.10 → Wide
Market Structure: ImBalanced
Trade Highlights:
09:45 Short Trade – Target Achieved (R:R 1:2.15)
11:50 Long Attempt – SL Hit
13:25 Short Trade – Target Achieved (R:R 1:3.10)
📌 What’s Next? / Bias Direction
Resistance Zones: 24,750–24,775 · 24,868 · 24,890–24,915 · 24,990–25,000 · 25,048
Support Zones: 24,630–24,625 · 24,600–24,572 · 24,500 · 24,430–24,400
Bias stays bearish as long as Nifty trades below 24,860–25,000. A breakdown under 24,430–24,400 can extend the bearish trend toward deeper supports.
📌 Support & Resistance Levels
Resistance Zones:
24750 ~ 24775
24868
24890 ~ 24915
24990 ~ 25000
25048
Support Zones:
24630 ~ 24625
24600 ~ 24572
24500
24430 ~ 24400
💡 Final Thoughts
“Seven red candles in a row — when bears take the fort, the trend is their best ally. Until bulls reclaim higher ground, caution remains the winning trade.”
✏️ Disclaimer
This is just my personal viewpoint. Always consult your financial advisor before taking any action.
NIFTY Strong selling pressure. Two potential targets.Last time we looked at the Nifty 50 Index (NIFTY) was almost at the start of the year (February 13, see chart below), giving a strong Sell Signal which quickly hit our 22250 Target:
This time the index finds itself within a Channel Down, currently on a strong Bearish Leg, with the last sell signal being the 1D MA50/ 100 Bearish Cross. Our immediate Target is 24500, which is the Higher Lows trend-line, the next level of Support.
If that breaks and then the price gets rejected on it again after a bounce, we expect further decline, targeting the 1D MA200 (orange trend-line) and the bottom of the Channel Down at 24200.
-------------------------------------------------------------------------------
** Please LIKE 👍, FOLLOW ✅, SHARE 🙌 and COMMENT ✍ if you enjoy this idea! Also share your ideas and charts in the comments section below! This is best way to keep it relevant, support us, keep the content here free and allow the idea to reach as many people as possible. **
-------------------------------------------------------------------------------
💸💸💸💸💸💸
👇 👇 👇 👇 👇 👇

Weak closing but market on the verge of being oversold.We saw a closing today that has dragged Nifty below Father line support and mid channel support of hourly chart. RSI is indicating that the market is oversold and there are slim chances of recovery from support near 24872. If 24872 is broken than we can see Nifty further slipping towards 24772, 24644 or even channel bottom near 24473. If 24473 is broken then market can end up in total bear grip.
Resistances for market seem to be near 24959 Mid channel resistance, followed by father line and Mother line resistance near 24999 and 24125. Closing above 25125 can take the market upwards towards 25215, 25343 and 25431. As of now 25431 is the channel top.
As of now shadow of the candle is neutral but with a tinge of red. Meaning we can have a flat to positive start but later market can become laggard again. For market to sustain upward momentum we need a closing above both Mother and Father line resistances on daily chart.
Disclaimer: The above information is provided for educational purpose, analysis and paper trading only. Please don't treat this as a buy or sell recommendation for the stock or index. The Techno-Funda analysis is based on data that is more than 3 months old. Supports and Resistances are determined by historic past peaks and Valley in the chart. Many other indicators and patterns like EMA, RSI, MACD, Volumes, Fibonacci, parallel channel etc. use historic data which is 3 months or older cyclical points. There is no guarantee they will work in future as markets are highly volatile and swings in prices are also due to macro and micro factors based on actions taken by the company as well as region and global events. Equity investment is subject to risks. I or my clients or family members might have positions in the stocks that we mention in our educational posts. We will not be responsible for any Profit or loss that may occur due to any financial decision taken based on any data provided in this message. Do consult your investment advisor before taking any financial decisions. Stop losses should be an important part of any investment in equity.

Review and plan for 26th September 2025Nifty future and banknifty future analysis and intraday plan.
This video is for information/education purpose only. you are 100% responsible for any actions you take by reading/viewing this post.
please consult your financial advisor before taking any action.
----Vinaykumar hiremath, CMT

Review and plan for 25th September 2025Nifty future and banknifty future analysis and intraday plan.
This video is for information/education purpose only. you are 100% responsible for any actions you take by reading/viewing this post.
please consult your financial advisor before taking any action.
----Vinaykumar hiremath, CMT

Nifty Analysis EOD – September 24, 2025 – Wednesday🟢 Nifty Analysis EOD – September 24, 2025 – Wednesday 🔴
Bears tighten grip as bulls lose ground near key supports
🗞 Nifty Summary
Nifty opened with a Gap Down of 38 points, extended losses by another 98 points, and broke below the previous day’s low, touching the crucial 25,048.75 level. A recovery attempt lifted the index to 25,115, but renewed selling dragged it back near the day’s lows. Despite a false breakdown attempt at IB Low, the afternoon saw recovery till 25,140, where bulls and bears clashed briefly. Eventually, bears regained control and pushed Nifty below 25,048.75, closing at 25,060.90, just off the day’s low.
The session was a roller-coaster ride, giving intraday traders multiple opportunities. Despite bulls’ mid-session efforts, the day ended decisively in the bears’ favor. Bigger picture: in just 9 sessions, the 400-point rally since 12th Sep has been wiped out, putting the index back at the breakout base of 25,115.
If 25,000–24,990 breaks, the next strong support lies at 24,915–24,890. On the upside, bulls must reclaim 25,115 to regain any meaningful grip.
🛡 5 Min Intraday Chart with Levels
🛡 Intraday Walk
Gap Down of 38 points, extended fall of 98 points → tested 25,048.75.
Sharp recovery to 25,115, but sell-off resumed.
False breakdown attempt below IB Low → recovery toward 25,140.
Bulls failed to push higher → bears dragged back below 25,048.75.
Closed weak at 25,060.90, near day’s low.
📉 Daily Time Frame Chart with Intraday Levels
🕯 Daily Candle Breakdown
Open: 25,109.20
High: 25,150.30
Low: 25,027.90
Close: 25,060.90
Change: −93.80 (−0.37%)
🏗️ Structure Breakdown
Red candle (Close < Open).
Body: ~51.85 points → bearish.
Range: ~122.40 points → moderate volatility.
Upper wick: ~41.10 points → rejection near 25,150.
Lower wick: ~29.45 points → buyers defended 25,030 weakly.
Close near lows → bearish dominance.
📚 Interpretation
Sellers took control early and maintained pressure.
Bulls defended 25,030 briefly but couldn’t sustain higher levels.
Strong rejection from 25,150 supply zone.
🕯Candle Type
Bearish continuation candle → confirms seller strength after prior indecision.
🛡 5 Min Intraday Chart
⚔️ Gladiator Strategy Update
ATR: 160.79
IB Range: 100.40 → Medium
Market Structure: ImBalanced
Trade Highlights:
10:30 Short Trade – Target Achieved (R:R 1:2.26)
12:10 Long Trade – Target Achieved (R:R 1:1.58)
13:45 Short Trade – Target Achieved (R:R 1:2.97)
📌 What’s Next? / Bias Direction
Resistance Zones: 25,085 · 25,115 · 25,140–25,165 · 25,240
Support Zones: 25,045–25,030 · 25,000–24,990 · 24,915–24,890
Bias remains bearish unless bulls reclaim 25,115–25,200. Breach of 25,000 may trigger stronger selling pressure toward 24,915.
📌 Support & Resistance Levels
Resistance Zones:
25085
25115
25140 ~ 25165
25240
Support Zones:
25048 ~ 25030
25000 ~ 24990
24915 ~ 24890
💡 Final Thoughts
Today’s session reminds us: “Markets can erase days of gains in hours – that’s why defense matters as much as offense.”
Respect levels, protect capital, and adapt to the changing momentum.
✏️ Disclaimer
This is just my personal viewpoint. Always consult your financial advisor before taking any action.

Nifty Analysis EOD – September 23, 2025 – Tuesday🟢 Nifty Analysis EOD – September 23, 2025 – Tuesday 🔴
Expiry Day Drama – Two-Sided Moves, Tug of War Continues
🗞 Nifty Summary
Nifty opened with a 43-point gap up right at the strong resistance of 25,240, but selling pressure quickly kicked in. Within the first 30 minutes, the index fell 140 points from the high to test the crucial support at 25,115.
From there, a descending triangle pattern formed. Breakdown was triggered at 11:00 AM, but the next support at 25,085 came to the rescue. This 25,085–25,115 zone acted as a base, and once 25,115 was reclaimed, Nifty surged 108 points back to PDC. After a brief pause, the rally extended toward the day’s high, but the CPR Zone, CDO, CDH, and strong 25,240 resistance halted the move. Sellers pushed the index back below mean and PDC, closing at 25,169.50.
👉 Overall, expiry day was a roller coaster —
Great for option buyers with two-sided moves, but also tough to handle both sides that saw traps.
Tough for option sellers as both sides move on expiry day, too hot to handle.
Another spinning top–like candle emerged, reflecting the tug of war. With range expansion already visible, the next session may cool down into a narrower range, provided today’s high or low holds.
🛡 5 Min Intraday Chart with Levels
📉 Daily Time Frame Chart with Intraday Levels
🕯 Daily Candle Breakdown
Open: 25,209.00
High: 25,261.90
Low: 25,084.65
Close: 25,169.50
Change: −32.85 (−0.13%)
🏗️ Structure Breakdown
Small red candle (Close < Open).
Body: ~39.5 points → small body, indecision.
Range: ~177.25 points → wide swings.
Upper wick: ~52.90 points → rejection at 25,260.
Lower wick: ~84.85 points → buyers active at 25,085.
Close near lower-mid of the range.
📚 Interpretation
Opened at resistance → sellers took control early.
Buyers held 25,085–25,115, creating a base.
Rally attempts were capped at 25,240 resistance.
Close shows market still in tug of war, with sellers slightly ahead.
🕯Candle Type
Spinning Top → indecision but weak bias.
📉📈 Short-Term View – September 24, 2025
Resistance Zone: 25,250–25,340 → repeated selling here.
Support Zone: 25,085–25,115 → defended again today.
Break below 25,085 → downside to 25,048 / 25,000 / 24,990.
Bullish continuation only above 25,260–25,340.
👉 3-Day Context (19th → 23rd Sept)
19th Sept: Bearish rejection candle from ~25,420.
22nd Sept: Strong rejection near 25,330, weak close at 25,202.
23rd Sept: Spinning Top at 25,170 → hesitation, indecision, tilt bearish.
👉 The sequence shows distribution pressure building.
📌 Conclusion:
Nifty is losing bullish momentum as sellers hold 25,250–25,450 firmly, while bulls are desperately defending 25,080–25,150. Until one side gives way, expect volatile but range-bound trade. The bias leans toward a short-term correction unless bulls reclaim 25,330+ convincingly.
🛡 5 Min Intraday Chart
⚔️ Gladiator Strategy Update
ATR: 162.87
IB Range: 140.8 → Big
Market Structure: Imbalanced
Trade Highlights:
09:20 → Short Trade ✅ Target Achieved (R:R = 1:2)
11:10 → Short Trade ❌ SL Hit
12:25 → Long Trade ✅ Target Achieved (R:R = 1:3.63)
📌 Support & Resistance Levels
Resistance Zones:
25,240
25,290 ~ 25,307
25,340 ~ 25,385
25,425 ~ 25,460
Support Zones:
25,165 ~ 25,140
25,115
25,085
25,045
25,000 ~ 24,990
💡 Final Thoughts
The market played both sides on expiry day, rewarding nimble traders and punishing late movers. Key battle zone remains 25,085–25,150 vs. 25,250–25,340. Whoever wins this zone will dictate the next directional leg.
📖 “A range is the battlefield — breakout is the victory.”
✏️ Disclaimer
This is just my personal viewpoint. Always consult your financial advisor before taking any action.

Review and plan for 23rd February 2025Nifty future and banknifty future analysis and intraday plan.
This video is for information/education purpose only. you are 100% responsible for any actions you take by reading/viewing this post.
please consult your financial advisor before taking any action.
----Vinaykumar hiremath, CMT

Channel top and H1B visa mayhem hits Nifty. Nifty was today hit by dual mayhem of Channel top resistance and the hike in H1B visa fees by US. As we know IT sector was the worst hit today as IT index plummeted further down by -2.95%. Pharma and Small Cap index where other indices which took major hit. Commodities like Gold and Silver continued to shine. It is yet to be seen if IT index will plummet further or this was just a one day negativity. There are Pros and Cons of the hike lot of analyst believe that this is definitely a jolt for now but it will end up strengthening Indian It sector as lot more offshoring of work will happen. It is too early to judge if this shock will be absorbed in a day, week or IT index will take more time to recover from this issue.
The support for Nifty remain at: 25200 is the immediate trend line support where the Nifty stopped today, followed by 25133 and 24997. 24947 is the mid channel line support below which Nifty will become very weak.
The Resistances for Nifty remain at: 25221 (Mother line resistance) followed by 25309 and 25364. If we get a closing above 25364 Channel top seems to be near 25431 and 25469. Closing above 25469 will give us a channel Break Out and will have potential to lead us to new highs.
Disclaimer: The above information is provided for educational purpose, analysis and paper trading only. Please don't treat this as a buy or sell recommendation for the stock or index. The Techno-Funda analysis is based on data that is more than 3 months old. Supports and Resistances are determined by historic past peaks and Valley in the chart. Many other indicators and patterns like EMA, RSI, MACD, Volumes, Fibonacci, parallel channel etc. use historic data which is 3 months or older cyclical points. There is no guarantee they will work in future as markets are highly volatile and swings in prices are also due to macro and micro factors based on actions taken by the company as well as region and global events. Equity investment is subject to risks. I or my clients or family members might have positions in the stocks that we mention in our educational posts. We will not be responsible for any Profit or loss that may occur due to any financial decision taken based on any data provided in this message. Do consult your investment advisor before taking any financial decisions. Stop losses should be an important part of any investment in equity.

Nifty Analysis EOD – September 22, 2025 – Monday🟢 Nifty Analysis EOD – September 22, 2025 – Monday 🔴
Gap-Down, Whipsaw, and Late-Session Breakdown
🗞 Nifty Summary
Nifty opened with a 93-point gap down at 25,240, right at our support level, but slipped another 48 points to test 25,212, marking the day’s low. A sharp 120-point recovery followed, filling the gap within 35 minutes.
For most of the session, price action stayed muted in a 54-point range (25320–25267) near PDL and S1, reflecting indecision. However, the late second half brought a sharp sell-off as 25,240 broke, sending Nifty to test 25,165 before a minor bounce. The index closed at 25,202.35, just above the day’s low.
👉 Overall, the session was rough:
Morning = Bulls dominated with recovery.
Midday = Both sides in a stalemate.
Late = Bears seized control with a decisive breakdown.
🛡 5 Min Intraday Chart with Levels
📉 Daily Time Frame Chart with Intraday Levels
🕯 Daily Candle Breakdown
Open: 25,238.10
High: 25,331.70
Low: 25,151.05
Close: 25,202.35
Change: −124.70 (−0.49%)
🏗️ Structure Breakdown
Red candle (Close < Open).
Body: ~35.75 points (small vs. range).
Range: ~180.65 points (high intraday volatility).
Upper wick: ~93.60 points (rejection near 25,331).
Lower wick: ~51.30 points (buyers tried to defend near 25,150).
Closed near the day’s low → bears ended in control.
📚 Interpretation
Nifty tested 25,331 early but supply kicked in hard.
Selling dragged price to 25,151 before buyers attempted defense.
Recovery attempts failed near 25,200 → sellers controlled late trade.
🕯Candle Type
Resembles an Inverted Hammer / Shooting Star–like red candle, with strong upper rejection.
📉📈 Short-Term View – September 23, 2025
Resistance Zone: 25,320–25,350 (tested, rejected).
Support Zone: 25,150–25,200 (buyers active intraday, but weak close).
Break below 25,150 → could extend fall toward 25,050–25,000.
Upside strength only if 25,330+ is reclaimed.
📌 Conclusion: Recent sessions are showing distribution signs after a strong rally. Bulls are holding 25,150–25,200, but repeated failures near 25,330–25,450 hint at a short-term pullback unless reclaimed.
🛡 5 Min Intraday Chart
⚔️ Gladiator Strategy Update
ATR: 161.28
IB Range: 120.10 → Medium
Market Structure: Imbalanced
Trade Highlights:
11:15 Short Trade → ❌ SL Hit
13:20 Short Trade → ✅ Target Achieved (R:R = 1:2)
📌 Support & Resistance Levels
Resistance Zones:
25,240
25,290 ~ 25,307
25,340 ~ 25,385
25,425 ~ 25,460
Support Zones:
25,165 ~ 25,140
25,115
25,085
25,045
25,000 ~ 24,990
💡 Final Thoughts
The index danced in all directions today but closed with bears firmly ahead. Buyers are still defending 25,150–25,200, but cracks are visible.
👉 Watch 25,150 carefully — losing this could open the gates toward 25,000.
📖 “Markets don’t move in straight lines — they trap, test, and only then trend.”
✏️ Disclaimer
This is just my personal viewpoint. Always consult your financial advisor before taking any action.

Review and plan for 22nd September 2025 Nifty future and banknifty future analysis and intraday plan.
Stock ideas.
This video is for information/education purpose only. you are 100% responsible for any actions you take by reading/viewing this post.
please consult your financial advisor before taking any action.
----Vinaykumar hiremath, CMT

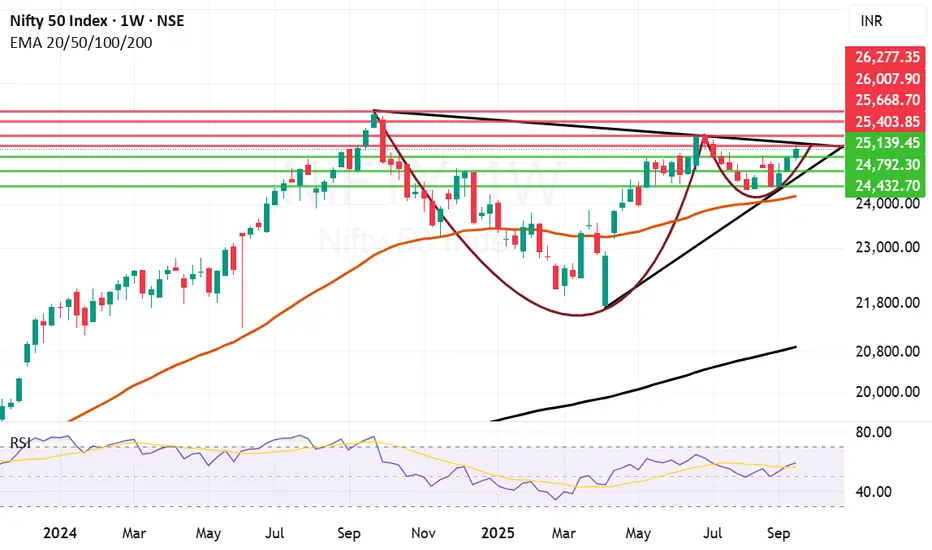
Wild Week Ahead For Nifty on the verge of cup and handle BO.Till Thursday the situation was like 11 overs 100 to win with 8 wickets in hand. Bears pulled one tight over and took a wicket on Friday. Now If someone tells you the team chasing needs 95 runs in 10 overs with 7 wickets in hand with one well set batsmen at the crease and a 'Cricketing Goat' coming in to bat along with well set batsman. Would you like to watch this T-20 match? Obviously you we will say,"Bring it on!" Very exciting match ahead. Right! Well we have a similar match going on between bulls and bears.
Nifty is on the verge of a cup and handle Breakout. In the last throw of dice Bears tried to marinate some negativity on Friday where Nifty closed at 25327 after making a high of 25448 during the week. The correction from high was also due to few technical reasons like high RSI and overbought market zones on daily and hourly charts.
The other reason was that current round of Trade talks between US and Europe are also not yielding some concrete results and Pakistan is going all out with strategic defense deal with KSA. Such deals have more or less no 'locus standi' either in reality or on the market but certainly they 'on paper' seem to be supporting our enemy state. The new GST rates will come into effect from next week which can be a great news for some sectors at the same time some sectors can come out as on the wrong side of the stick.
What to expect? Lot of volatility and sectoral changes. Mutual Funds / HNIs / FII and other DII will try to readjust their portfolio. Such situation can throw wild swings. Intraday trading and short term positional trading will be very risky. F&O traders should be very careful with their positions. They can make or terribly break your banks. Long term retail investors should go with the flow and steer their ship with minute adjustment to their sail or make calculated adjustments if required. Avoid knee-jerk reactions in any case.
If the cup and handle Breakout happens on Nifty we can swifty reach the previous ATH (All Time High or make a New high within this quarter. If the Cup and Handle / Trend-line Break out fails Nifty will be again send back to search for supports. This week Nifty did try to get a trend line breakout but it did not succeed still the form and momentum looks good. on Friday FII and DII both were on the buying side. This means there are chances that positive momentum can continue making shadow of the candle green.
Supports for Nifty currently remain at: 25139, 24792, 24432 and finally Mother line support of 50 Weeks EMA at 24191.
Resistances for Nifty remain at: Zone between 25403 and 25668 strong resistance zone which includes major Trend line resistance and highs of the year 2025. Above this zone the next resistance can be seen in the chart at 26007 and 26277 (All Time High of Nifty).
As described in the first paragraph the game is in balance right now with possibilities of Breakout and Breakdown remaining almost equal with Bulls currently having a slight edge. Volatile month end awaits with a chance of big red or green candles to be seen in the next 2 to 3 weeks. Very interesting time ahead lets see how the cookie crumbles.
So it is like a team chasing in a T-20 needs 95 runs in 10 overs with 7 wickets in hand with Two well set batsmen at the crease. Bring it on!
If you love cricket as well as the stock market, you can read my book The Happy Candles Way to Wealth Creation. The book juxtaposes cricket and stock market in many ways. Lot of cricketing examples are given for understanding stock market behaviour. You will love it. Those who have read it love the book as it has a rating of 4.8/5 on Amazon. It is value for money hand book to learn Techno-funda Analysis. Do read it. Kindle version is available too!
Disclaimer: The above information is provided for educational purpose, analysis and paper trading only. Please don't treat this as a buy or sell recommendation for the stock or index. The Techno-Funda analysis is based on data that is more than 3 months old. Supports and Resistances are determined by historic past peaks and Valley in the chart. Many other indicators and patterns like EMA, RSI, MACD, Volumes, Fibonacci, parallel channel etc. use historic data which is 3 months or older cyclical points. There is no guarantee they will work in future as markets are highly volatile and swings in prices are also due to macro and micro factors based on actions taken by the company as well as region and global events. Equity investment is subject to risks. I or my clients or family members might have positions in the stocks that we mention in our educational posts. We will not be responsible for any Profit or loss that may occur due to any financial decision taken based on any data provided in this message. Do consult your investment advisor before taking any financial decisions. Stop losses should be an important part of any investment in equity.
Nifty Analysis EOD – September 19, 2025 – Friday🟢 Nifty Analysis EOD – September 19, 2025 – Friday 🔴
Flat Open, Sharp Fall, and a Range-Bound Trap
🗞 Nifty Summary
Gift Nifty hinted at a 50-point gap down, but Nifty opened nearly flat at 25,410. However, the bulls couldn’t hold, and within the first 45 minutes, the index slipped 132 points, breaking S1 and PDL to mark the day’s low at 25,297.
The rest of the day was stuck in a narrow 50-point band, with both sides witnessing fakeouts. The index finally closed exactly at S1 (25,352.5), about 66 points above the low.
The total range for the day stood at 142 points, and closing below previous day low showing weakness after yesterday’s sharp recovery attempt.
Yesterday’s note highlighted:
“The 100-point recovery was unexpected.”
— Today, that very recovery got completely wiped out in the early part of the session.
🗞 Last 3 Sessions breakdown
17th Sep 2025 → Open: 25,276.60 | Close: 25,330.25 | Change: +91.15 (+0.36%) → Bullish, small green candle
18th Sep 2025 → Open: 25,441.05 | Close: 25,423.60 | Change: +93.35 (+0.37%) → Bullish continuation, narrow range
19th Sep 2025 → Open: 25,410.20 | Close: 25,327.05 | Change: −96.55 (−0.38%) → Bearish, closes near 17th close
📌 Pattern Check:
The 3-session structure shows some similarity (~65%) with an Evening Star, but not a textbook one:
1st candle = Bullish
2nd candle = Strong bullish continuation (not a small-bodied star)
3rd candle = Bearish close near/below 17th session’s midpoint
👉 Interpretation:
This looks like a weak Evening Star variation, hinting at possible reversal.
For trading perspective, it’s more of a caution signal than a short trigger — confirmation from the next session’s candle is essential.
🛡 5 Min Intraday Chart with Levels
📉 Daily Time Frame Chart with Intraday Levels
🕯 Daily Candle Breakdown
Open: 25,410.20
High: 25,428.75
Low: 25,286.30
Close: 25,327.05
Change: −96.55 (−0.38%)
🏗️ Structure Breakdown
Red candle (Close < Open).
Body: ~83.15 points (moderate).
Upper wick: ~18.55 points.
Lower wick: ~40.75 points.
Closed closer to the low → Selling pressure throughout the session.
📚 Interpretation
Market opened flat but faced resistance near 25,428 (close to yesterday’s high).
Selling dragged it to 25,286, with only a mild recovery into the close.
Indicates a supply zone around 25,420–25,450.
🕯Candle Type
Bearish candle with a small lower wick.
Not a reversal by itself, but signals loss of momentum after prior strength.
📉📈 Short-Term View – September 22, 2025
Resistance: 25,420–25,450 remains strong.
Support: 25,285–25,300 (today’s low).
Breakdown below 25,240 → Downside may stretch to 25,200–25,140.
Bulls need to reclaim 25,400+ quickly to keep the uptrend alive.
🛡 5 Min Intraday Chart
⚔️ Gladiator Strategy Update
ATR: 159.12
IB Range: 114.45 → Wide
Market Structure: balanced
Trade Highlights:
11:45 Short Trade → SL Hit
📌 Support & Resistance Levels
Resistance Zones:
25,340 ~ 25,385
25,425 ~ 25,460
25,500 (Psychological Level)
25,535
Support Zones:
25,307
25,290
25,275 ~ 25,260
25,240
💡 Final Thoughts
The market delivered a sharp fall early, followed by a dull range-bound trap. The weak Evening Star variation hints that momentum is fading.
👉 Bulls must reclaim 25,400+, else a drift toward 25,200 cannot be ruled out.
📖 “Markets often whisper before they shout — today was one such whisper of caution.”
✏️ Disclaimer
This is just my personal viewpoint. Always consult your financial advisor before taking any action.
