Nifty Analysis EOD – October 28, 2025 – Tuesday🟢 Nifty Analysis EOD – October 28, 2025 – Tuesday 🔴
Volatility takes the driver’s seat — indecision candle hints at short-term pause
🗞 Nifty Summary
Nifty opened 44 points gap down at 25,930 and immediately formed OL (Open = Low), sparking an upward run that filled the gap and even crossed the previous day’s high, breaching the critical resistance zone of 26,010 ~ 26,020.
However, the breakout turned false, as Nifty failed to hold above and slipped sharply below the open, creating a fake PDH breakout scenario. Post-IB breakdown, the index found footing around S1 and the 25,865 support zone, but the bounce stalled near 25,900, which flipped into resistance and pushed Nifty down toward the PDL.
At the PDL, a double-bottom pattern emerged, triggering a strong rally toward 25,944–25,955. Yet, this zone, previously a support area, turned into resistance (polarity flip), and multiple failed breakout attempts forced bulls to retreat once more.
The last hour turned chaotic — a volatile battle around PDL with several fakeouts kept traders guessing. Around 2:50 PM, sudden expiry adjustments or short covering lifted Nifty sharply back above the day’s consolidation zone, closing near the PDC.
It was a wild roller-coaster session full of opportunities, but the volatility tested traders’ discipline. The long shadows on the 5-min candles perfectly captured the tug-of-war between buyers and sellers.
Despite the action, the day ended marginally negative, forming an indecisive structure where both sides remain active. The next session will be decisive — a breakout and sustainability on either side will dictate direction; otherwise, expect range-bound consolidation.
Today’s candle engulfed the previous day’s range, often a prelude to fake breakouts, so caution is key for breakout traders.
🛡 5 Min Intraday Chart with Levels
🛡 Intraday Walk
Gap-down open (44 pts) at 25,930 → forms OL and surges upward.
Fills the gap and crosses PDH → false breakout above 26,020.
Sharp reversal → IB and open-level breakdown.
Finds support near 25,865 (S1) → bounces to 25,900, flips to resistance.
Tests PDL, forms double bottom → rally to 25,944–25,955.
Multiple fake breakouts → bulls fade.
Wild expiry adjustment lifts price near PDC into the close.
📉 Daily Time Frame Chart with Intraday Levels
🕯 Daily Candle Breakdown
Open: 25,939.95
High: 26,041.70
Low: 25,810.05
Close: 25,936.20
Change: −29.85 (−0.11%)
🏗️ Structure Breakdown
Type: Small red candle with long wicks on both sides.
Range (High–Low): 231.65 pts → wide volatility.
Body: 3.75 pts → nearly neutral body.
Upper Wick: ~105.50 pts
Lower Wick: ~126.15 pts
📚 Interpretation
Market opened below Monday’s close → tested 26,041 (fresh high) but failed to hold.
Sharp selloff followed by a rebound → indecision throughout the day.
Closing near open = tug-of-war between bulls & bears → neutral sentiment.
🕯Candle Type
Spinning Top / Neutral Doji-like
Appears after a strong bullish run → hints at short-term exhaustion or consolidation phase.
🛡 5 Min Intraday Chart
⚔️ Gladiator Strategy Update
ATR: 206.77
IB Range: 112.05 → Medium
Market Structure: Balanced
Trade Highlights:
09:45 – Short Trade → Target Achieved (R:R 1:2.17)
10:05 – Short Trade → Target Achieved (R:R 1:1.49)
12:15 – Long Trade → Target Achieved (R:R 1:2.67)
📌 What’s Next? / Bias Direction
Bias: Neutral → Awaiting breakout
Expect volatility to persist within 25,800–26,050.
Break and sustain above 26,050 = bullish continuation;
Drop below 25,800 = short-term pullback likely.
📌 Support & Resistance Levels
Resistance Zones:
25996
26010 ~ 26020
26085 ~ 26100
Support Zones:
25865
25828
25790
25725 ~ 25715
💡 Final Thoughts
“Indecision is not weakness — it’s the market’s way of asking who’s more patient.”
After a strong run, Nifty pauses for breath. The next session will reveal whether this was just a pit stop or the start of a new short-term consolidation phase.
✏️ Disclaimer
This is just my personal viewpoint. Always consult your financial advisor before taking any action.
Nifty50

Nifty Analysis EOD – October 27, 2025 – Monday🟢 Nifty Analysis EOD – October 27, 2025 – Monday 🔴
Bulls return after the festive break, eyeing 26,000 with renewed strength
Diwali Greetings and Happy New Year to all Indian followers! ✨
After a long Diwali vacation with family, I’m finally back at the desk. Although I was tracking and trading daily, I couldn’t find time to write notes.
During the holiday stretch (7th–24th Oct), Nifty rallied more than 1000 points, hitting our 25,900 pattern target — a smooth ride for intraday traders, except for a few choppy sessions.
🗞 Nifty Summary
Last week’s candle shaped like an inverted hammer/shooting star, hinting at either a pause or a short-term reversal. But today, backed by positive global cues, Nifty opened gap-up by 48 points, showed no intent to fill the gap, and rallied sharply upward.
The index faced resistance around 25,944–25,977, and after several failed breakout attempts beyond 25,977, it briefly marked a new day high at 26,005 before slipping back into the resistance zone.
The final two hours turned volatile — both bulls and bears fought for control. Eventually, Nifty closed at 25,974, just below the intraday high yet comfortably above the previous day’s high — a sign of bullish continuation with caution ahead.
While the close above PDH is positive, sustained strength will only come if bulls breach and hold 25,977–26,020 on the upcoming monthly expiry session.
🛡 5 Min Intraday Chart with Levels
🛡 Intraday Walk
Nifty opened Gap-Up 48 points above PDH.
Rally extended straight to 25,944–25,977 resistance zone.
26,005 marked as intraday high — brief breakout attempt failed.
Last two hours saw heavy volatility within resistance band.
Closed strong at 25,974, maintaining higher-high structure.
🕯 Daily Candle Breakdown
Open: 25,843.20
High: 26,005.95
Low: 25,827.00
Close: 25,966.05
Change: +170.90 (+0.66%)
🏗️ Structure Breakdown
Green candle with solid momentum.
Body ≈ 122.85 pts → decent bullish body.
Range ≈ 178.95 pts → healthy intraday activity.
Upper wick ≈ 39.9 pts, Lower wick ≈ 16.2 pts.
📚 Interpretation
Market opened gap-up and held gains throughout.
Strong follow-through buying above 25,850.
Close near upper quartile of range → bullish conviction intact.
Minor upper wick shows temporary supply at 26,000 psychological mark.
🕯Candle Type
Bullish Marubozu variant (small top wick).
Indicates buying continuation after breakout-driven rally.
🛡 5 Min Intraday Chart
⚔️ Gladiator Strategy Update
ATR: 204.01
IB Range: 119.70 → Medium
Market Structure: Balanced
Trade Highlights:
09:20 – Long Trade → Target Achieved (R:R 1:1.85)
10:06 – Long Trade → Target Achieved (R:R 1:0.79)
📌 What’s Next? / Bias Direction
Bias: Mildly Bullish
As long as 25,850–25,865 holds, the bias remains positive.
A breakout above 26,020 may extend targets to 26,085–26,150, while failure could lead to a sideways consolidation.
📌 Support & Resistance Levels
Resistance Zones:
25996
26010 ~ 26020
26085 ~ 26100
Support Zones:
25865
25828
25790
25725 ~ 25715
💡 Final Thoughts
“Momentum loves clarity — hesitation builds only where conviction weakens.”
The market tone stays upbeat, but resistance near 26,000 will test whether bulls have the stamina to carry forward the festive rally.
✏️ Disclaimer
This is just my personal viewpoint. Always consult your financial advisor before taking any action.

Nifty sustains the trendline Breakout on Muhurat day trading. Nifty sustained the trendline breakout gained earlier this week on Flattish trade on Muhurat day. After making a high of 25934 Nifty ended at 25868. Supports for Nifty are at 25652 and 25370. Below this level there is a Mother line support at 25087. Something to worry about is the upcoming resistances 26015, 26277 and 26484 (Golden Fibonacci ratio resistance). If these 3 resistances are crossed and Nifty can go towards 27K or even reach 27394 which can be the new trend top within this Vikram Samvat year if everything goes in line with and in favour of current trend. Wish you all a fabulous Financial success in this festive season and beyond it.
Disclaimer: The above information is provided for educational purpose, analysis and paper trading only. Please don't treat this as a buy or sell recommendation for the stock or index. The Techno-Funda analysis is based on data that is more than 3 months old. Supports and Resistances are determined by historic past peaks and Valley in the chart. Many other indicators and patterns like EMA, RSI, MACD, Volumes, Fibonacci, parallel channel etc. use historic data which is 3 months or older cyclical points. There is no guarantee they will work in future as markets are highly volatile and swings in prices are also due to macro and micro factors based on actions taken by the company as well as region and global events. Equity investment is subject to risks. I or my clients or family members might have positions in the stocks that we mention in our educational posts. We will not be responsible for any Profit or loss that may occur due to any financial decision taken based on any data provided in this message. Do consult your investment advisor before taking any financial decisions. Stop losses should be an important part of any investment in equity.

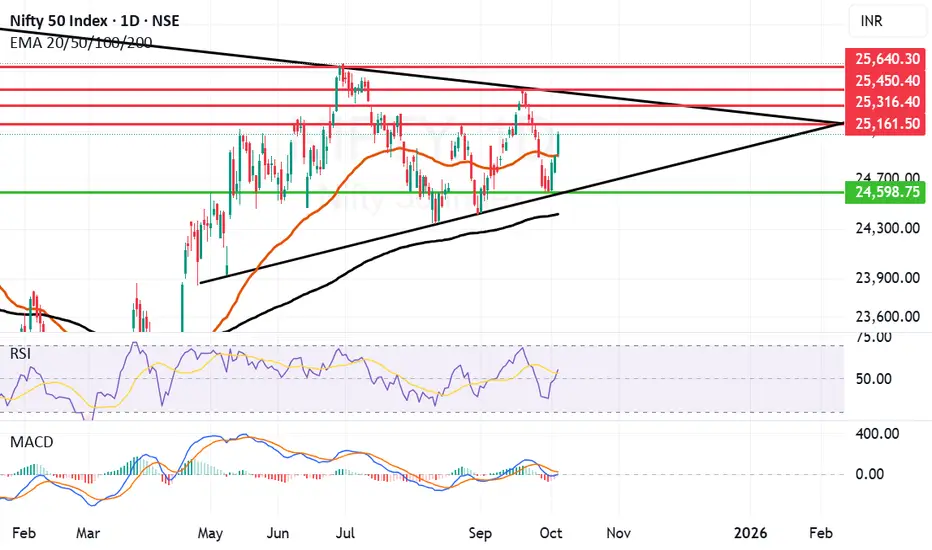
Nifty 50 @ 52 Week high but Could not Break ATH!What is there for Nifty 50 Now?
Nifty 50 went up till 52 week High @ 26104
but Could not Cross the ATH of 26277
missed by 173 points
There is a Hammer Candle formation on weekly charts from Controlling Supply Zone at the top. Which means bears are not interested to turn to bulls right now.
There is a Strong Resistance @ 26250
and if we talk about Support it is @ 25500 & 25000 and if it breaks it then @ 24500
As per my analysis
1. It should test 25500 and then turn bullish and try top break 26200-26250 Strong Resistance and it it breaks it then we will find a new ATH.
2. it cant hold on 25500 then next Support will be 25000. if it takes support from there it can find resistance much more near @ 25500 then and if it breaks it then it can rally again up till 26200 - 26250 strong resistance or otherwise drop till 24500.
3. If Nifty 50 cant hold on to 25500 & 25000 then it can settle @ 24500 then. It will be a strong Support as then it will be @ Controlling Demand Zone of Monthly. it will take some time then to reach this level monthly EMA 20 will also be near then and it should take Support from it and Start a new Bullish Journey
if it reaches 24500 then it will be a very good opportunity for investors to invest in major shares as they also be at very good level to buy then.

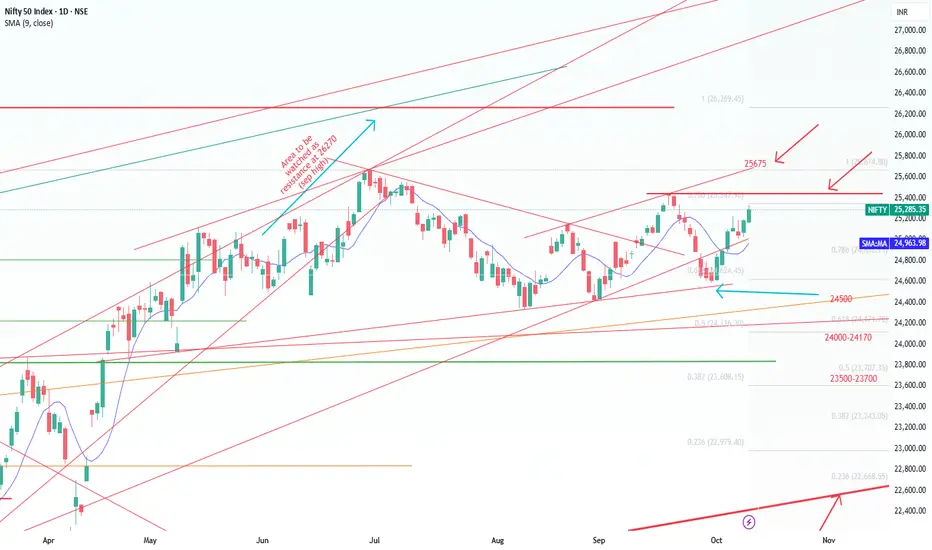
Nifty Short & Medium Term Support&Resistance_22-Oct to 23-Oct-25Nifty Short & Medium Term Support&Resistance_22-Oct to 23-Oct-25
Nifty 25868
Long call was given two weeks before, Nifty very decisively crossed the 25000 resitance and moved up 1000 Points in the last week.
Current Short Term Resistance are 26000 and 26269 ( all time high). It need to break the resistance 26269 decisively to move up to 28000 target in med-long term.
Quarterly result started coming out slowly, HDFC Bank posted 10% profit, ICICI Bank posted 5% profit, Reliance posted 10% profit. HDFC AMC, Persistent Systems,Dixon, Waree Energies and Renewables, KEI, Polycab, ICICI Lombard and ICICI Pru posted good results. All these stocks are already gone up and PE is high. Hence the market also moved up last week. Forthcoming results will take the Index further up or down.
Hence the strategy can be shifted to neutral from long.
Overall, the Qtrly Results and Tariffs deal will decide the future path of the Nifty. Since it is a Volatile situation SIP route or buy in multiple parcel route with a goal of 3-5 years will workout.
Recent 100% additional tariff on China got severe effect on US market on Friday, it will affect global other trade markets too on Monday. Mainly due to the uncertainty prevailing over.
However, for India though initial drop market tend to move up to 25670 ( Jun 2025 all time high).
Repo and FD rate reduction by RBI, people mandatorily have to choose Debt/Commodity/Equity as alternate in order to beat the inflation.
Apart from that Low Cost ULIPs (2.5 L Limit per person) as one of the option to save the tax- ICICI & HDFC ULIPs are doing well, ULIPs are simplified and charges are lesser compared to MFs in terms of long term, Various fund option including passive funds are introduced.
GST 2.0 is a reform which can aid in Auto/ FMCG / Home Appliances sales will get a boost due to the festival season.
Since market is volatile, use the dips (Opportunity) and buy through SIP or through multiple parcel in these uncertain times with a goal of 3-5 years.
Nifty Short Term Supports:
1.25200 ( 25154 Aug 2025 high)
2.25350 ( Fibonacci resistance shown )
3.25450 ( 25442 is the Aug 2025 high)
4. 25500 ( 25441 Sep 18th 2025 High )
5. 24700 (Trend Line as shown)
6. 24000-24170 (Fibonacci Retracements Supports- Two Supports in this zone 24116 & 24171 as shown)
Medium Term Support:
1. 23500-23700 (Fibonacci Retracements Supports- Two Supports in this zone 23608 & 23707 as shown)
2. 23000
Resistance ( Multiple Resistances are there between 25000-25650):
1. 25000
2.
Medium Term:
1.25670 ( Jun 2025 High) Should cross this resistance in short term decisively inorder to move up.
2.26269 ( Sep 2024 High)

TCS - H1 - Triangle Breakout (19.10.2025)📊 Setup Overview:
TCS is showing a Triangle Breakout formation on the H1 chart. Price has been consolidating within converging trendlines, and a cloud crossover hints at a possible momentum shift. This setup could lead to a directional breakout opportunity for short-term traders.
📈 Trade Plan:
Bias: Bearish below the breakout zone
Sell Entry Zone: Below 2950 (after candle close confirmation)
1st Target: 2877 ✅
2nd Target: 2814 🎯
Resistance Zone: 3010 – 3030
🧩 Technical Confluence:
1.Price rejected from upper trendline multiple times
2.Ichimoku Cloud crossover signals short-term weakness
3.Lower highs formation confirms loss of bullish momentum
4.Volume profile shows high interest near 2900, indicating potential liquidity zone
#TCS #NSE #StockMarketIndia #TechnicalAnalysis #TriangleBreakout #Ichimoku #PriceAction #SwingTrading #StocksToWatch #IndianStocks #Nifty50 #TradingView #ChartsDontLie #Kabhi_Ta_Trading #BearishSetup
💡 Fundamental View:
TCS, India’s leading IT services giant, remains fundamentally strong with consistent revenue from global clients and robust digital transformation projects.
However, recent IT sector consolidation and global tech budget tightening could create short-term selling pressure. The stock’s medium-term outlook remains positive, but near-term corrections may occur before a fresh rally.
⚠️ Disclaimer:
This analysis is for educational and informational purposes only and should not be considered as financial advice. Always use proper risk management and confirm setups with your own analysis before trading or investing.
💬 Support the Analysis:
If this chart helped you — LIKE 👍, COMMENT 💬 your views, and FOLLOW ✅ for daily market insights, chart patterns, and trade setups!

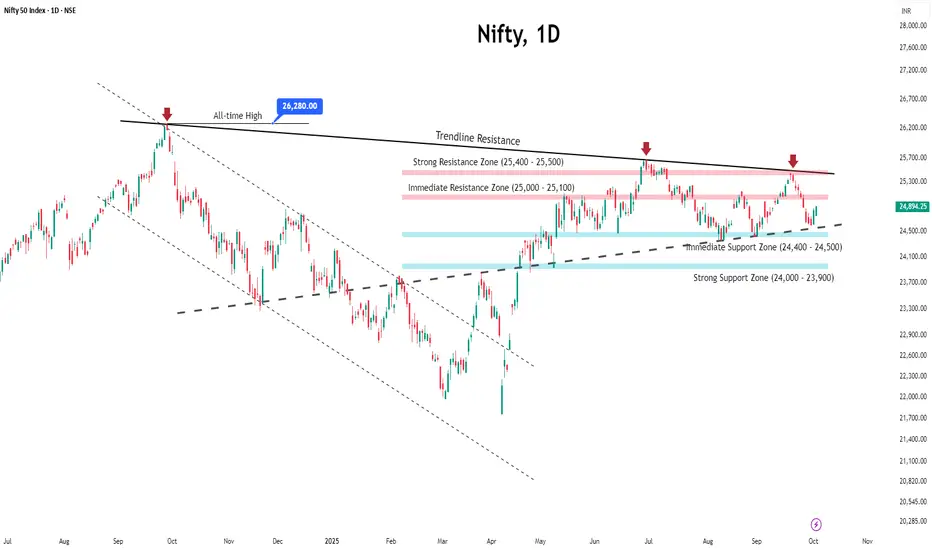
Weekly Market Wrap: Nifty Eyes All-Time HighsNifty closed the week at 25,709, gaining 400 points from the previous week’s close — marking another strong performance! It made a high of 25,781 and a low of 25,060.
As I highlighted last week, Nifty was expected to trade within the 25,700–24,850 range — and while it briefly broke out by 80 points, it closed right back within the range, showing controlled optimism.
Technical Outlook:
The monthly charts of both Nifty and Bank Nifty are now showing signs of forming a bullish W-pattern, which typically indicates trend reversal and strength. If Nifty manages to sustain above 25,900, we could see it rally towards its all-time high of 26,277, followed by the important Fibonacci level of 26,492.
On the downside, a pullback towards 25,450–25,500 could offer a great buy-on-dips opportunity for fresh long positions.
Next Week’s Range Expectation:
With a holiday-shortened week ahead (holiday on Wednesday and only a 1-hour trading session on Tuesday), expect Nifty to remain range-bound between 26,200–25,250. A breakout beyond these levels could spark some serious fireworks!
Big Picture View:
I continue to remain optimistic about India’s growth story. Over the coming years, I expect:
Nifty to reach 44,000+
Sensex to touch 1,44,000+
Of course, there will be healthy pullbacks and corrections along the way — offering smart investors a chance to accumulate at better valuations.
💡 Investment Ideas:
To participate in India’s long-term growth journey, consider systematic investments in:
NiftyBees, MidcapBees, SmallCapBees & GoldBees
Also, keep an eye on the Banking, Auto, and Infrastructure sectors — all showing strong bullish setups for the next few weeks.
Global Markets – S&P 500 Update:
The S&P 500 closed at 6,664, up nearly 110 points for the week, forming an inside candle on the weekly chart.
A move above 6,715 can push it towards 6,760 / 6,780 / 6,930 / 6,959 (key resistance levels).
On the downside, 6,555 and 6,384 are crucial supports — as long as 6,384 holds, it remains a buy-on-dips market for me.
Wishing everyone a very Happy & Prosperous Diwali!
May this festival of lights bring you wealth, wisdom, and winning trades!

Trendline Breakout and 1year high for NiftyNifty is at 1 year high at 25709 after making an yearly high of 25781.50. The trendline breakout has been achieved. All that we need for Nifty to grow from here is that the breakout should sustain. Also no negative news on Tariff front or any Geopolitical issue will be required for Nifty to forge its way ahead.
Supports For Nifty: Supports for Nifty are at 25378 (Important Fibonacci support), 24865 and 24333 (Strong Mother line support of 52 weeks.)
Resistances for Nifty are at: 25843, 26044 (Important Fibonacci resistance), 26277 (Previous All time high), 26529 (Fibonacci Golden ratio strong resistance) and finally 27470. After closing above 27470 doors for 28K will open directly.
To know more about Fibonacci retracement, Mother Father lines and my Mother, Father small Child theory, Fundamental analysis and how to draw charts or use Techno-Funda analysis do read my book the Happy Candles Way To Wealth Creation rated 4.8/5 on Amazon.
Things are looking good after a long time. Shadow of weekly candle is positive (Green). Hope some Geopolitical event or Tariff related news or weak earnings season does not spoil the chart again.
Disclaimer: The above information is provided for educational purpose, analysis and paper trading only. Please don't treat this as a buy or sell recommendation for the stock or index. The Techno-Funda analysis is based on data that is more than 3 months old. Supports and Resistances are determined by historic past peaks and Valley in the chart. Many other indicators and patterns like EMA, RSI, MACD, Volumes, Fibonacci, parallel channel etc. use historic data which is 3 months or older cyclical points. There is no guarantee they will work in future as markets are highly volatile and swings in prices are also due to macro and micro factors based on actions taken by the company as well as region and global events. Equity investment is subject to risks. I or my clients or family members might have positions in the stocks that we mention in our educational posts. We will not be responsible for any Profit or loss that may occur due to any financial decision taken based on any data provided in this message. Do consult your investment advisor before taking any financial decisions. Stop losses should be an important part of any investment in equity.

Strong Breakout for Nifty as it becomes a runaway train.After crossing the mid-channel resistance. Nifty has become a runaway train which has entered and overbought zone on hourly chart as it closed at 25585 with few critical resistances coming to fore. Channel top seems to be just near 26K at 25956. Other critical resistances are at 25586, 25698 and 25786 before it reaches 25956 or 26K. Support for Nifty at this juncture are at 25442, 25323, 25252 (Mother line support and the mid-channel support). Father line support is at 25064. Much required closing above 25500 has lifted the spirits of investors. With key resistances ahead and Nifty being overbought little correction or consolidation would be ideal before it can scale further heights.
Disclaimer: The above information is provided for educational purpose, analysis and paper trading only. Please don't treat this as a buy or sell recommendation for the stock or index. The Techno-Funda analysis is based on data that is more than 3 months old. Supports and Resistances are determined by historic past peaks and Valley in the chart. Many other indicators and patterns like EMA, RSI, MACD, Volumes, Fibonacci, parallel channel etc. use historic data which is 3 months or older cyclical points. There is no guarantee they will work in future as markets are highly volatile and swings in prices are also due to macro and micro factors based on actions taken by the company as well as region and global events. Equity investment is subject to risks. I or my clients or family members might have positions in the stocks that we mention in our educational posts. We will not be responsible for any Profit or loss that may occur due to any financial decision taken based on any data provided in this message. Do consult your investment advisor before taking any financial decisions. Stop losses should be an important part of any investment in equity.

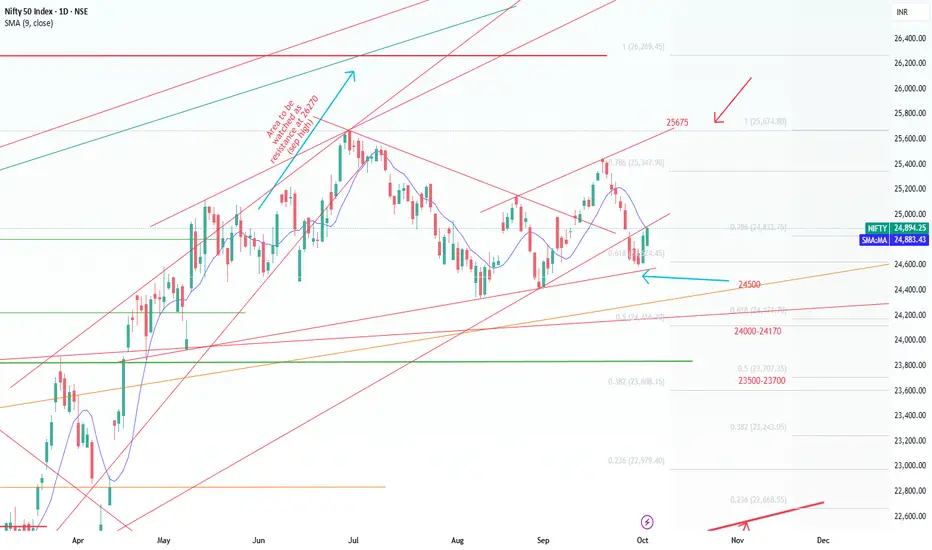
Nifty Short & Medium Term Support&Resistance_13-Oct to 17-Oct-25Nifty Short & Medium Term Support&Resistance_13-Oct to 17-Oct-25
Nifty 24894
As predicted last week, Nifty very well hold the 24500 Support and currently moved near to the first resistance 25000.
One more positive decisive break above Ist Short Term Resistance as given below in order market to move up.
Quarterly result started coming out slowly, TCS posted average result, Warree Renewables posted vgood results (PE is very high) .
Qtrly Results and Tariffs deal will decide the future path of the Nifty. Since it is a Volatile situation SIP route or buy in multiple parcel route with a goal of 3-5 years will workout.
Recent 100% additional tariff on China got severe effect on US market on Friday, it will affect global other trade markets too on Monday. Mainly due to the uncertainty prevailing over.
However, for India though initial drop market tend to move up to 25670 ( Jun 2025 all time high).
Repo and FD rate reduction by RBI, people may have to choose Debt/Commodity/Equity as alternate in order to beat the inflation.
Apart from that Low Cost ULIPs (2.5 L Limit per person) as one of the option to save the tax- ICICI & HDFC ULIPs are doing well, ULIPs are simplified and charges are lesser compared to MFs in terms of long term, Various fund option including passive funds are introduced.
Market was on decline/ Consolidation mode recently because of new Tariff's imposed by Trump mainly on Pharma and IT - H1 B Visa and Tax for Outsourcing IT and the recent pharma tarrifs imposition.
GST 2.0 is a reform which can aid in Auto/ FMCG / Home Appliances sales will get a boost due to the festival season.
Since market is volatile, use the dips (Opportunity) and buy through SIP or through multiple parcel in these uncertain times with a goal of 3-5 years.
Nifty Short Term Supports:
1. 24500 (Trend Line as shown)
2. 24000-24170 (Fibonacci Retracements Supports- Two Supports in this zone 24116 & 24171 as shown)
Medium Term Support:
3. 23500-23700 (Fibonacci Retracements Supports- Two Supports in this zone 23608 & 23707 as shown)
4. 23000
Resistance ( Multiple Resistances are there between 25000-25650):
1. 25000
2. 25200 ( 25154 Aug 2025 high)
3.25350 ( Fibonacci resistance shown )
4.25450 ( 25442 is the Aug 2025 high)
3. 25500 ( 25441 Sep 18th 2025 High )
Medium Term:
1.25670 ( Jun 2025 High) Should cross this resistance in short term decisively inorder to move up.
2.26269 ( Sep 2024 High)
Uncertainty can prevail with latest Trump Tariff Tantrum.The chart indicates a Trend line resistance near 25323 which Nifty was set to overhaul but latest Trump Tariff Tantrum has potential to derail the progress again. This time the announcement is 100% tariff on China. Global markets, Crypto and Gift Nifty is showing weakness due to the announcement which will be effective from 1st November.
Resistance for Nifty are at 25323 (Trend line resistance), 25438, 25565 and finally channel top at 25702. Supports for Nifty are at 25215, 25087 (Mother line support), 24987 (Father line support), 24922 and 24750 is the channel bottom support. Shadow of the candle was positive to neutral but this tariff announcement has turned it negative as of now. Let us see how the cookie crumbles next week.
To know mover about Mother line, Father line, Mid channel support / resistance, Chanel top resistnace and channle bottom support, trend line support and resistance (To understand the role of Mother line and Father line) or to be able to draw resistances and supports based on historic peaks and valleys you can read my book THE HAPPY CANDLES WAY TO WEALTH CREATION. The book is available in Amazon in paperback or Kindle version and is rated 4.8/5. This book teaches you Techno-Funda investing. (Techno Funda investing means Knowing which are Fundamentally strong companies and investing / booking profits / staying invested in them based on Technical analysis). The book has some more unique features like rating a stock with the help of Happy Candles Number wherein you can give a stock marks out of 100 based on Techincal and Fundamental analysis you have learned by reading it. Thus you can know if the stock is currently investible or not based on the marks it scores out of 100. The book also covers various aspect of behavioural finance. Lot of people who have read the book consider it as a hand book to equity investing. Buy the book you will not be dissapointed as the book is reasonably priced. Search by the key words The Happy Candles Way to wealth creation and you will get it.
Disclaimer: The above information is provided for educational purpose, analysis and paper trading only. Please don't treat this as a buy or sell recommendation for the stock or index. The Techno-Funda analysis is based on data that is more than 3 months old. Supports and Resistances are determined by historic past peaks and Valley in the chart. Many other indicators and patterns like EMA, RSI, MACD, Volumes, Fibonacci, parallel channel etc. use historic data which is 3 months or older cyclical points. There is no guarantee they will work in future as markets are highly volatile and swings in prices are also due to macro and micro factors based on actions taken by the company as well as region and global events. Equity investment is subject to risks. I or my clients or family members might have positions in the stocks that we mention in our educational posts. We will not be responsible for any Profit or loss that may occur due to any financial decision taken based on any data provided in this message. Do consult your investment advisor before taking any financial decisions. Stop losses should be an important part of any investment in equity.

Nifty on the verge of a Trendline breakout. Nifty did a great job today by closing above a very important resistance of 25128. Now the major hurdle seems to be near the trendline which is near 25228. Once this range is crossed the next hurdles will be at 25306, 25431 and channel top near 25579. The supports for Nifty are at 25128. Mother line support near 25021 which is also a mid channel support. (Making this area a very strong support). Followed by 24965 (Father line support). If by chance father line support is broken we can see Nifty falling towards 24806 or even 24601 which is the channel bottom support. As of now the shadow of the candle seems to be positive (Green).
To know mover about Mother line, Father line, Mid channel support / resistance, Chanel top resistnace and channle bottom support, trend line support and resistance (To understand the role of Mother line and Father line) or to be able to draw resistances and supports based on historic peaks and valleys you can read my book THE HAPPY CANDLES WAY TO WEALTH CREATION. The book is available in Amazon in paperback or Kindle version and is rated 4.8/5. This book teaches you Techno-Funda investing. (Techno Funda investing means Knowing which are Fundamentally strong companies and investing / booking profits / staying invested in them based on Technical analysis). The book has some more unique features like rating a stock with the help of Happy Candles Number wherein you can give a stock marks out of 100 based on Techincal and Fundamental analysis you have learned by reading it. Thus you can know if the stock is currently investible or not based on the marks it scores out of 100. The book also covers various aspect of behavioural finance. Lot of people who have read the book consider it as a hand book to equity investing. Buy the book you will not be dissapointed as the book is reasonably priced. Search by the key words The Happy Candles Way to wealth creation and you will get it.
Disclaimer: The above information is provided for educational purpose, analysis and paper trading only. Please don't treat this as a buy or sell recommendation for the stock or index. The Techno-Funda analysis is based on data that is more than 3 months old. Supports and Resistances are determined by historic past peaks and Valley in the chart. Many other indicators and patterns like EMA, RSI, MACD, Volumes, Fibonacci, parallel channel etc. use historic data which is 3 months or older cyclical points. There is no guarantee they will work in future as markets are highly volatile and swings in prices are also due to macro and micro factors based on actions taken by the company as well as region and global events. Equity investment is subject to risks. I or my clients or family members might have positions in the stocks that we mention in our educational posts. We will not be responsible for any Profit or loss that may occur due to any financial decision taken based on any data provided in this message. Do consult your investment advisor before taking any financial decisions. Stop losses should be an important part of any investment in equity.

Nifty Analysis EOD – October 6, 2025 – Monday🟢 Nifty Analysis EOD – October 6, 2025 – Monday 🔴
Bulls charge ahead, closing near the highs with firm control
🗞 Nifty Summary
Nifty opened with a 35-point gap up, starting above the Previous Day High (PDH) — a sign of early bullish momentum. The first 15 minutes saw a quick gap-fill, followed by a steady and strong rally throughout the day.
The index paused briefly at the 24,990–25,000 resistance zone, consolidated, and after breaking above 25,020, continued upward to test the next resistance level at 25,085. Despite multiple breakout attempts, this level held strong and acted as the day’s ceiling.
Nifty finally closed at 25,072.55, very near the high of the day, confirming bullish strength and follow-through after the previous week’s recovery.
Overall, today’s session displayed controlled bullish momentum, broad participation, and rising conviction. The day’s range was 214.30 points, exceeding the Gladiator’s Average Range (183.19) — signaling expansion and trend continuation.
Now, the next hurdles for bulls lie at 25,115 and 25,240, both key structural resistance zones.
🛡 5 Min Intraday Chart with Levels
🛡 Intraday Walk
Opened Gap-Up by 35 pts above PDH.
Early pullback filled the gap within 15 mins.
From there, steady rally towards 24,990–25,000 resistance.
Breakout above 25,000 led to a sharp push to 25,085.
Multiple failed breakout attempts beyond 25,085.
Closed strong at 25,072.55, near the day high.
📉 Daily Time Frame Chart with Intraday Levels
🕯 Daily Candle Breakdown
Open: 24,858.25
High: 25,072.55
Low: 24,858.25
Close: 25,072.55
Range: 214.30 pts
Change: +179.55 (+0.72%)
🏗️ Structure Breakdown
Green body with minimal lower wick → strong bullish structure.
Large body (~214 pts) → clear directional day.
Close near high → strong buying conviction.
📚 Interpretation
Market opened strong and sustained momentum throughout.
Buying continued above 25,000, confirming follow-through from Oct 3 session.
The close near the highs suggests a potential move toward 25,115–25,240 next.
🕯Candle Type
Bullish Marubozu-type (open near low, close near high).
Signals decisive buyer dominance and trend continuation.
🛡 5 Min Intraday Chart
⚔️ Gladiator Strategy Update
ATR: 183.19
IB Range: 86.2 → Medium
Market Structure: Imbalanced
Trade Highlights:
09:40 Long Trade – Target Achieved (R:R 1:1.92)
12:45 Long Trade – Target Achieved (R:R 1:3.52)
📌 What’s Next? / Bias Direction
Bias: Bullish
As long as 25,000–25,048 holds, buyers retain control.
A breakout above 25,115 may accelerate momentum toward 25,240 and possibly 25,330.
📌 Support & Resistance Levels
Resistance Zones:
25115
25140 ~ 25165
25240
Support Zones:
25048
25000 ~ 24990
24900 ~ 24915
💡 Final Thoughts
“Momentum is built one breakout at a time — and sustained when structure supports conviction.”
The market tone remains positive as bulls continue defending key levels with strong follow-through.
✏️ Disclaimer
This is just my personal viewpoint. Always consult your financial advisor before taking any action.

Great Closing above Motherline of Daily Chart. Nifty has given a brilliant closing above Mother line of daily chart and key psychological level of 25K at 25077. Supports for Nifty are at Mother line 24899, Trend line support at 24598 and finally Father line support at 24417. Resistances are at 25161, 25316 and 25450 and finally 25640.
Above 25640 there will be a major Bullish breakout which can take us to 26K or even previous All time high or even beyond it. It will be very important for Nifty to hold the levels now and again not go below the Mother or Father line otherwise again all the momentum that has built in favour of the rally will vanish as quickly.
Having said that RSI, MACD and shadow of the candle suggest are oozing with confidence this time let us see what this week and month holds for us, things look good as of now.
Disclaimer: The above information is provided for educational purpose, analysis and paper trading only. Please don't treat this as a buy or sell recommendation for the stock or index. The Techno-Funda analysis is based on data that is more than 3 months old. Supports and Resistances are determined by historic past peaks and Valley in the chart. Many other indicators and patterns like EMA, RSI, MACD, Volumes, Fibonacci, parallel channel etc. use historic data which is 3 months or older cyclical points. There is no guarantee they will work in future as markets are highly volatile and swings in prices are also due to macro and micro factors based on actions taken by the company as well as region and global events. Equity investment is subject to risks. I or my clients or family members might have positions in the stocks that we mention in our educational posts. We will not be responsible for any Profit or loss that may occur due to any financial decision taken based on any data provided in this message. Do consult your investment advisor before taking any financial decisions. Stop losses should be an important part of any investment in equity.
Weekly Market Wrap: Nifty, BankNifty & S&P 500 OutlookNifty closed the week at 24894, gaining 240 points from the previous week. The index made a high of 24904 and a low of 24587, once again respecting the range I mentioned last week — 25050–24250.
From the week’s low of 24587, we’ve seen a sharp bounce back toward 24900, exactly as projected.
Nifty Outlook for Next Week
For the coming week, I expect Nifty to trade between 25300–24500.
A breakout or breakdown beyond this range could bring some real fireworks
Bullish Scenario:
If Nifty sustains above 24900/24950 on Monday, we could see a rally toward 25300, supported by strength in Banking, Financials, and Metal sectors.
Bearish Scenario:
Below 24750, bears might get an opening to drag Nifty toward 24500 — though, as of now, that looks less likely unless global sentiment weakens.
⚠️ Caution:
While short-term momentum looks positive, the monthly and weekly charts of Nifty still lack strong bullish confirmation. Those waiting to capture a big 800–1000-point breakout move should be patient until we see a clear bullish crossover on higher timeframes.
Sector Spotlight: Metals
As mentioned last week, Metals continued to shine, with the Metal Index up 4% this week!
It also gave an all-time high weekly close above 10220, a key breakout level.
If it sustains above 10220 next week, the index can rally another 4% toward the next major resistance at 10709.
👉 Keep your eyes on metal stocks hitting new all-time highs (ATHs) — momentum could stay strong here.
BankNifty Update
BankNifty is forming a W pattern on the weekly timeframe — a strong bullish reversal formation.
Stay alert for potential breakouts in leading banking stocks, as they might fuel the next leg of the rally.
Global Cues – S&P 500
The S&P 500 gave an all-time high close at 6715, up 72 points from last week.
If it sustains above 6700, expect a move toward 6780.
For investors already long — move your trailing SL to 6560 to protect profits.
For those waiting to enter — 6568/6570 offers a better risk–reward entry zone.
Key Takeaways
✅ Nifty range for next week: 25300–24500
✅ Bulls need 24950+ for continuation; bears only active below 24750
✅ Metals remain the sector leader
✅ BankNifty W pattern could fuel the next upmove
✅ S&P 500 remains in a strong uptrend — global sentiment supportive

Nifty Short & Medium Term Support&Resistance_5-Oct to 10-Oct-25Nifty Short & Medium Term Support&Resistance_5-Oct to 10-Oct-25
Nifty very well hold the 24500 Support and currently near to the trend line support (as drawn) as mentioned last week.
Repo rate reduction by RBI boosted the market as there will be more liquidity in the market and it will aid more loan disbursal. But there is a small concern is FD rate reduction and inflation may go little higher.
Last two days trade reflected it and market moved up, one more positive decisive break can take to short term resistance.
Quarterly result and Tariffs deal will decide the future path of the Nifty. Since it is a Volatile situation SIP route or buy in multiple parcel route with a goal of 3-5 years will workout.
Since FD rate reduction, people may have to choose Debt/Commodity/Equity as alternate in order to beat the inflation.
Apart from that Low Cost ULIPs (2.5 L Limit per person) as one of the option to save the tax- ICICI & HDFC ULIPs are doing well, ULIPs are simplified and charges are lesser compared to MFs in terms of long term, Various fund option including passive funds are introduced.
Market was on decline/ Consolidation mode recently because of new Tariff's imposed by Trump mainly on Pharma and IT - H1 B Visa and Tax for Outsourcing IT and the recent pharma tarrifs imposition.
GST 2.0 is a reform which can aid in Auto/ FMCG / Home Appliances sales will get a boost due to the festival season.
Since market is volatile, use the dips (Opportunity) and buy through SIP or through multiple parcel in these uncertain times with a goal of 3-5 years.
Nifty Short Term Supports:
1. 24500 (Trend Line as shown)
2. 24000-24170 (Fibonacci Retracements Supports- Two Supports in this zone 24116 & 24171 as shown)
Medium Term Support:
3. 23500-23700 (Fibonacci Retracements Supports- Two Supports in this zone 23608 & 23707 as shown)
4. 23000
Resistance ( Multiple Resistances are there between 25000-25650):
1. 25000
2. 25200 ( 25154 Aug 2025 high)
3.25350 ( Fibonacci resistance shown )
3. 25500 ( 25441 Sep 18th 2025 High )
Medium Term:
1.25670 ( Jun 2025 High) Should cross this resistance in short term decisively inorder to move up.
2.26269 ( Sep 2024 High)
Positive Sentiment Drives Nifty Higher, Resistance in SightThe Nifty 50 closed the week on a positive note, rising nearly 1%, supported by strong macro cues and sectoral gains.
RBI Policy Boost:
The Reserve Bank of India kept the repo rate unchanged at 5.50% for the second straight meeting while raising FY26 GDP growth to 6.8% and lowering the inflation forecast — a move that lifted overall market sentiment.
Sector Highlights:
Banking stocks led the rally, with Bank Nifty up over 2% as private lenders like Kotak Mahindra Bank and Axis Bank posted solid gains.
Metals also shined, with Nifty Metal up 1.85%, driven by optimism over potential Fed rate cuts and a weaker dollar.
Key Levels to Watch:
Resistance: 25,000–25,100 remains a tough barrier. A breakout above 25,100 could spark a rally toward 25,400.
Support: 24,400–24,500 is the key zone to hold. A dip below this may trigger renewed selling pressure
Outlook:
The market is expected to consolidate within the current range, with sector rotation likely to drive short-term moves. Overall sentiment remains constructive as long as Nifty holds above key support levels.
Nifty Analysis EOD – October 3, 2025 – Thursday🟢 Nifty Analysis EOD – October 3, 2025 – Thursday 🔴
Bulls stamp authority with a strong close near the highs
🗞 Nifty Summary
Nifty opened with a 67-point gap down at 24,785.70, and the first 5-min candle was wild, spanning 97 points. The initial upmove managed to fill the gap but couldn’t sustain above, slipping back quickly.
The IB Range (24,747.55 – 24,855.70) set the tone, and for most of the session (until 2:40 PM), the index swung wildly inside this wide band, offering multiple trade opportunities on both sides.
Around 2:10 PM, a trendline false breakdown (liquidity trap) shook out bears. Soon after, bulls reclaimed control, breaking the trendline, PDC, and PDH, and pushed the index to a new day high of 24,904.80. Nifty closed strong at 24,895, almost at the high, firmly above the previous day’s high.
The session was energetic for traders, packed with volatility and clean structure, and the close reinforced bullish continuation.
🛡 5 Min Intraday Chart with Levels
🛡 Intraday Walk
Gap down open at 24,785.70.
First 5-min candle = 97 points → extreme volatility.
IB Range set between 24,747 – 24,856, market chopped inside until 2:40 PM.
2:10 PM: False breakdown trap → liquidity grab.
Bulls took charge → breakout above IB, PDC, and PDH.
Day high: 24,904.80 → close: 24,895 (near highs).
📉 Daily Time Frame Chart with Intraday Levels
🕯 Daily Candle Breakdown
Open: 24,759.55
High: 24,904.80
Low: 24,747.55
Close: 24,894.25
Change: +57.95 (+0.23%)
🏗️ Structure Breakdown
Solid green body: ~134.7 pts.
Range: ~157.25 pts (moderate).
Very tiny upper/lower wicks.
📚 Interpretation
Flat-to-weak open, dip to 24,747, then steady climb.
Closing almost at the high = strong conviction.
Minimal rejection → clean bullish candle.
🕯Candle Type
Bullish Marubozu (near-perfect) → Buyers in full control.
Confirms continuation of bullish reversal from Oct 1st.
🛡 5 Min Intraday Chart
⚔️ Gladiator Strategy Update
ATR: 179.73
IB Range: 108.15 → Wide
Market Structure: Balanced
Trade Highlights
11:10 Long Trade – Target Achieved (R:R 1:2.08)
14:10 Short Trade – SL Hit
14:35 Long Trade – Target Achieved (R:R 1:3.96)
📌 What’s Next? / Bias Direction
Bias: Bullish continuation.
If bulls clear 25,000 with momentum, the next leg may unfold toward 25,115–25,250. Supports at 24,785–24,830 need to hold for trend continuity.
📌 Support & Resistance Levels
Resistance Zones:
24890 ~ 24915
24990 ~ 25000
25048
25085
25115
Support Zones:
24830
24785
24745
💡 Final Thoughts
“Markets often test patience with traps before rewarding conviction with momentum. Today’s close above PDH is a classic sign of strength.”
✏️ Disclaimer
This is just my personal viewpoint. Always consult your financial advisor before taking any action.

V-Shape recovery in progress for Nifty. Today we will try to study Nifty chart on an hourly scale. Hourly scale means the candles that we see in the chart represent nifty movement for 1 hour each. Each candle represents 1 hour movement of Nifty. Now let us watch closely what happened here.
1) We can see that after reaching a high of 25448 on September 25th. Nifty declined sharply. Then it consolidate in the range of 24587 and 24748. After this it moved upwards and hit the mother line at 24867.
2) As we know when the stock or index is below the Mother line the line acts as a resistance. Next 7 candles could not give closing above this line as it was a strong resistnace.
3) During the last two hours of trade we got a closing above the mother line thus it has now become a support. right now the Mother line is at 24846. So this level will be our immediate support. Below this level other supports will be at 24748 and 24587.
4) The Father line resistnace is at 24922 this level will be our immediate resistance. If we get a closing above this level the next resistances will be at 25032, 25139, 25255, 25358 and 25451. If and when we get a closing above 25451 it will be a strong Bullish breakout.
Supports and resistances other than Mother and Father line are derived by historical peaks and valleys. Mother and Father line/Support and resistance are nothing but exponential Moving averages. Mother line is 50 EMA and Father line 200 EMA.
As this is an hourly chart, Mother line is 50 Hours exponential moving average and Father line is 200 hours exponential moving average. In case of daily, weekly or monthly charts. The EMA will be 50 days, weeks or Months respectively.
To know mover about patterns such as V pattern seen here or Mother Father and Small Child theory (To understand the role of Mother line and Father line) or to be able to draw resistances and supports based on historic peaks and valleys you can read my book THE HAPPY CANDLES WAY TO WEALTH CREATION. The book is available in Amazon in paperback or Kindle version and is rated 4.8/5. This book teaches you Techno-Funda investing. (Techno Funda investing means Knowing which are Fundamentally strong companies and investing / booking profits / staying invested in them based on Technical analysis). The book has some more unique features like rating a stock with the help of Happy Candles Number wherein you can give a stock marks out of 100 based on Techincal and Fundamental analysis you have learned by reading it. Thus you can know if the stock is currently investible or not based on the marks it scores out of 100. The book also covers various aspect of behavioural finance. Lot of people who have read the book consider it as a hand book to equity investing. Buy the book you will not be dissapointed as the book is reasonably priced. Search by the key words The Happy Candles Way to wealth creation and you will get it.
Disclaimer: The above information is provided for educational purpose, analysis and paper trading only. Please don't treat this as a buy or sell recommendation for the stock or index. The Techno-Funda analysis is based on data that is more than 3 months old. Supports and Resistances are determined by historic past peaks and Valley in the chart. Many other indicators and patterns like EMA, RSI, MACD, Volumes, Fibonacci, parallel channel etc. use historic data which is 3 months or older cyclical points. There is no guarantee they will work in future as markets are highly volatile and swings in prices are also due to macro and micro factors based on actions taken by the company as well as region and global events. Equity investment is subject to risks. I or my clients or family members might have positions in the stocks that we mention in our educational posts. We will not be responsible for any Profit or loss that may occur due to any financial decision taken based on any data provided in this message. Do consult your investment advisor before taking any financial decisions. Stop losses should be an important part of any investment in equity.

Nifty Analysis EOD – October 1, 2025 – Wednesday 🟢 Nifty Analysis EOD – October 1, 2025 – Wednesday 🔴
Bulls kick off October with a breakout surge
🗞 Nifty Summary
Nifty opened flat, dipped slightly, and then rallied 85 points from the low. The index repeatedly tried to break the 24,675–24,685 resistance zone, but early attempts failed. With support holding at PDC, an ascending triangle pattern formed, and its breakout finally ignited a 130-point rally to 24,800, meeting the pattern target.
After a retracement to 24,750 support, a trendline breakout around 2 PM added another 80 points, marking the day’s high at 24,867.95. Nifty closed strong at 24,853.40, near the high of the day.
The first trading day of October turned out to be a sentiment shift, with bulls firmly in control. The day’s 262-point range nearly engulfed the last three sessions combined, with a close at the highest high in 3 days.
🛡 5 Min Intraday Chart with Levels
🛡 Intraday Walk
Flat open → dip to 24,606.
85-pt rally attempts 24,675–24,685 resistance, multiple failures.
Support at PDC → ascending triangle breakout, rally to 24,800.
Pullback → support at 24,750.
2:00 PM → trendline breakout, sharp +80-pt rally.
Day high: 24,867.95, close: 24,853.40 (near high).
📉 Daily Time Frame Chart with Intraday Levels
🕯 Daily Candle Breakdown
Open: 24,620.55
High: 24,867.95
Low: 24,605.95
Close: 24,836.30
Change: +225.20 (+0.92%)
🏗️ Structure Breakdown
Large green body (~215.75 pts).
Wide range: 262 pts.
Tiny wicks → minimal rejection.
📚 Interpretation
Buyers stepped in strongly from 24,600 zone.
Trend sustained all day, with close near high.
Momentum shifted firmly to the bulls.
🕯Candle Type
Bullish Marubozu-like candle → strong, decisive buyer dominance.
🛡 5 Min Intraday Chart
⚔️ Gladiator Strategy Update
ATR: 173.37
IB Range: 95.80 → Medium
Market Structure: Balanced
Trade Highlights
11:05 Long Trade – Target Achieved (R:R 1:3.63)
14:00 Long Trade – Trailing SL Hit (R:R 1:3.12)
📌 What’s Next? / Bias Direction
Bias has turned bullish above 24,750. A close above 24,870 could open the gates toward 24,980–25,000, while 24,600 remains the key downside base.
📌 Support & Resistance Levels
Resistance Zones:
24868
24890 ~ 24915
24990 ~ 25000
25048.75
Support Zones:
24775 ~ 24750
24735
24685 ~ 24675
💡 Final Thoughts
“Momentum loves confirmation — when resistance breaks and holds, the market often rewards patience with decisive follow-through.”
✏️ Disclaimer
This is just my personal viewpoint. Always consult your financial advisor before taking any action.

Strong Base Formed ! Nifty Positioned for Explosive Move This is the daily timeframe chart of Nifty 50.
Nifty 50 is sustaining above the LOP support zone around 24,400–24,500. The index has formed an ascending broadening wedge pattern at this support and appears to be completing the last leg of the structure.
Support Zone: 24,500–24,550
Resistance Zone: 25,600–25,800
If the support zone holds, we may see higher prices in Nifty 50 in the coming sessions.
Thank you.

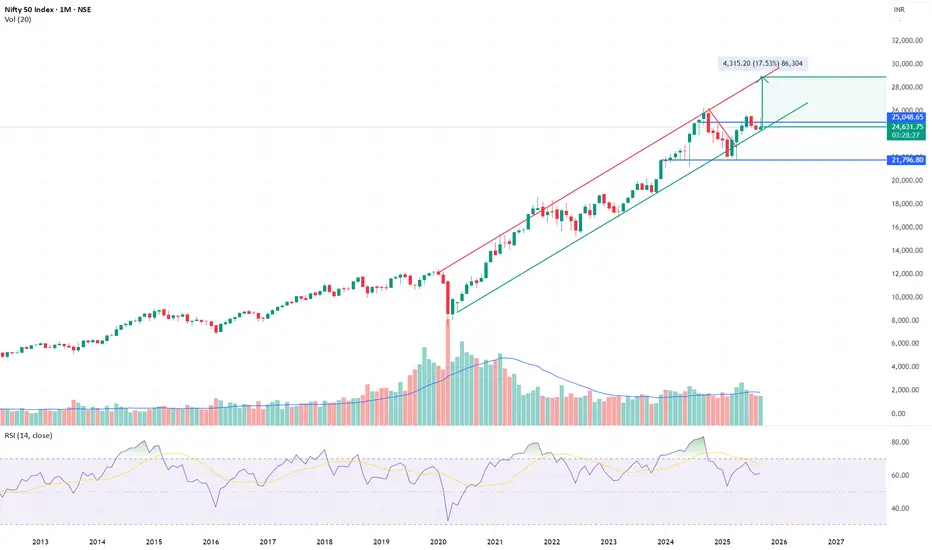
NIFTY 50 – Holding Lower Channel, Eyeing Continuation Above 26kNIFTY is respecting the lower boundary of its long-term upward channel near 24.5–24.6k. This zone remains the key support for the secular uptrend.
Support: 24,000–24,200 must hold to preserve structure.
Trigger: A sustained break above 26,000 would mark continuation of the bull leg, with targets at 28,500–29,000.
Risk: Losing 24k opens room for a deeper slide toward the 21,800 channel base.
Macro Context: Domestic earnings growth remains constructive, but global liquidity, crude oil, and US yields will dictate the timing of the next leg.
Verdict: NIFTY is at the lower channel inflection, not the top. As long as 24k holds, the setup remains bullish, with 26k as the breakout trigger for continuation.
For educational purposes only. This is not investment advice.
Nifty Analysis EOD – September 29, 2025 – Monday 🟢 Nifty Analysis EOD – September 29, 2025 – Monday 🔴
Bulls wrestle, but bears still dictate the close
🗞 Nifty Summary
Nifty opened with a 39-point gap up, far below the 100+ points Gift Nifty indicated. After adding 32 more points, the index slipped to fill the gap, only to stage a strong recovery towards the 24,750–24,775 resistance zone.
At this zone, a Head & Shoulders pattern formed with a neckline at 24,735. Once broken, Nifty quickly tumbled below the day’s low, meeting the H&S target within minutes. After a brief box pattern breakdown, price dipped below the PDL — but this turned into a false breakdown trap, sparking a 132-point recovery back to the neckline level at 24,735.
Despite multiple bullish attempts, the neckline flipped into strong resistance. Bears regained control, dragging Nifty back below PDL, though another late bounce of 77 points lifted the close to 24,677.55.
Overall, the 185-point wide range offered rich intraday trading opportunities, but the close below PDC keeps the index in a bearish framework with no clear reversal yet.
🛡 5 Min Intraday Chart with Levels
🛡 Intraday Walk
Gap Up +39 pts, minor push to +71 pts, then slipped for gap fill.
Strong rebound to 24,750–24,775 resistance, rejected at neckline (H&S setup).
H&S breakdown → hit target quickly, flushed below day’s low.
False PDL breakdown → 132-pt recovery back to neckline (24,735).
Neckline polarity shift to resistance → multiple failed bull attempts.
Another bear move below PDL, but bulls rescued with 77-pt bounce into close.
📉 Daily Time Frame Chart with Intraday Levels
🕯 Daily Candle Breakdown
Open: 24,728.55
High: 24,791.30
Low: 24,606.20
Close: 24,634.90
Change: −19.80 (−0.08%)
🏗️ Structure Breakdown
Small red body (~93.65 pts).
Range: ~185.10 pts → decent volatility.
Upper wick: ~62.75 pts → sellers rejected upside.
Lower wick: ~28.70 pts → mild buying near lows.
📚 Interpretation
Bulls attempted a rally but met heavy resistance at 24,790.
Bears dragged price down to 24,606.
Close near low → bearish tilt despite recovery attempts.
🕯Candle Type
Small-bodied bearish candle → Spinning Top with bearish bias.
Signals indecision but sellers still defending control.
🛡 5 Min Intraday Chart
⚔️ Gladiator Strategy Update
ATR: 175.10
IB Range: 110.20 → Medium
Market Structure: ImBalanced
Trade Highlights:
11:30 Long Trade – Target Achieved (R:R 1:3.3)
📌 What’s Next? / Bias Direction
Bias remains bearish below 24,800. A sustained breach above this level can revive bullish momentum, else further weakness toward 24,600–24,420 is likely.
📌 Support & Resistance Levels
Resistance Zones:
24735
24750 ~ 24775
24868
24890 ~ 24915
24990 ~ 25000
25048
Support Zones:
24600 ~ 24572
24500
24430 ~ 24400
💡 Final Thoughts
“Markets don’t lie — they trap. False breakouts and breakdowns are the real test of discipline. Those who chase often lose, those who wait often win.”
✏️ Disclaimer
This is just my personal viewpoint. Always consult your financial advisor before taking any action.
