Again Nifty facing important Trendline resistance. 2024 first month has seen volatile, erratic, sudden tide to ebb and ebb to tide behaviour of Nifty which is at it's unpredictable best. The zone starting from 21741 to 21839 is having many resistances both small and big in addition to the trendline resistance. if Nifty is able to close above 21850 further journey towards 21966 and 22124+ is possible. Supports for Nifty are available at 21593 and 21464. If we get a closing below 21464 the Nifty may fall further to 21354, 21245 or 21136 levels. Usually budget days are marked with high volatility. Adding fuel to fire is the US FED meeting tonight. Do not take many / any high risk decisions tomorrow.
Nifty50

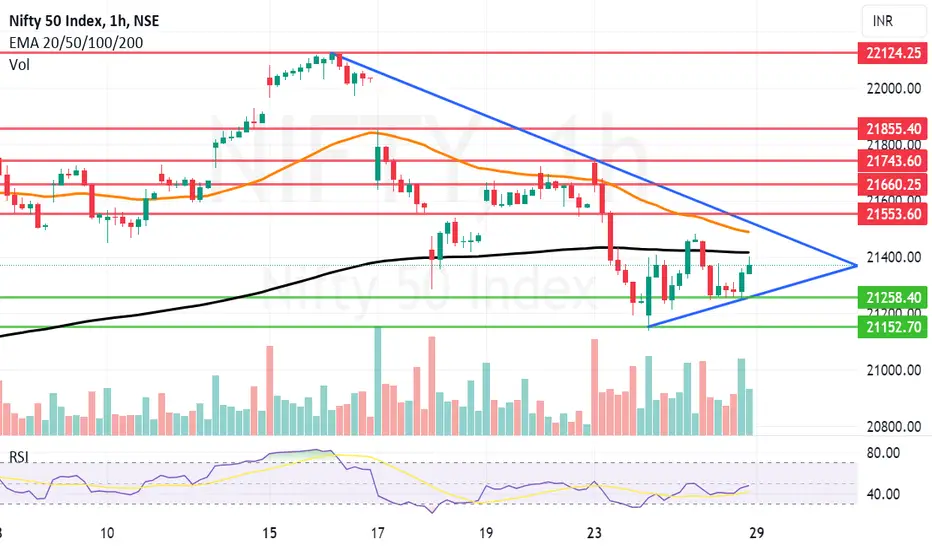
Trendline resistance 21800 works again to pull Nifty downTrendline resistance 21800 works again to pull Nifty down. This only shows that the strength of rally decreasing with extreme increase in volatility. There was a news of situation escalating in Middle East and US striving to take some action against the mess created by some disruptive forces in the Red sea. With this news there was selling and profit booking seen specially from the FIIs and Retail investors however DII remain net buyers and gave support to the market near 21500. How much support they can provide going deeper into the week is the question.
Nifty Supports will be at: 21500, 21448 (Major Support 200 hours EMA), 21258 and finally 21152. Below 21152 bears will start licking their fingers.
Nifty Resistances are ate: 21562 (Major resistance 50 hours EMA), 21660, 21723 (Major trendline resistance) and 21800-21820 range.

Nifty: Supply and DemandOn 17th January, supply exceeded demand. So, the support line has been broken.
The time will prove, whether:
1) Nifty will retest this level and fall further.
or
2) Nifty will breakout this level and trade in the upward channel again.

Nifty Intraday Levels : 30- Jan-24Currently Nifty Near at Resistance Zone...so wait for Rejections at zones
Bullish >21810
Bearish <21680
All views for Educational Purpose do your own analysis before initiate any trade.

Nifty Trapped between good support and strong resistance. Nifty again finds itself trapped between strong resistance zone which present between 22415 and 22488. Above 22488 Nifty can fly towards 21522, 21660 or even 21743 within this week. But crossing the 50 and 200 hours EMA at 22415 and 22448 (Mother and Father line will not be easy). On the lower side there is a strong support zone between 21258 to 21152. Below 21152 closing bears can take control of the market and thrash it further down. Nifty is interestingly poised. Nifty Shadow is positive but there was a news of Three US Marines killed in a Houthi attack on US Navy vessel. The possibility of US retaliation and escalating tension with Iran is a clear and present possibility so investors have to keep a keen eye on that development.
Very good Daily candle showing the fightback of NiftyWe saw a very good Daily candle showing the fightback of Nifty a closing above important résistance of 21421 indicates that we might be heading towards 21500+ tomorrow if global factors keep the things bright. In this case the resistance that Nifty will face will be at 21582(Major resistance), followed by 21684 and 21772. On the lower side the supports for Nifty will be at 21412, 21137 and 21080 (Major support 50 days EMA and Mid-Channel resistance). Things are poised interestingly with shadow the candle looking slightly positive for the start tomorrow.
Nifty on 2024 Jan 20
1) On 2023 Dec 4, Nifty had a gap up opening.
2) This gap is 216 points between low and previous day’s high (20507.75-20291.55).
3) And it is 334 points between open and previous day’s close levels. (20601.95-20808.90).
4) Thereafter till 2024 January 16th, Nifty was travelling in an upward channel.
5) On 17th January this channel has been broken, and index closed below the channel.
6) On that day Nifty had a huge gap down opening. Even it tried to recover more than 50% of the gap, but failed to gain, and eventually closed 75 points below the opening level. And it is 460 points below the closing level of previous day.
7) On that day Nifty opened near the lower line of the channel, and closed below the line.
8) On the next day, Jan 18th, Nifty had another gap down opening. After a volatile intraday movement it had a positive closing, recovering 48 points from the opening level.
9) On 19th Jan, Nifty had a gap up opening and a less volatile intra-day movement, and closed with a 7 points gain from the opening level, creating a small a doji candle, showing indecisiveness among market participants.
10) On 19th Jan, index gained 50.45 pints above the closing level of 17th January.
11) Being at 21622.40, it is taking support at 147 square level. (ie. 147*147 = 21609)
# If nifty can gain about 100 points more, it can close in the upward channel again, If so, we can expect the continuation of the rally.
# If Nifty closes below 21460 level it may touch the 21325 level. If it goes further low it may fall to 21000 level.
Disclaimer: This is for educational purpose, not a trade recommendation, I am not SEBI registered adviser.

Strong Resistance ensures steep fall in Nifty. Strong Resistance zone of 21607 to 21857 sends Nifty in a downward spiral and makes it topple towards 50 days EMA(Mother Line). This has lead to frantic fall in RSI of Nifty. On 15th January the Rsi of Nifty was 73.88 today it is 44.88. Still little bit of cool down in RSI can not be ruled out. The immediate support for Nifty is near 21218. This is a weak support which may not hold but you never exactly know. The next support if 21218 is broken will be near 21065. 21065 in not only the Mother Line (50 days EMA) but also the mid channel support on the daily chart making it a very strong support. If 50 EMA does not hold the bears will tighten the grip on the stock market and may try their best to bring the Nifty to 20794. Holding 21065 or 20794 will be very important and the levels to watch out for. If these do not sustain we may see 20297, 19849 or even 19738.

[Trading Idea] Breakout in MANEKSTEELNSE:MANAKSTEEL has broken out in WTF with good volumes. In last 2 weeks, stock has already moved nearly 60% up but still there is room to go further up.
If I take the breakout from the previous swing close (instead of high) as a more conservative target then it comes around to 99. Stock is currently trading at 81.95. And if I take the target from the swing high then target comes around to be 110. Even with the more conservative target, it could be a decent trading opportunity for nearly 20% gain.

Nifty positional making money.Monday intraday<>
Mild gap up or flat opening will be good to go longs and resistance should hit first before it takes support once again.
Huge gap down will be neglected the view.
IMPORTANT-20300-20500 gap will fill before budget or after the budget it may fill depending on financial news.
>Just follow the trend you will never be in loss.
>Don't predict before closing levels for traps.
>Wait for the retest level which will be secure
and can avoid huge losses.
>Profit bookings according to your capital %.
>Don't use indicator on daily basis as stop loss can hit easy.

Mid-Channel Resistance again stops Nifty and pushes it down50 hours EMA (Mother line)(Those who know my Mother/Father/Small Child story can understand it very well) was a very important resistance to be crossed and held today but Nifty could not hold on to it after crossing it once. In addition to the 50 EMA there was also Mid-Channel resistance. which could not be crossed. Additionally there is a trend line resistnace, Nifty has to cross this for further growth. There was lack of volume and next week is a 3 day week so lot of traders/investors did not carry long positions. The support and resistance zones remain at:
Support Zone : 21539, 21430(Very important 200 hours EMA) support (Father Line) and finally 21285 (Channel bottom support). Bears can tighten their grip below this point.
Resistance Zones : 21600, 21674 (50 Hours EMA)(Mother Line), 21756 (Mid Channel resistance) and finally 21847. Above 21847 Bulls will strengthen their grip.

BALKRISIND - Pennant Breakout: A Promising Signal for Traders📝 In this educational technical analysis, I would like to discuss BALKRISIND. Understanding key technical terms and patterns, such as pennants and ascending triangles, can help new traders identify potential trade setups. Remember, I am not a SEBI registered analyst, and this analysis is solely for educational purposes.
BALKRISIND experienced a bull run from March 2020, starting at 650 INR and peaking at 2075 INR in September 2021. This move represents an impressive 314% increase.
After the bull run, a pennant pattern formed. Pennant patterns typically occur after a strong price movement and signify a brief consolidation before the trend resumes.
Pennant Breakout and Retest:
📈 On May 23, 2023, BALKRISIND witnessed a pennant breakout with good volume. However, what followed was an interesting development—a retest of the breakout level with strong volume. Retests are not commonly observed after pennant breakouts. Moreover, during this retest, an ascending triangle pattern formed on the 30-minute time frame, indicating a potential trend continuation.
🔎 Technical Term Explanation:
Pennant Pattern : A pennant pattern is a continuation pattern that occurs after a strong price movement. It is characterized by converging trendlines, resembling a small symmetrical triangle, and represents a temporary pause before the trend continues.
Ascending Triangle Pattern : An ascending triangle pattern is a bullish continuation pattern formed by a horizontal resistance line and an upward sloping support line. It suggests an ongoing uptrend and often leads to further price advances.
Potential Trade Opportunity:
🎯 Traders can plan their entry upon the breakout of the ascending triangle pattern, as it indicates a high probability of trend continuation to the upside. Monitoring the price action and volume closely during the breakout will help confirm the strength of the upward move.
Conclusion:
I appreciate your support and encourage you to like this analysis if you found it helpful. Feel free to share your observations and comments. Your feedback keeps me motivated to consistently provide valuable insights. If you want to stay updated with more technical analysis articles and trade setups, follow me on TradingView through the link: in.tradingview.com
💪 Remember, successful trading requires continuous learning and adapting to market conditions. As the saying goes, "The only way to do great work is to love what you do." Keep exploring and growing in the exciting world of trading! Happy trading! 📈💰

Nifty trapped between strong support and strong resistanceRight now Nifty seems to be trapped between strong support and strong resistance. The support zone is 21415 to 21581. Resistance zone is 21670 to 21847. Nifty needs little bit of consolidation in the range. Results from various companies will drive the nifty forward in either direction. The interim budget is also around the corner that can also be a guiding light for Nifty. Wild swings in either direction in addition to Geo-Political events can also turn the fate of Nifty and things can turn cloudy in a session or two. My advice for now will be stick to large caps and selective mid and small caps with ethical management and strong fundamentals and avoid companies with low durability, high debt, high pledging and questionable ethics. Which should be the case anyway but more so with Macro and Micro global situations and events which are in progress and around the corner.


Nifty trying to form bottom after taking channel bottom supportNifty trying to form a bottom after taking channel bottom support. Nity touched the bottom of our hourly channel and trying to consolidate in the zone. Major support for Nifty from here will be 21405 (200 Hours EMA) (Father Line) and Channel bottom 21285. If 21285 is broken Nifty may fall further till 21089 or even 20967. On the way up major resistances that Nifty will face now are 21544, 21650 and 21715 (Major Resistance 50 Hours EMA). Also note that Mid channel channel resistance is also near 21740 region. So 21715 to 21740 will be major resistance on the way up. Nifty might try to stage a recovery tomorrow but let us see if the levels hold. Weekly closing is important with Geo-Political tensions rising between Iran and Pakistan. As well as Afghanistan and Pakistan.

Market becomes a ruthless teacher today. Market today was in ferocious ruthless form today. Overheated RSI sometimes stays overheated for few days or weeks and sometimes like today cools off in a day. Yesterday the RSI was above 70 and today it is below 30 on the hourly chart. 21550 is a good support zone from where we can see recovery but it is less likely possible point of reversal. The possible point of reversal can be 21450 and 21397. If 21397 is broken the next supports levels will be at 2133, 21188 or 20999. On the upper side the resistances will be at 21687, 21754, 21796 and 21847. It looks like the start might be negative but later in the afternoon or Friday Nifty can try to stage a recovery.

5 waves impulse down visible in NIFTY from topNSE:NIFTY hourly chart shows 5 wave impulse down as of now. In this case, a pullback towards 21800/21900 should occur followed by another fall which should take the prices in 21300/21400 zone at least.
Assuming this is wave A of the correction downwards, pullback would be B followed by another impulse C down. Note that this is ideal scenario and the correction could become complex (WXY/WXYXZ). Let's go step by step and follow what's visible in charts and will update as and when something changes.
Note that 5 can turn into 9/13 if the first leg of this fall remains impulsive and it could also end up being 7/11 waves but we'll cross that bridge when it comes.

Was it profit booking or Channel Top resistance? or both? Nifty is facing a channel top resistance and trying to cool down/climb down from the overbought zone. The Major resistance for Nifty going ahead are at 22056 and very strong Channel top resistance near 22124. Supports for Nifty on the lower side as it tries to cool down it's RSI will be at 21973, 21917, 21840 (Mother Line, Good support 50 Hours EMA), 21758 and 21687 (Mid Channel Support). If Mid-Channel support is broken the next supports will be near 21591, 21455 and finally 21377 (Father line, Major support 200 Hour EMA). Nifty looks as if it will start negatively tomorrow in the afternoon it can try and stage a recovery.

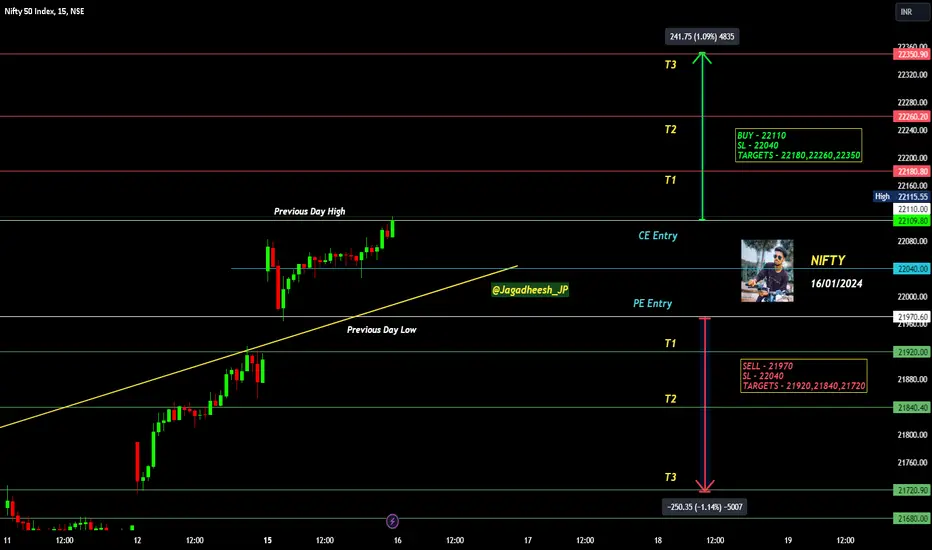
NIFTY INTRADAY LEVELS FOR 16/01/2024BUY - 22110
SL - 22040
TARGETS - 22180,22260,22350
SELL - 21970
SL - 22040
TARGETS - 21920,21840,21720
NO TRADE ZONE - 21970 to 22110
Previous Day High - 22110
Previous Day Low - 21970
Based on price action major support & resistance's are here, the red lines acts as resistances, the green lines acts as supports. If the price breaks the support/resistance, it will move to the next support/resistance line. White lines indicates previous day high & low, high acts as a resistance & low acts as a support for next day.
Trendlines are also significant to price action. If the price is above/below the trendlines, can expect an UP/DOWN with aggressive move.
Please NOTE: this levels are for intraday trading only.
Disclaimer - All information on this page is for educational purposes only,
we are not SEBI Registered, Please consult a SEBI registered financial advisor for your financial matters before investing And taking any decision. We are not responsible for any profit/loss you made.
Request your support and engagement by liking and commenting & follow to provide encouragement
HAPPY TRADING 👍
NIFTY50 targets 21900 and can extend to 28000Monthly chart, NIFTY50 has formed a chart pattern that pushes the level to 21900, then probably a flag pattern to target 28000
Technical indicators: MACD is positive. RSI is near over-bought (almost 70), and may need some correction to cool down - before further upwards movement.
Support is at 19000

New Record But How Far can The Rally Stretch? Blockbuster rally makes it a festive Makar Sankranti, Uttarayan, Bihu, Lohri and Pongal for investors but how far can this rally stretch is the question?
I will try to answer the question based on Technical analysis. On the onset let me tell you that predicting exact top and exact bottom in a short term is a very difficult task but The candle today has opened the door that leads us towards 22326 which is a Fibonacci resistance level. Fibonacci resistances are really little difficult to cross and it will require full force of bulls to do so. If 22326 is crossed the next resistance can be near 22769 and 23119. Immediate resistance for Nifty will be at 22115. Supports on the lower side for Nifty are at 21952, 21716 (strong support), 21474 and finally 20928. Closing below 20928 the Nifty can fall to the levels of 19624.

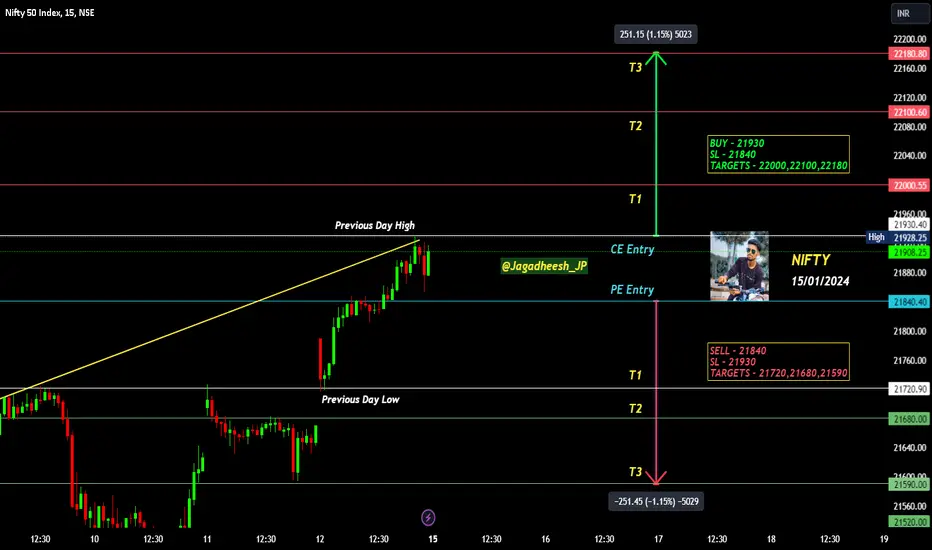
NIFTY INTRADAY LEVELS FOR 15/01/2024BUY ABOVE - 21930
SL - 21840
TARGETS - 22000,22100,22180
SELL BELOW - 21840
SL - 21930
TARGETS - 21720,21680,21590
NO TRADE ZONE - 21840 to 21930
Previous Day High - 21930
Previous Day Low - 21720
I am sharing NIFTY levels this levels acts as important support & resistance for intraday. if you want to trade with this levels wait for 15 min Candle closing above that levels. You can trade with breakout and reversal both.
In this channel, I share my expertise in trading strategies, technical analysis, and market trends to help you make informed decisions in your trading ventures.
Stay tuned for daily updates, in-depth market analyses, and real-time trading scenarios to witness firsthand how we transform from Zero to Hero in the trading world. My Only aim is to empower you with the knowledge and skills necessary to navigate the complexities of the financial markets successfully.
Based on price action major support & resistance's are here, the red lines acts as resistances, the green lines acts as supports. If the price breaks the support/resistance, it will move to the next support/resistance line. White lines indicates previous day high & low, high acts as a resistance & low acts as a support for next day.
Please NOTE: this levels are for intraday trading only.
Disclaimer - All information on this page is for educational purposes only,
we are not SEBI Registered, Please consult a SEBI registered financial advisor for your financial matters before investing And taking any decision. We are not responsible for any profit/loss you made.
Request your support and engagement by liking and commenting & follow to provide encouragement
HAPPY TRADING 👍
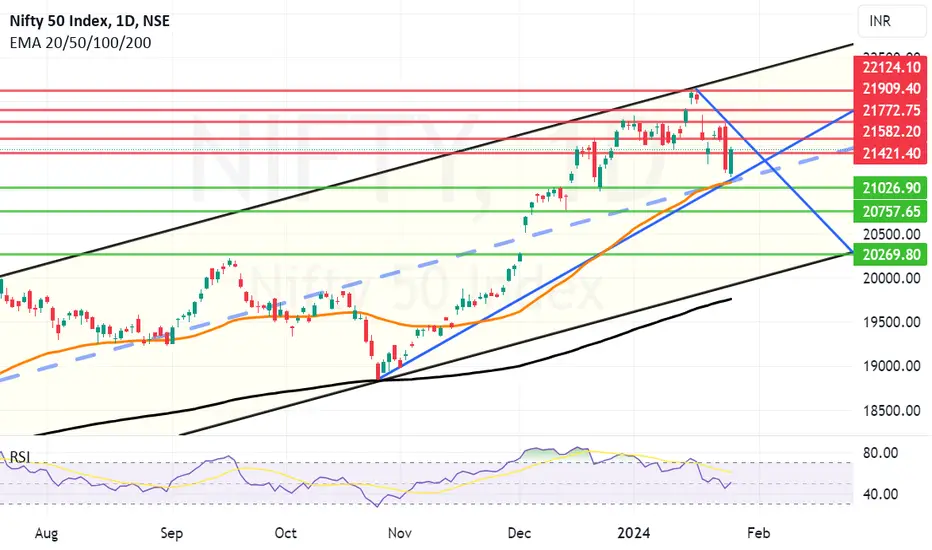
Medium Term and Long Term Targets for Nifty for 2024. There are two trend triangles formed in the daily chart of Nifty. The larger triangle indicates the long term target for Nifty at 23098. The triangle within that which indicates the medium term range or target of Nifty tells us that current rally can peak near 22326. In the process of reaching these targets the support zones are indicated by the green lines and Mother, Father lines (50 and 200 days EMA) which are at 21743, 21486, 20988, 20880 50 Days EMA strong support (Mother line), 20542, 20268, 19857 and finally 19599 200 days EMA very strong support (Father line, 200 days EMA).
