As expected Nifty fell and what next ?Yesterday I was expected that Nifty will fall today ! Yes thats what happened and im expecting bullish for tomorrow and why ?
Niftyanalysis

Fresh 500% Tariff threat and geo-political tensions grip Nifty. Fresh Trump Tariff threat has sent investors in a tizzy and craved path for Nifty fall that we saw today. But is there more pain in store? Nifty is currently near a support level of 25864. Which is just a little away from today's closing that whic was at 25876. If we get a closing below 25864 more pain might be instore and the next support levels will be at 25740, 25639, 25544 or even 25427 (which is a channel bottom support).
Resistances for Nifty on the upper side remain at 26033 (Father line) and 26103 (Mother line). If we get a closing above 26103 the next resistnace will be at 26188 and finally channel top of 26360. A proper rally can resume only when we get a closing above 26360.
RSI is indicating that the market is already nearing oversold zone as RSI currently is 21.76. Lot of speculation is going on related to tariffs and other geo-political tensions are gripping happening in South Asia (Iran, Afghanistan, Pakistan, India and Bangladesh). Lot of geo-political tensions are unravelling in EU (Russia, Ukraine, Greenland). Another bunch lot of geo-political tensions are brewing between UAE and KSA with regards to Yeman. We all know what happened in Venenzuela and the tensions are rife due to this between China, Russia and the USA. USA captured Ships with Russian flags on it yesterday and speculators / Bears take advantage of such situation to bring down markets specially the ones moving upwards. That is what happened to Nifty today. DII was still on the buying side.
Long term investors with a horizen of 12 to 24 months will take this oppertunity to add some more blue chips in their portfolio specially with quarterly result starting next week onwards. Keep stocks with good results and strong fundamentals in radar. Most of the dips are portfolio shuffling/new investment and compounding oppertunities for long term investors. This is not a market for Short term investment and making a quick buck through F&O. Only those with patience will survive the churning that is going on as consolidation phase goes on and on in the market. Patience of people with deep focus and egle eye will be rewarded as there is nothing wrong with India's growth story. Threat from valuation perspective and geo-political factors still remains the major concern as we move deeper into 2026. It is a geo-politically volatile time. Time is not conducive for those with shallow pockets and lack patience.
Disclaimer: The above information is provided for educational purpose, analysis and paper trading only. Please don't treat this as a buy or sell recommendation for the stock or index. The Techno-Funda analysis is based on data that is more than 3 months old. Supports and Resistances are determined by historic past peaks and Valley in the chart. Many other indicators and patterns like EMA, RSI, MACD, Volumes, Fibonacci, parallel channel etc. use historic data which is 3 months or older cyclical points. There is no guarantee they will work in future as markets are highly volatile and swings in prices are also due to macro and micro factors based on actions taken by the company as well as region and global events. Equity investment is subject to risks. I or my clients or family members might have positions in the stocks that we mention in our educational posts. We are not a SEBI registered Research analyst. We will not be responsible for any Profit or loss that may occur due to any financial decision taken based on any data provided in this message. Do consult your investment advisor before taking any financial decisions. Stop losses should be an important part of any investment in equity.

IS 2026 UNLUCKY FOR NIFTY? NIFTY on the 4H chart has broken below its rising channel, indicating short-term weakness. Price faced strong rejection near the 26,350–26,400 resistance zone and is now struggling to reclaim 26,000, which may act as a resistance.
If weakness continues, a corrective move towards 25,300–25,350 (major demand zone) is possible. A bounce from that zone will depend on clear reversal signals. Overall trend is corrective, not bearish collapse.
Disclaimer:
This analysis is for educational purposes only and based on technical charts. Market conditions can change rapidly. Please do your own research or consult a registered financial advisor before trading.

Nifty Short & Medium Term Support&Resistance_05-Jan-26 to 09-JanNifty Short & Medium Term Support&Resistance_05-Jan-26 to 09-Jan-26
Nifty 26328 (Last Week 26042)
Long call ( Buy) was given on 12-Oct-25 at 24896, Nifty have crossed near to 1430 points.
Market is in sideways and rangebound movement from Oct 2025 and now created a new high 26329 last week. Near to 290 Points have increased.
Current Short Term Resistance 26000 (Trend line and significant support). It need to break the resistance 26328 decisively to move up to 27000 target in med-long term.
Two major incident to be watched out next week are US Capturing Venuzuela President and China conducting massive drill surrounding Taiwan after US sanctioned weapons for Taiwan. Global Concern, Q3 results, Feb Ist Budget for any reforms and Tariffs deal will decide the future path for the Nifty. Since it is a Volatile situation SIP route or buy in multiple parcel route (On Dips) with a goal of 3-5 years will workout.
Diversify the portfolio with Debt and liquid fund ( approx 20-30% portfolio) and 10-20% in Gold & Silver for Year 2026, this funds ( especially liquid funds will create funds availability for further buying opportunity incase of market dips like a Systematic transfer plan.
Some of the stocks to watchout given last week are HDFC AMC, NMDC, Apar, Sharda Crop, VRL Logistics, krishna Phos chem, Cipla, Dr Reddy, Natco pharma, Apl Apollo Tubes, Muthoot Finance ( On Dips) , tata Steel ( Contra Stock due to Business Cycle), Bank of Mah, BPCL, CG Power, hero motor, shriram finance and NRB bearings. Shared for Analysis purpose only. Dr Reddy, shriram fin, natco pharma, Hero moto corp,Muthoot Finance have already given more than 10% return in this 1 month,HPCL, BPCL, IOCL, Carysil, MAS Financial Services and BSE . Waaree Energies had an IT raid in its premises in Mid of Nov 2025. Outcome will take the stock forward.
New stocks for 29-Dec-25 to 02-Jan-26 is Indian Bank and NBCC, buy on dip as market in volatile situation.
New Stocks ( For Jan Ist Week 2026) are ITC can be bought as it reduced significantly last week due to rumors in increase in tax on cigrattes. Other buy stock is Lupin, Consider buying with multiple parcel while it dips.
As RSI is slighly improved 62% (58%) and MACD just cross the signal line, caution to be emphasized due to global political tension, though the strategy continued to buy for long.
Nifty Short Term Supports (Multiple Supports are there between 25000-25500):
25850 (Trend line shown)
25670 (Jun 2025 High)
25360-25420 ( Sep high and trendline support as shown in chart)
25300-25350 (Two Fibonacci resistance shown ) - Major Support
Hence 25300- 25420 acts as major short term support.
25500 ( 25441 Sep 18th 2025 High )
25450 ( 25442 is the Aug 2025 high)
25200 ( 25154 Aug 2025 high)
25000 ( Milestone)
Short Term Resistance
1.26329 ( All time High)
2. 26500
3. 26700 ( Finonacci 1.618 as shown in graph)
Medium Term Support:
1.24700 (Trend Line as shown)
2. 24000-24170 (Fibonacci Retracements Supports- Two Supports in this zone 24116 & 24171 as shown)
3. 23500-23700 (Fibonacci Retracements Supports- Two Supports in this zone 23608 & 23707 as shown)
2. 23000
Medium Term Resistance:
1.27000 ( Need to decisively break 26269 all time high) This resistance is based on Fibonacci resistance at 27034
Long term resistance:
1.28000 ( Need to decisively break and move up 27000)This resistance is based on Fibonacci resistance at 28106
Long Term Support
1.22700-23000 ( Trend line and Mar 2024 High)
2.Big support at 20000 (Sep 2023 high)

(FIIs-DIIs) Nifty levels & range for tomorrow 31-12-2025(FIIs-DIIs) Nifty levels & range for tomorrow 31-12-2025
use levels in 5 minutes time frame for intraday trading

Nifty Short & Medium Term Support&Resistance_29-Dec to 2-Jan-26Nifty Short & Medium Term Support&Resistance_29-Dec to 2-Jan-26
Nifty 26042 ( Last week 25966)
Long call ( Buy) was given on 12-Oct-25 at 24896, Nifty have crossed near to 1150 points.
Market is in sideways and rangebound movement from Oct 2025.
Market Touched high of 26232 and ended lower at 26042 last week.
Current Short Term Resistance 26321 ( all time high). It need to break the resistance 26321 decisively to move up to 27000 target in med-long term.
Overall Q3 results, Feb Ist Budget for any reforms and Tariffs deal will decide the future path for the Nifty. Combination of Q3 results and Feb Budget reform ( Guidance) it will be a stock specific buying opportunity, Since it is a Volatile situation SIP route or buy in multiple parcel route (On Dips) with a goal of 3-5 years will workout.
Diversify the portfolio with Debt and liquid fund ( approx 20-30% portfolio) and 10-15% in Gold for Year 2026, this funds ( especially liquid funds will create funds availability for further buying opportunity incase of market dips like a Systematic transfer plan.
Some of the stocks to watchout given last week are HDFC AMC, NMDC, Apar, Sharda Crop, VRL Logistics, krishna Phos chem, Cipla, Dr Reddy, Natco pharma, Apl Apollo Tubes, Muthoot Finance ( On Dips) , tata Steel ( Contra Stock due to Business Cycle), Bank of Mah, BPCL, CG Power, hero motor, shriram finance and NRB bearings. Shared for Analysis purpose only. Dr Reddy, shriram fin, natco pharma, Hero moto corp,Muthoot Finance have already given more than 10% return in this 1 month. Waaree Energies had an IT raid in its premises in Mid of Nov 2025. Outcome will take the stock forward.
New Stocks ( For Dec 22-26-Dec 2025) can be watched and considered are HPCL, BPCL, IOCL, Carysil, MAS Financial Services and BSE ( For Long term as when market pickup.
New stocks for 29-Dec-25 to 02-Jan-26 is Indian Bank and NBCC, buy on dip as market in volatile situation.
As RSI is below 60% (52%) and MACD didnt cross the signal line, caution to be emphasized, though the strategy continued to buy for long.
Nifty Short Term Supports (Multiple Supports are there between 25000-25500):
25850 (Trend line shown)
25670 (Jun 2025 High)
25360-25420 ( Sep high and trendline support as shown in chart)
25300-25350 (Two Fibonacci resistance shown ) - Major Support
Hence 25300- 25420 acts as major short term support.
25500 ( 25441 Sep 18th 2025 High )
25450 ( 25442 is the Aug 2025 high)
25200 ( 25154 Aug 2025 high)
25000 ( Milestone)
Short Term Resistance
1.26321 ( All time High)
2. 26500
Medium Term Support:
1.24700 (Trend Line as shown)
2. 24000-24170 (Fibonacci Retracements Supports- Two Supports in this zone 24116 & 24171 as shown)
3. 23500-23700 (Fibonacci Retracements Supports- Two Supports in this zone 23608 & 23707 as shown)
2. 23000
Medium Term Resistance:
1.27000 ( Need to decisively break 26269 all time high) This resistance is based on Fibonacci resistance at 27034
Long term resistance:
1.28000 ( Need to decisively break and move up 27000)This resistance is based on Fibonacci resistance at 28106
Long Term Support
1.22700-23000 ( Trend line and Mar 2024 High)
2.Big support at 20000 (Sep 2023 high)

Trend line resistance stopped the forward March of Nifty today.Nifty hit a solid trendline resistance today and took a halt closing flat (4.75 Points in Positive). The zone between 26202 and 26307 has 4 resistances in total as you can see them in the chart. Also note at the RSI which was in the overheated zone indicating overbought position of the market indicating the need of consolidation before next forward march.
The supports for Nifty now are near 26131, 26060 followed by Mother and Father line support at 26020 and 25939. A closing below 25939 can be indicative of weakness in the market and can plummet the Nifty towards 25841 or even 25807 levels.
Overall the sentiment will remain positive but there can be stock specific huge moves. Large cap stocks available at bargain prices should remain the prerogative of the buyers. Next closing above 26307 whenever it happens will be a superlative breakout for Nifty. Shadow of the candle is neutral currently.
Disclaimer: The above information is provided for educational purpose, analysis and paper trading only. Please don't treat this as a buy or sell recommendation for the stock or index. The Techno-Funda analysis is based on data that is more than 3 months old. Supports and Resistances are determined by historic past peaks and Valley in the chart. Many other indicators and patterns like EMA, RSI, MACD, Volumes, Fibonacci, parallel channel etc. use historic data which is 3 months or older cyclical points. There is no guarantee they will work in future as markets are highly volatile and swings in prices are also due to macro and micro factors based on actions taken by the company as well as region and global events. Equity investment is subject to risks. I or my clients or family members might have positions in the stocks that we mention in our educational posts. We will not be responsible for any Profit or loss that may occur due to any financial decision taken based on any data provided in this message. Do consult your investment advisor before taking any financial decisions. Stop losses should be an important part of any investment in equity.

Nifty Short & Medium Term Support&Resistance_22-Dec to 26-Dec-25Nifty Short & Medium Term Support&Resistance_22-Dec to 26-Dec-25
Nifty 259666 (Last week 26046)
Long call ( Buy) was given on 12-Oct-25 at 24896, Nifty have crossed near to 1100 points.
Market is in sideways and rangebound movement from Oct 2025.
Market Touched low of 25688 two weeks ( near to support Jun 2025 High and 0.618 Fibonacci Resistance) and bounced back and ended at 26046. Again last week it touched 25724.
It was a buying opportunity.
8.2% GDP growth of Q2 was released and may created a positive sign in the market despite trade deals issues. Q3 results expected to be mixed results.
However overall, Q3 results, Feb Ist Budget for any reforms and Tariffs deal will decide the future path for the Nifty. Combination of Q3 results and Feb Budget reform ( Guidance) it will be a stock specific buying opportunity, Since it is a Volatile situation SIP route or buy in multiple parcel route (On Dips) with a goal of 3-5 years will workout.
Diversify the portfolio with Debt and liquid fund ( approx 20-30% portfolio) and 10-15% in Gold for Year 2026, this funds ( especially liquid funds will create funds availability for further buying opportunity incase of market dips like a Systematic transfer plan.
Some of the stocks to watchout given last week are HDFC AMC, NMDC, Apar, Sharda Crop, VRL Logistics, krishna Phos chem, Cipla, Dr Reddy, Natco pharma, Apl Apollo Tubes, Muthoot Finance ( On Dips) , tata Steel ( Contra Stock due to Business Cycle), Bank of Mah, BPCL, CG Power, hero motor, shriram finance and NRB bearings. Shared for Analysis purpose only. Dr Reddy, shriram fin, natco pharma, Hero moto corp,Muthoot Finance have already given more than 10% return in this 1 month. Waaree Energies had an IT raid in its premises in Mid of Nov 2025. Outcome will take the stock forward.
New Stocks ( For Dec 22-26-Dec 2025) can be watched and considered are HPCL, BPCL, IOCL, Carysil, MAS Financial Services and BSE ( For Long term as when market pickup.
Current Short Term Resistance 26321 ( all time high). It need to break the resistance 26321 decisively to move up to 27000 target in med-long term.
As RSI is below 60% (52%) and MACD didnt cross the signal line, caution to be emphasized, though the strategy continued to buy for long.
Nifty Short Term Supports (Multiple Supports are there between 25000-25500):
25850 (Trend line shown)
25670 (Jun 2025 High)
25360-25420 ( Sep high and trendline support as shown in chart)
25300-25350 (Two Fibonacci resistance shown ) - Major Support
Hence 25300- 25420 acts as major short term support.
25500 ( 25441 Sep 18th 2025 High )
25450 ( 25442 is the Aug 2025 high)
25200 ( 25154 Aug 2025 high)
25000 ( Milestone)
Short Term Resistance
1.26321 ( All time High)
2. 26500
Medium Term Support:
1.24700 (Trend Line as shown)
2. 24000-24170 (Fibonacci Retracements Supports- Two Supports in this zone 24116 & 24171 as shown)
3. 23500-23700 (Fibonacci Retracements Supports- Two Supports in this zone 23608 & 23707 as shown)
2. 23000
Medium Term Resistance:
1.27000 ( Need to decisively break 26269 all time high) This resistance is based on Fibonacci resistance at 27034
Long term resistance:
1.28000 ( Need to decisively break and move up 27000)This resistance is based on Fibonacci resistance at 28106
Long Term Support
1.22700-23000 ( Trend line and Mar 2024 High)
2.Big support at 20000 (Sep 2023 high)

Mini Trend Breakout for Nifty. With a resistance nearyby. Nifty gave a strong comeback candle on Friday with FII and DIIs both turning buyers for second straingt day and close at 25966. There is a resistance nearby if that is crossed we can have an upside. The resistnace nearby for Nifty is at 25980. If we get a closing above it next week, Nifty can sail towards next resistances 26120, 26223, 26339, 26533 and finally the trend top resistnace which is near 26651. Supports for Nifty remain near 26774 (Major mother line support), 25701, 25363, 25115 and finally Father line support is near 24992.
There is a mini trend break put as well within an overall bullish trend. Broader market may also catch up soon as many stocks are near their support or are crossing near to cross Mother father line resistances. Shadow of the candle as of now is positive.
Disclaimer: The above information is provided for educational purpose, analysis and paper trading only. Please don't treat this as a buy or sell recommendation for the stock or index. The Techno-Funda analysis is based on data that is more than 3 months old. Supports and Resistances are determined by historic past peaks and Valley in the chart. Many other indicators and patterns like EMA, RSI, MACD, Volumes, Fibonacci, parallel channel etc. use historic data which is 3 months or older cyclical points. There is no guarantee they will work in future as markets are highly volatile and swings in prices are also due to macro and micro factors based on actions taken by the company as well as region and global events. Equity investment is subject to risks. I or my clients or family members might have positions in the stocks that we mention in our educational posts. We will not be responsible for any Profit or loss that may occur due to any financial decision taken based on any data provided in this message. Do consult your investment advisor before taking any financial decisions. Stop losses should be an important part of any investment in equity.

NIFTY ANALYSIS If NIFTY sustains above the 25,800–25,820 zone and holds above the descending trendline, a short-term upside move is possible toward 25,880–25,930, with 26,000 as the next resistance.
A break below 25,780 may lead to further downside.
Disclaimer:
This analysis is for educational purposes only and not a trading recommendation. Please manage risk and do your own due diligence before trading.

Nifty Short & Medium Term Support&Resistance_15-Dec to 19-Dec-25Nifty Short & Medium Term Support&Resistance_15-Dec to 19-Dec-25
Nifty 26046 (Last week 26186)
Long call ( Buy) was given on 12-Oct-25 at 24896, Nifty have crossed near to 1150 points.
Market Touched low of 25688 last week ( near to support Jun 2025 High and 0.618 Fibonacci Resistance) and bounced back and ended at 26046.
It was a buying opportunity.
Initially it was profit booking and Fed Rate Cut pushed the market up.
9.2% GDP growth of Q2 was released and may created a positive sign in the market despite trade deals issues. Putin's Visit to India, gave a hope for export and import deals other than petroleum imports.
However overall, Tariffs deal will decide the future path till Dec - Jan for the Nifty. Since it is a Volatile situation SIP route or buy in multiple parcel route (On Dips) with a goal of 3-5 years will workout. US Trade deal, 1st Feb budget and reforms if any will decide Nifty's path. US trade deal not being signed may create a worry for the market.
Some of the stocks to watchout given last week are HDFC AMC, NMDC, Apar, Sharda Crop, VRL Logistics, krishna Phos chem, Cipla, Dr Reddy, Natco pharma, Apl Apollo Tubes, Muthoot Finance ( On Dips) , tata Steel ( Contra Stock due to Business Cycle), Bank of Mah, BPCL, CG Power, hero motor, shriram finance and NRB bearings. Shared for Analysis purpose only. Dr Reddy, shriram fin, natco pharma, Hero moto corp,Muthoot Finance have already given more than 10% return in this 1 month. Waaree Energies had an IT raid in its premises in Mid of Nov 2025. Outcome will take the stock forward.
Current Short Term Resistance 26321 ( all time high). It need to break the resistance 26321 decisively to move up to 27000 target in med-long term.
As RSI is below 60% and MACD didnt cross the signal line, caution to be emphasized, though the strategy continued to be long and use the opportunity to buy on dips similar to SIP.
Nifty Short Term Supports (Multiple Supports are there between 25000-25500):
26000
25670 (Jun 2025 High)
25360-25420 ( Sep high and trendline support as shown in chart)
25300-25350 (Two Fibonacci resistance shown ) - Major Support
Hence 25300- 25420 acts as major short term support.
25500 ( 25441 Sep 18th 2025 High )
25450 ( 25442 is the Aug 2025 high)
25200 ( 25154 Aug 2025 high)
25000 ( Milestone)
Short Term Resistance
1.26321 ( All time High)
2. 26500
Medium Term Support:
1.24700 (Trend Line as shown)
2. 24000-24170 (Fibonacci Retracements Supports- Two Supports in this zone 24116 & 24171 as shown)
3. 23500-23700 (Fibonacci Retracements Supports- Two Supports in this zone 23608 & 23707 as shown)
2. 23000
Medium Term Resistance:
1.27000 ( Need to decisively break 26269 all time high) This resistance is based on Fibonacci resistance at 27034
Long term resistance:
1.28000 ( Need to decisively break and move up 27000)This resistance is based on Fibonacci resistance at 28106
Long Term Support
1.22700-23000 ( Trend line and Mar 2024 High)
2.Big support at 20000 (Sep 2023 high)

NIFTY Bull Case Intact: Strong Growth, Low Inflation, Higher LowIndian market continue to operate in a tug of war between the strong domestic fundamentals and global headwinds, but the underlying data keeps the bull case intact. Q2 FY26 GDP growth at 8.2% and CPI staying below the 1% have created rare high-growth, low inflation environment, limiting downside despite persistent FII selling. With market increasingly pricing in a rate cut cycle from early 2026 and expectations of the strongest earnings quarter in 2.5 years, domestic fundamentals remain firmly supportive.
From a technical perspective, Nifty’s structure remains constructive. The index has repeatedly taken support near its 20-day and 50-day moving averages and is now moving higher, indicating active dip-buying rather than distribution. While the forward P/E of ~19.3x is at the higher end of the historical range, it remains defensible given sustained 8%+ GDP growth visibility and continued DII absorption of supply.
My market bias remains bullish. I am currently holding NIFTYBEES for broad market exposure and Torrent Pharma for selective sector strength, while actively looking to add new swing positions in the coming weeks. This is not a broad-based rally—leadership remains selective—but as long as inflation stays benign and key moving averages hold, the market continues to favor a buy-on-dips, rotation-driven approach rather than aggressive shorts.
📢📢📢
If my perspective changes or if I gather additional fundamental data that influences my views, I will provide updates accordingly.
Thank you for following along with this journey, and I remain committed to sharing insights and updates as my trading strategy evolves. As always, please feel free to reach out with any questions or comments.
Other posts related to this particular position and scrip, if any, will be attached underneath. Do check those out too.
Disclaimer : The analysis shared here is for informational purposes only and should not be considered as financial advice. Trading in all markets carries inherent risks, and past performance is not indicative of future results. It’s essential to conduct your own research and assess your risk tolerance before making any investment decisions. The views expressed in this analysis are solely mine. It’s important to note that I am not a SEBI registered analyst, so the analysis provided does not constitute formal investment advice under SEBI regulations.

Mother line provides support to falling Nifty. Mother line or 50 EMA has provided today incredible support to Nifty which rose 111 points from low of the day to close at 25839. Still the Nifty closed 120 points below previous close. Now of the Mother line support is held we can see comeback of Nifty and rally can restart from there on. For the rally to restart we need a closing above 25930. The next resistance if we get a closing above 25930 will be 26062. Further resistance can be at 26194, 26352 and finally the channel top is near 26596. Supports for Nifty will be at 25728 (Mother Line support), Mid-Channel support is near 25608, 25338 is the final support. If this support is broken the father line support is at 24917.
Disclaimer: The above information is provided for educational purpose, analysis and paper trading only. Please don't treat this as a buy or sell recommendation for the stock or index. The Techno-Funda analysis is based on data that is more than 3 months old. Supports and Resistances are determined by historic past peaks and Valley in the chart. Many other indicators and patterns like EMA, RSI, MACD, Volumes, Fibonacci, parallel channel etc. use historic data which is 3 months or older cyclical points. There is no guarantee they will work in future as markets are highly volatile and swings in prices are also due to macro and micro factors based on actions taken by the company as well as region and global events. Equity investment is subject to risks. I or my clients or family members might have positions in the stocks that we mention in our educational posts. We will not be responsible for any Profit or loss that may occur due to any financial decision taken based on any data provided in this message. Do consult your investment advisor before taking any financial decisions. Stop losses should be an important part of any investment in equity.

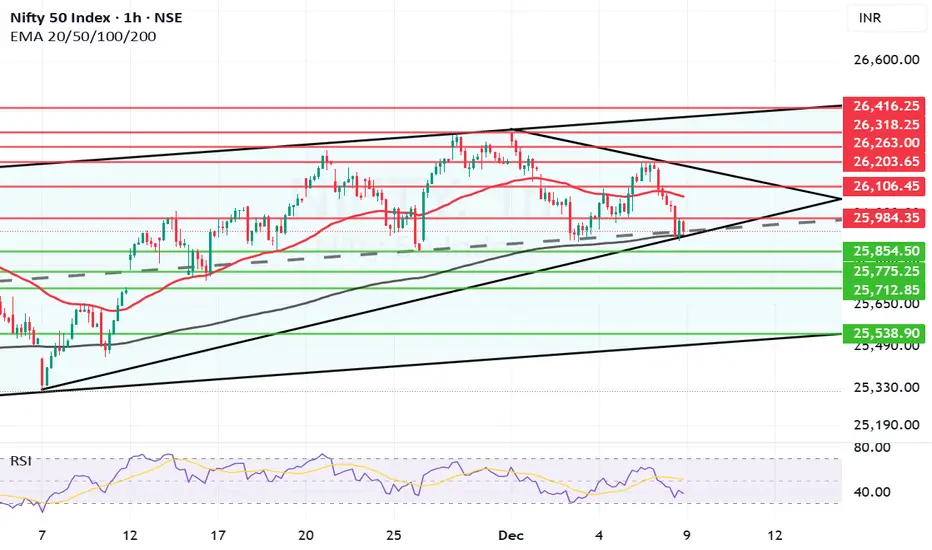
Nifty near father line support on hourly chart.After the drubbing today at browsers where Nifty ended 225.9 points below previous close has closed at 25960. Below the comfort level of 26K. The sell of was global today due to US FED meet later tonight.
Supports for Nifty are at 25915 (Major Father line support). If this support is broken Nifty will become weak and can further plummet towards 25854, 25775 or even 25712. The channel bottom support for Nifty will be near 25538.
Resistances for Nifty are at 25984, 26066 (Mother line resistance), 26203, 26263, 26318 and finally channel top resistance is near 26416.
Shadow of the candle is looking neutral despite the fall today. If the father line support at 25915 is not broken we can see a swift recovery in Nifty.
Disclaimer: The above information is provided for educational purpose, analysis and paper trading only. Please don't treat this as a buy or sell recommendation for the stock or index. The Techno-Funda analysis is based on data that is more than 3 months old. Supports and Resistances are determined by historic past peaks and Valley in the chart. Many other indicators and patterns like EMA, RSI, MACD, Volumes, Fibonacci, parallel channel etc. use historic data which is 3 months or older cyclical points. There is no guarantee they will work in future as markets are highly volatile and swings in prices are also due to macro and micro factors based on actions taken by the company as well as region and global events. Equity investment is subject to risks. I or my clients or family members might have positions in the stocks that we mention in our educational posts. We will not be responsible for any Profit or loss that may occur due to any financial decision taken based on any data provided in this message. Do consult your investment advisor before taking any financial decisions. Stop losses should be an important part of any investment in equity.
Nifty Short & Medium Term Support&Resistance_08-Dec to 12-Dec-25Nifty Short & Medium Term Support&Resistance_08-Dec to 12-Dec-25
Nifty 26186 (26202 Last week)
Long call ( Buy) was given on 12-Oct-25 at 24896, Nifty have crossed near to 1300 points.
Quarterly results of companies are released and so far it have mixed to Postive results.
Margins and revenue growth are major concern, Net profit being achieved by savings on employee cost and other savings. To be more cautious on picking the right stock and rebalance the portfolio. The stocks posted Moderate to Good Results have increased and taken the Nifty near to all time high.
Last week, 9.2% GDP growth of Q2 was released and may created a positive sign in the market depsite trade deals issues. Putin's Visit to India, gave a hope for export and import deals other than petroleum imports.
However overall, Tariffs deal will decide the future path till Dec - Jan for the Nifty. Since it is a Volatile situation SIP route or buy in multiple parcel route ( On Dips) with a goal of 3-5 years will workout. US Trade deal, 1st Feb budget and reforms if any will decide Nifty's path. US trade deal not being signed may create a worry for the market.
Some of the stocks to watchout given last week are HDFC AMC, NMDC, Apar, Sharda Crop, VRL Logistics, krishna Phos chem, Cipla, Dr Reddy, Natco ( Buy on Dip as still there is negative trend), Apl Apollo Tubes, Muthoot Finance ( On Dips) , tata Steel ( Contra Stock due to Business Cycle), Bank of Mah, BPCL, CG Power, hero motor, shriram finance and NRB bearings. Shared for Analysis purpose only. Dr Reddy, shriram fin, natco pharma, Hero moto corp,Muthoot Finance have already given more than 10% return in this 1 month. Waaree Energies had an IT raid in its premises in Mid of Nov 2025. Outcome will take the stock forward.
The strategy continued to be long and use the opportunity to buy on dips similar to SIP.
Current Short Term Resistance 26321 ( all time high). It need to break the resistance 26321 decisively to move up to 27000 target in med-long term. As RSI is at 60%, room to go higher will be less in short term.
Nifty Short Term Supports ( Multiple Supports are there between 25000-25500):
26000
25670 (Jun 2025 High)
25360-25420 ( Sep high and trendline support as shown in chart)
25300-25350 (Two Fibonacci resistance shown ) - Major Support
Hence 25300- 25420 acts as major short term support.
25500 ( 25441 Sep 18th 2025 High )
25450 ( 25442 is the Aug 2025 high)
25200 ( 25154 Aug 2025 high)
25000 ( Milestone)
Short Term Resistance
1.26321 ( All time High)
2. 26500
Medium Term Support:
1.24700 (Trend Line as shown)
2. 24000-24170 (Fibonacci Retracements Supports- Two Supports in this zone 24116 & 24171 as shown)
3. 23500-23700 (Fibonacci Retracements Supports- Two Supports in this zone 23608 & 23707 as shown)
2. 23000
Medium Term Resistance:
1.27000 ( Need to decisively break 26269 all time high) This resistance is based on Fibonacci resistance at 27034
Long term resistance:
1.28000 ( Need to decisively break and move up 27000)This resistance is based on Fibonacci resistance at 28106
Long Term Support
1.22700-23000 ( Trend line and Mar 2024 High)
2.Big support at 20000 (Sep 2023 high)

Nifty Analysis EOD – December 5, 2025 – Friday🟢 Nifty Analysis EOD – December 5, 2025 – Friday 🔴
Monetary Policy Boost: Bulls Secure Strong Close Above 26100 Targeted…!
🗞 Nifty Summary
The session began flat to positive, marking the day’s low early at 25,985. In anticipation of news, Nifty stayed range-bound within a tight 40-point range for the first hour. The announcement of the monetary policy rate cut acted as a strong catalyst, immediately triggering high volatility.
The index sharply broke the IBH and PDH, but the next candle was met with a 100-point rejection, trapping early breakout traders. After taking temporary support at the CPR Zone, Nifty resumed its upward conviction, systematically breaching 26132 and testing the Gap Zone.
Following a small consolidation near the Gap Zone (25-30 points), the final surge broke resistance again, taking Nifty to the 26200 level. The day closed at 26,186.45, adding +152.70 points (+0.59%).
This closing is significantly above the 26100 target expected yesterday, confirming powerful bullish control heading into the weekend.
🛡 5 Min Intraday Chart with Levels
🛡 Intraday Walk
The initial fakeout after the news announcement was crucial, shaking out weak hands before the real directional move began.
Once the market absorbed the volatility, the moves were aggressive and targeted. Nifty utilized CPR and 26132 as springboards, confirming that buyers viewed every dip as a buying opportunity in the post-policy environment.
The final close near the day’s high is a definitive technical signal that the strength has returned, and the index is ready to challenge higher structural levels next week.
📉 Daily Time Frame Chart with Intraday Levels
🕯 Daily Candle Breakdown
Open: 25,999.80
High: 26,202.60
Low: 25,985.35
Close: 26,186.45
Change: +152.70 (+0.59%)
🏗️ Structure Breakdown
Type: Strong Bullish candle (Near Marubozu)
Range (High–Low): ≈ 217 points — high volatility and wide trading range.
Body: ≈ 187 points — reflecting dominant upside momentum.
Upper Wick: ≈ 16 points — very limited rejection near highs.
Lower Wick: ≈ 14 points — buyers strongly defended the early weakness.
📚 Interpretation
This candle is a powerful confirmation of bullish conviction, showing decisive absorption of the early selling and continuous buying pressure throughout the session. The wide body and the close near the high signal that buyers are firmly in control. This structure strongly supports trend continuation and suggests that the recent indecision has been resolved in favor of the bulls.
🕯 Candle Type
Strong Bullish Marubozu-Style Candle — Represents decisive buying control and potential momentum continuation.
🛡 5 Min Intraday Chart
⚔️ Gladiator Strategy Update
ATR: 192.7
IB Range: 76.75 → Medium
Market Structure: Balanced
Trade Highlights:
10:16 Long Trade - SL Hit (IBH + PDH Breakout)
10:49 Long Trade - Target Hit (R:R 1:3.34) (IBH + PDH Breakout)
Trade Summary: The volatile, news-driven session initially led to a Stop Loss on the first breakout attempt. However, the strategy quickly adapted, capturing a high R:R profitable long trade on the confirmed directional breakout, successfully aligning with the strong bullish momentum post-monetary policy announcement.
🧱 Support & Resistance Levels
Resistance Zones:
26202 (PDH)
26220 ~ 26235
26277 (ATH)
Support Zones:
26155
26104 (Must Hold)
26070 ~ 26030
🧠 Final Thoughts
“The monetary policy provided the spark needed to re-engage the bull run.”
The successful close above 26132 is a game-changer. The immediate bias for Monday is strongly bullish. We must now watch the critical overhead resistance at 26220 ~ 26235.
A decisive breach here will immediately target the All-Time High at 26277. The 26104 level is the new line in the sand; as long as Nifty holds this support, the bullish momentum remains intact.
✏️ Disclaimer
This is just my personal viewpoint. Always consult your financial advisor before taking any action.

Nifty Breaks Record High: Will the Rally Continue Next Week? Nifty closed at 26202 marking a fresh all-time high. The index made a high of 26310 and a low of 25842. On the monthly timeframe, Nifty has formed a strong bullish candle and delivered a bullish close, indicating sustained strength on the higher timeframe. As mentioned last week, Nifty once again moved precisely within my projected range of 26600–25600. For the upcoming week, I expect Nifty to trade within 26700–25700 unless a breakout triggers new momentum.
Key levels for Nifty:
Resistance: 26492 is a strong Fibonacci level. Sustaining above this level can push Nifty towards 26700.
Support: 26117 is the first line of defence. Below this, 25700 remains a strong support zone.
Bank Nifty continues to lead the market’s upside. The index posted an all-time high weekly close at 59752, with a high of 59897 and a low of 58649. Bank Nifty has now reached a major psychological and Fibonacci level at 60087. Sustaining above this zone can open the path towards 60300 and 60900.
Midcap vs Smallcap:
A common query is when Midcap and Smallcap will start moving along with Nifty. Currently, the Midcap index is better positioned on the monthly timeframe compared to the Smallcap index. Smallcap investors may need to wait longer or shift focus to stronger opportunities within the Midcap space.
S&P 500 outlook:
As discussed last week near the 6840 region, S&P 500 has formed a bullish marubozu candle. The upcoming week will be crucial.
Above 6885: The index can extend its move towards 6930, 7000, and 7026 (important Fibonacci level).
Below 6726: The rally may weaken and pull the index towards 6568 (key Fibonacci support) and 6454.
Bonus level for Nifty traders:
Monday’s upper range limit is around 26350.

“Tomorrow, 03-12-2025 Nifty prediction. “Tomorrow, 03-12-2025 Nifty is likely to trade approximately 40 points in positive territory, indicating a mildly bullish sentiment in the early session.”
Explanation for Traders:
Market may show slight upward momentum
Buyers might attempt to take control early
A strong bullish move will need follow-through with volume
BANKNIFTY 500 down sentiment in the early session.”

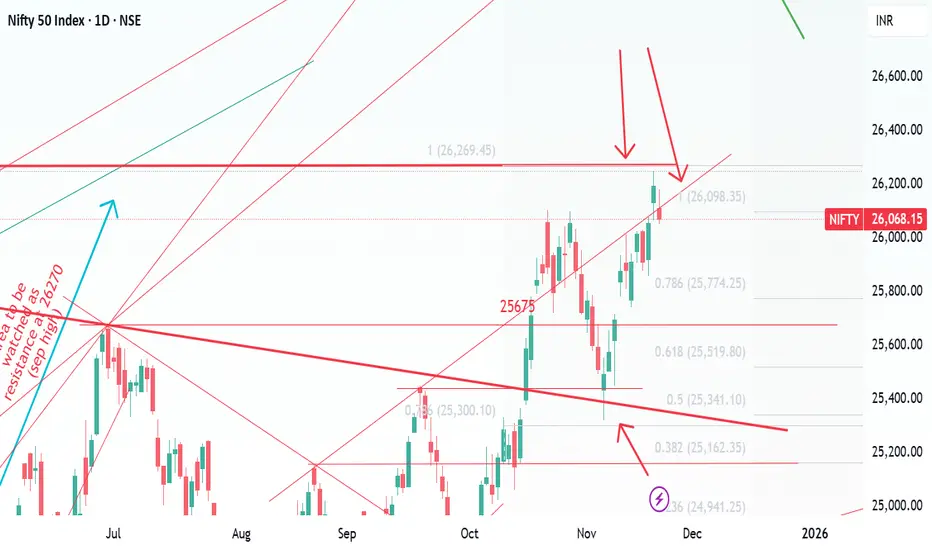
Nifty makes ATH, Profit Booking strikes thereafter. What next?Nifty made a new ATH today exactly after 14 Months although it is a point to rejoice. On the hindsight there is no growth for last 14 months. Such phases do come even in a Bull market but a closing above Today's ATH that is 26310 will be the real turnaround. Sometimes the indices will not reward you for months years and on some other occasions they will cover it up in few weeks or month. Afterall it is law of averages that catches up.
Nifty has been growing from last 20 years approximately around 15% per year. Last 14 months have been lackluster so if things go well Bulls can have a field day or weeks or months in the coming times. What we need is a weekly or monthly closing above 26310. As you can see in the chart the next resistance after 26310 will be around 26433. Major major Breakout above this zone.
Supports for Nifty are near 26141, 26015, 25834 and finally Mother line support is near 25608 on the daily chart.
Disclaimer: The above information is provided for educational purpose, analysis and paper trading only. Please don't treat this as a buy or sell recommendation for the stock or index. The Techno-Funda analysis is based on data that is more than 3 months old. Supports and Resistances are determined by historic past peaks and Valley in the chart. Many other indicators and patterns like EMA, RSI, MACD, Volumes, Fibonacci, parallel channel etc. use historic data which is 3 months or older cyclical points. There is no guarantee they will work in future as markets are highly volatile and swings in prices are also due to macro and micro factors based on actions taken by the company as well as region and global events. Equity investment is subject to risks. I or my clients or family members might have positions in the stocks that we mention in our educational posts. We will not be responsible for any Profit or loss that may occur due to any financial decision taken based on any data provided in this message. Do consult your investment advisor before taking any financial decisions. Stop losses should be an important part of any investment in equity.

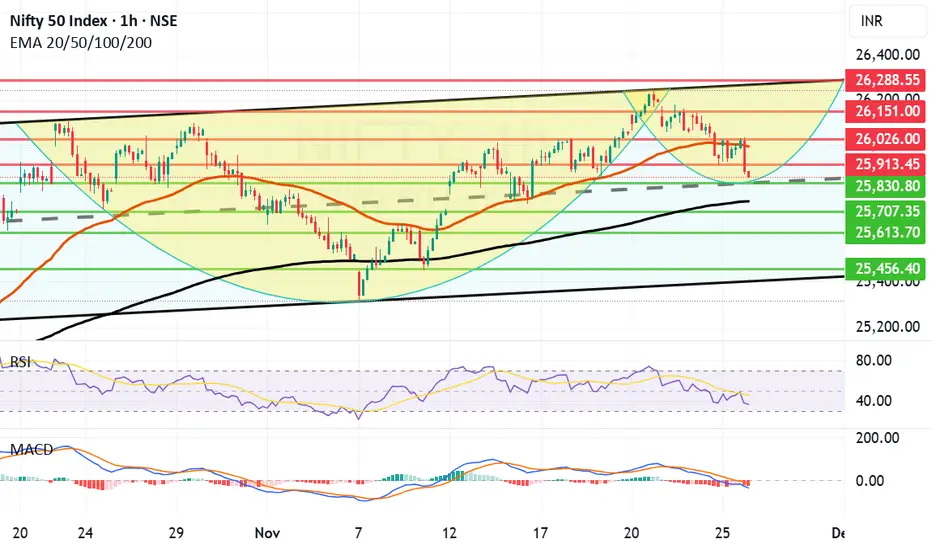
Relentless Profit Booking brings Nifty Further down. What next?The fall in Nifty continued today as again there was again profit booking. However the candles formed in hourly chart indicate that may be a temporary bottom is nearby. The supports nearby are at 25830, 25751 (Father line support, Major Support), 25707, 25613 and finally 25456. The resistance on the upper side for Nifty are at 25913, 25026, 25151 and finally 25288 which can be a new ATH and channel top resistance. (This will be tough to cross.)
The candle still is little bit negative to neutral and MACD is also yet to take a proper turn towards Bullish reversal so little bit of pain still might be there but you never know today's low of 25857 might also work as reversal point.
Disclaimer: The above information is provided for educational purpose, analysis and paper trading only. Please don't treat this as a buy or sell recommendation for the stock or index. The Techno-Funda analysis is based on data that is more than 3 months old. Supports and Resistances are determined by historic past peaks and Valley in the chart. Many other indicators and patterns like EMA, RSI, MACD, Volumes, Fibonacci, parallel channel etc. use historic data which is 3 months or older cyclical points. There is no guarantee they will work in future as markets are highly volatile and swings in prices are also due to macro and micro factors based on actions taken by the company as well as region and global events. Equity investment is subject to risks. I or my clients or family members might have positions in the stocks that we mention in our educational posts. We will not be responsible for any Profit or loss that may occur due to any financial decision taken based on any data provided in this message. Do consult your investment advisor before taking any financial decisions. Stop losses should be an important part of any investment in equity.
Nifty Short & Medium Term Support&Resistance_24-Nov to 28-Nov-25Nifty Short & Medium Term Support&Resistance_24-Nov-25 to 25-Nov-25
Nifty 26068
Long call ( Buy) was given five weeks before at 24896, Nifty crossed near to 1000 points.
Long buy Call was reiterated two weeks before after a dip, with buy on dip for medium to long term perspective.
Quarterly results of companies are being released and so far it have mixed - Postive results.
Margins and revenue growth are major concern, Net profit being achieved by savings on employee cost and other savings. To be more cautious on picking the right stock and rebalance the portfolio.
Overall, Tariffs deal will decide the future path till Dec - Jan for the Nifty. Since it is a Volatile situation SIP route or buy in multiple parcel route with a goal of 3-5 years will workout. US Trade deal, 1st Feb budget and reforms if any will decide Nifty's path.
Some of the stocks to watchout given last week are Warree Energies, HDFC AMC, NMDC, Apar, Sharda Crop, VRL Logistics, krishna Phos chem, Cipla, Dr Reddy, Natco ( Buy on Dip as still there is negative trend), Apl Apollo Tubes, Muthoot Finance ( On Dips) , tata Steel ( Contra Stock due to Business Cycle), Bank of Mah, BPCL, CG Power, hero motor, shriram finance. Shared for Analysis purpose only. Dr Reddy, shriram fin, natco pharma, Hero moto corp,Muthoot Finance have already given more than 10% return in this 1 month.
The strategy continued to be long and use the opportunity to buy on dips similar to SIP.
Current Short Term Resistance 26270 ( all time high). It need to break the resistance 26270 decisively to move up to 27000 target in med-long term. As RSI is up more than 80% for more than two weeks, room to go higher will be less in short term.
Nifty Short Term Supports ( Multiple Supports are there between 25000-25500):
26000
25670 (Jun 2025 High)
25360-25420 ( Sep high and trendline support as shown in chart)
25300-25350 (Two Fibonacci resistance shown ) - Major Support
Hence 25300- 25420 acts as major short term support.
25500 ( 25441 Sep 18th 2025 High )
25450 ( 25442 is the Aug 2025 high)
25200 ( 25154 Aug 2025 high)
25000 ( Milestone)
Short Term Resistance
1.26098 ( Recent two week high)
2.26269 ( All time High)
Medium Term Support:
1.24700 (Trend Line as shown)
2. 24000-24170 (Fibonacci Retracements Supports- Two Supports in this zone 24116 & 24171 as shown)
3. 23500-23700 (Fibonacci Retracements Supports- Two Supports in this zone 23608 & 23707 as shown)
2. 23000
Medium Term Resistance:
1.27000 ( Need to decisively break 26269 all time high) This resistance is based on Fibonacci resistance at 27034
Long term resistance:
1.28000 ( Need to decisively break and move up 27000)This resistance is based on Fibonacci resistance at 28106
Long Term Support
1.22700-23000 ( Trend line and Mar 2024 High)
2.Big support at 20000 (Sep 2023 high)
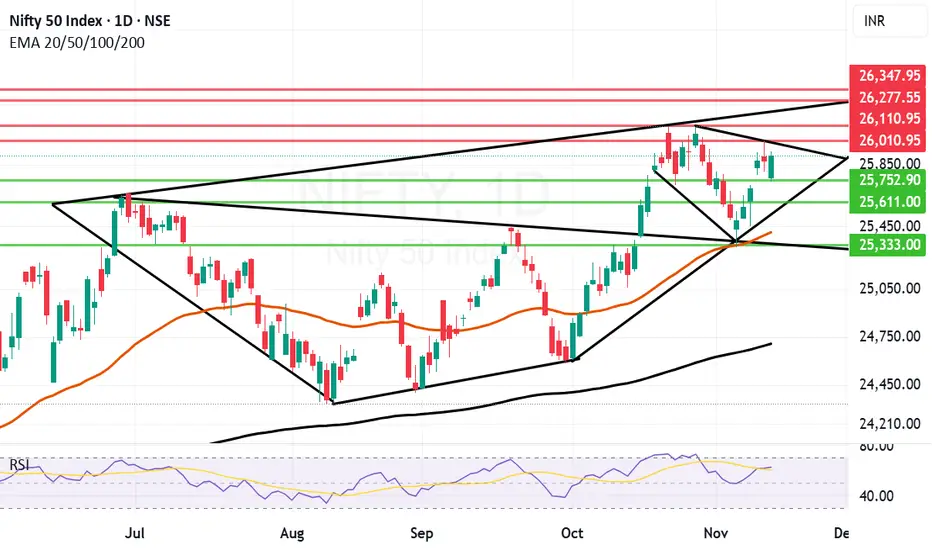
Good for a long haul but can important resistances be crossed? Nifty is good for Long haul and going towards new highs but there are few important resistances to be crossed before that can be achieved. The important resistances up and ahead are at 26010, 26110, 26277 and finally trend top above the previous ATH at 26347. The support for Nifty are at 25752, 25611, 25412 (Mother line support) and finally 25333. 25333 is an important turnaround point a closing below this will bring Nifty into bear grip. Things look ominous for an upsurge but as mentioned and seen in the chart there are few important resistances to be crossed.
To know more about Mother and Father line supports, Mother, Father and Small child theory, Trend lines, supports and resistances you can read my book THE HAPPY CANDLES WAY TO WEALTH CREATION. The book is currently rated 4.8/5 on Amazon. It is reasonably priced and it can work as a handbook to wealth creation through equity. It is a value for money book, do read it.
Disclaimer: The above information is provided for educational purpose, analysis and paper trading only. Please don't treat this as a buy or sell recommendation for the stock or index. The Techno-Funda analysis is based on data that is more than 3 months old. Supports and Resistances are determined by historic past peaks and Valley in the chart. Many other indicators and patterns like EMA, RSI, MACD, Volumes, Fibonacci, parallel channel etc. use historic data which is 3 months or older cyclical points. There is no guarantee they will work in future as markets are highly volatile and swings in prices are also due to macro and micro factors based on actions taken by the company as well as region and global events. Equity investment is subject to risks. I or my clients or family members might have positions in the stocks that we mention in our educational posts. We will not be responsible for any Profit or loss that may occur due to any financial decision taken based on any data provided in this message. Do consult your investment advisor before taking any financial decisions. Stop losses should be an important part of any investment in equity.
Volatile day where Nifty Bulls beat the Bears. Today we saw a volatile session in Nifty where Nifty initially collapsed to 25449 but then again rose to regain level above 25650 closing at 25694. The candle we saw today confirms a bullish trend.
Exit Poll indicative of the Government that Market likes will retain Bihar. Trump is signalling reduction of Tariff. So overall it can trigger a further up trend but you never say never in the market. Market can always surprise you but Shadow of the candles currently is positive.
The resistances for Nifty now remain at 25708, 25819, 26004, 26115, 26277, 26306 and finally the channel top remains at 26498. Supports for Nifty now remain at 25440, 25352, 25239, 24892, 24670 and 24292.
Disclaimer: The above information is provided for educational purpose, analysis and paper trading only. Please don't treat this as a buy or sell recommendation for the stock or index. The Techno-Funda analysis is based on data that is more than 3 months old. Supports and Resistances are determined by historic past peaks and Valley in the chart. Many other indicators and patterns like EMA, RSI, MACD, Volumes, Fibonacci, parallel channel etc. use historic data which is 3 months or older cyclical points. There is no guarantee they will work in future as markets are highly volatile and swings in prices are also due to macro and micro factors based on actions taken by the company as well as region and global events. Equity investment is subject to risks. I or my clients or family members might have positions in the stocks that we mention in our educational posts. We will not be responsible for any Profit or loss that may occur due to any financial decision taken based on any data provided in this message. Do consult your investment advisor before taking any financial decisions. Stop losses should be an important part of any investment in equity.
