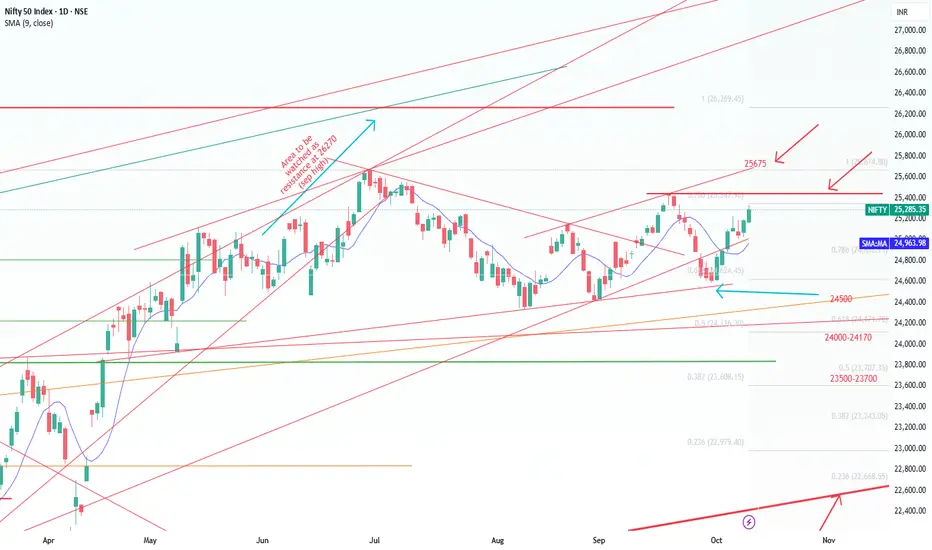
Nifty Short & Medium Term Support&Resistance_13-Oct to 17-Oct-25Nifty Short & Medium Term Support&Resistance_13-Oct to 17-Oct-25
Nifty 24894
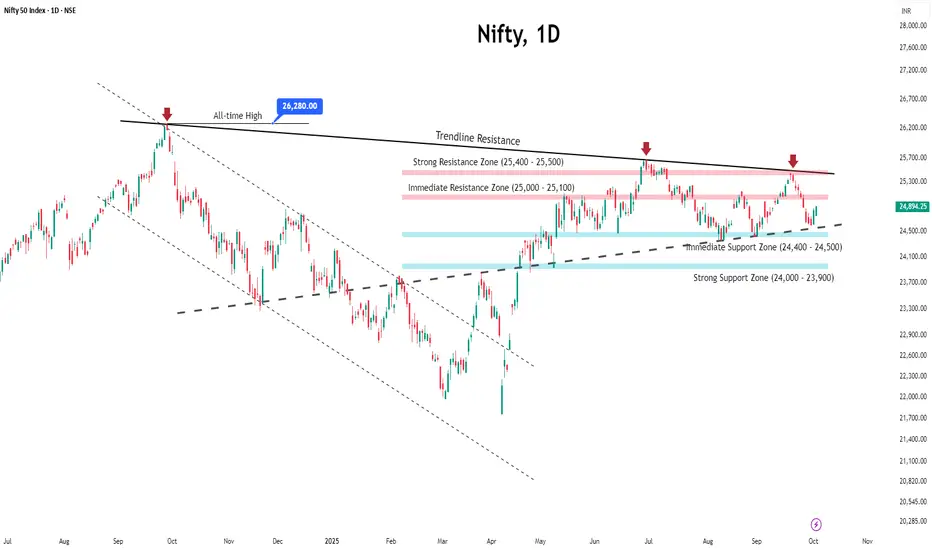
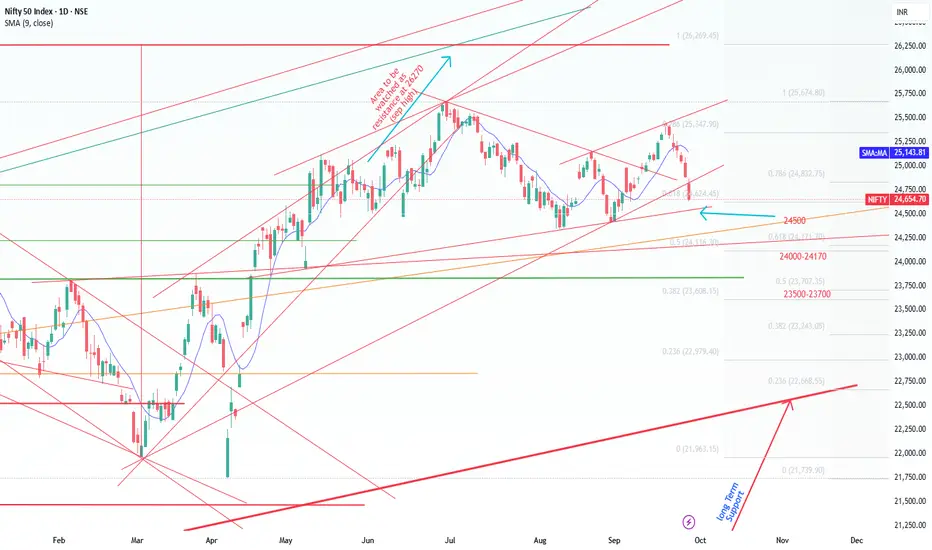
As predicted last week, Nifty very well hold the 24500 Support and currently moved near to the first resistance 25000.
One more positive decisive break above Ist Short Term Resistance as given below in order market to move up.
Quarterly result started coming out slowly, TCS posted average result, Warree Renewables posted vgood results (PE is very high) .
Qtrly Results and Tariffs deal will decide the future path of the Nifty. Since it is a Volatile situation SIP route or buy in multiple parcel route with a goal of 3-5 years will workout.
Recent 100% additional tariff on China got severe effect on US market on Friday, it will affect global other trade markets too on Monday. Mainly due to the uncertainty prevailing over.
However, for India though initial drop market tend to move up to 25670 ( Jun 2025 all time high).
Repo and FD rate reduction by RBI, people may have to choose Debt/Commodity/Equity as alternate in order to beat the inflation.
Apart from that Low Cost ULIPs (2.5 L Limit per person) as one of the option to save the tax- ICICI & HDFC ULIPs are doing well, ULIPs are simplified and charges are lesser compared to MFs in terms of long term, Various fund option including passive funds are introduced.
Market was on decline/ Consolidation mode recently because of new Tariff's imposed by Trump mainly on Pharma and IT - H1 B Visa and Tax for Outsourcing IT and the recent pharma tarrifs imposition.
GST 2.0 is a reform which can aid in Auto/ FMCG / Home Appliances sales will get a boost due to the festival season.
Since market is volatile, use the dips (Opportunity) and buy through SIP or through multiple parcel in these uncertain times with a goal of 3-5 years.
Nifty Short Term Supports:
1. 24500 (Trend Line as shown)
2. 24000-24170 (Fibonacci Retracements Supports- Two Supports in this zone 24116 & 24171 as shown)
Medium Term Support:
3. 23500-23700 (Fibonacci Retracements Supports- Two Supports in this zone 23608 & 23707 as shown)
4. 23000
Resistance ( Multiple Resistances are there between 25000-25650):
1. 25000
2. 25200 ( 25154 Aug 2025 high)
3.25350 ( Fibonacci resistance shown )
4.25450 ( 25442 is the Aug 2025 high)
3. 25500 ( 25441 Sep 18th 2025 High )
Medium Term:
1.25670 ( Jun 2025 High) Should cross this resistance in short term decisively inorder to move up.
2.26269 ( Sep 2024 High)
Niftyanalysis
Weekly Market Outlook | Nifty · BankNifty · S&P 500Nifty closed 25,285 (+390 pts) after making 25,330 / 24,881 — once again perfectly respecting my range of 25,300–24,500! 💪
As expected, BankNifty confirmed its W-pattern breakout, jumping 2% — strength clearly visible in the PSU bank pack.
Next week focus
• Above 25,450 → breakout toward 25,700+
• Below 25,130 → selling pressure till 25,000 / 24,850
Range for the week: 25,700–24,850
Shorters, stay patient — only if BankNifty cracks 55,700 does weakness confirm. Till then, it’s buy-on-dips for me.
Global cue: Trump’s proposed 100% China tariff shook US & crypto markets — watch its spillover effect on sentiment.
S&P 500 closed 6,552 (-160 pts). Holding above 6,360 = buy-on-dips;
Above 6,625 → uptrend resumes.
Below 6,360 → correction toward 6,225 / 6,142 / 6,100.
Exciting week ahead for both momentum traders & option sellers!

Nifty Pauses Below Resistance, Eyes Earnings-Driven MoveIndian markets closed on a strong note last week, with the Nifty rising over 1.5% to 25,285. The rally was led by IT sector (up nearly 5%) and PSU banks (up around 1.5%), reflecting sectoral strength during the earnings season.
The India VIX inched up 0.42% to 10.10, still near multi-month lows, though volatility may rise as corporate results roll in.
Technically, the Nifty is now testing a crucial resistance zone at 25,400–25,500, aligning with the apex of a large symmetrical triangle pattern. Open interest data shows heavy call writing at this zone, while strong put writing around 25,100–25,200 indicates immediate support. A decisive breakout on either side may set the tone for the next directional move.
Looking ahead, some consolidation or range-bound movement is likely as the market digests earnings and global developments. US–China trade tensions and semiconductor supply chain concerns may weigh on sentiment if risks intensify.
Given the current setup, traders are advised to adopt a cautious, stock-specific approach. While the broader bias remains positive, protecting profits and avoiding aggressive long positions until a clear breakout is confirmed would be prudent.

Nifty on the verge of a Trendline breakout. Nifty did a great job today by closing above a very important resistance of 25128. Now the major hurdle seems to be near the trendline which is near 25228. Once this range is crossed the next hurdles will be at 25306, 25431 and channel top near 25579. The supports for Nifty are at 25128. Mother line support near 25021 which is also a mid channel support. (Making this area a very strong support). Followed by 24965 (Father line support). If by chance father line support is broken we can see Nifty falling towards 24806 or even 24601 which is the channel bottom support. As of now the shadow of the candle seems to be positive (Green).
To know mover about Mother line, Father line, Mid channel support / resistance, Chanel top resistnace and channle bottom support, trend line support and resistance (To understand the role of Mother line and Father line) or to be able to draw resistances and supports based on historic peaks and valleys you can read my book THE HAPPY CANDLES WAY TO WEALTH CREATION. The book is available in Amazon in paperback or Kindle version and is rated 4.8/5. This book teaches you Techno-Funda investing. (Techno Funda investing means Knowing which are Fundamentally strong companies and investing / booking profits / staying invested in them based on Technical analysis). The book has some more unique features like rating a stock with the help of Happy Candles Number wherein you can give a stock marks out of 100 based on Techincal and Fundamental analysis you have learned by reading it. Thus you can know if the stock is currently investible or not based on the marks it scores out of 100. The book also covers various aspect of behavioural finance. Lot of people who have read the book consider it as a hand book to equity investing. Buy the book you will not be dissapointed as the book is reasonably priced. Search by the key words The Happy Candles Way to wealth creation and you will get it.
Disclaimer: The above information is provided for educational purpose, analysis and paper trading only. Please don't treat this as a buy or sell recommendation for the stock or index. The Techno-Funda analysis is based on data that is more than 3 months old. Supports and Resistances are determined by historic past peaks and Valley in the chart. Many other indicators and patterns like EMA, RSI, MACD, Volumes, Fibonacci, parallel channel etc. use historic data which is 3 months or older cyclical points. There is no guarantee they will work in future as markets are highly volatile and swings in prices are also due to macro and micro factors based on actions taken by the company as well as region and global events. Equity investment is subject to risks. I or my clients or family members might have positions in the stocks that we mention in our educational posts. We will not be responsible for any Profit or loss that may occur due to any financial decision taken based on any data provided in this message. Do consult your investment advisor before taking any financial decisions. Stop losses should be an important part of any investment in equity.

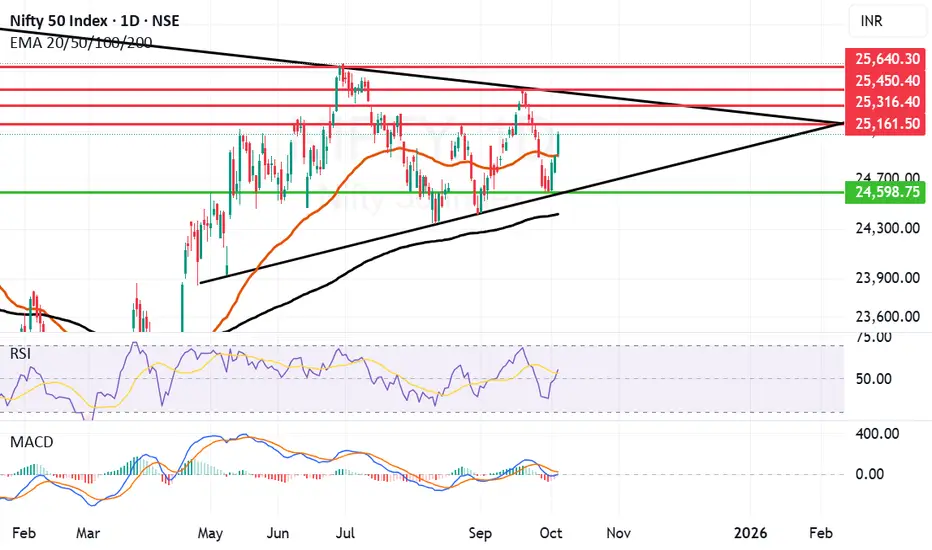
Great Closing above Motherline of Daily Chart. Nifty has given a brilliant closing above Mother line of daily chart and key psychological level of 25K at 25077. Supports for Nifty are at Mother line 24899, Trend line support at 24598 and finally Father line support at 24417. Resistances are at 25161, 25316 and 25450 and finally 25640.
Above 25640 there will be a major Bullish breakout which can take us to 26K or even previous All time high or even beyond it. It will be very important for Nifty to hold the levels now and again not go below the Mother or Father line otherwise again all the momentum that has built in favour of the rally will vanish as quickly.
Having said that RSI, MACD and shadow of the candle suggest are oozing with confidence this time let us see what this week and month holds for us, things look good as of now.
Disclaimer: The above information is provided for educational purpose, analysis and paper trading only. Please don't treat this as a buy or sell recommendation for the stock or index. The Techno-Funda analysis is based on data that is more than 3 months old. Supports and Resistances are determined by historic past peaks and Valley in the chart. Many other indicators and patterns like EMA, RSI, MACD, Volumes, Fibonacci, parallel channel etc. use historic data which is 3 months or older cyclical points. There is no guarantee they will work in future as markets are highly volatile and swings in prices are also due to macro and micro factors based on actions taken by the company as well as region and global events. Equity investment is subject to risks. I or my clients or family members might have positions in the stocks that we mention in our educational posts. We will not be responsible for any Profit or loss that may occur due to any financial decision taken based on any data provided in this message. Do consult your investment advisor before taking any financial decisions. Stop losses should be an important part of any investment in equity.
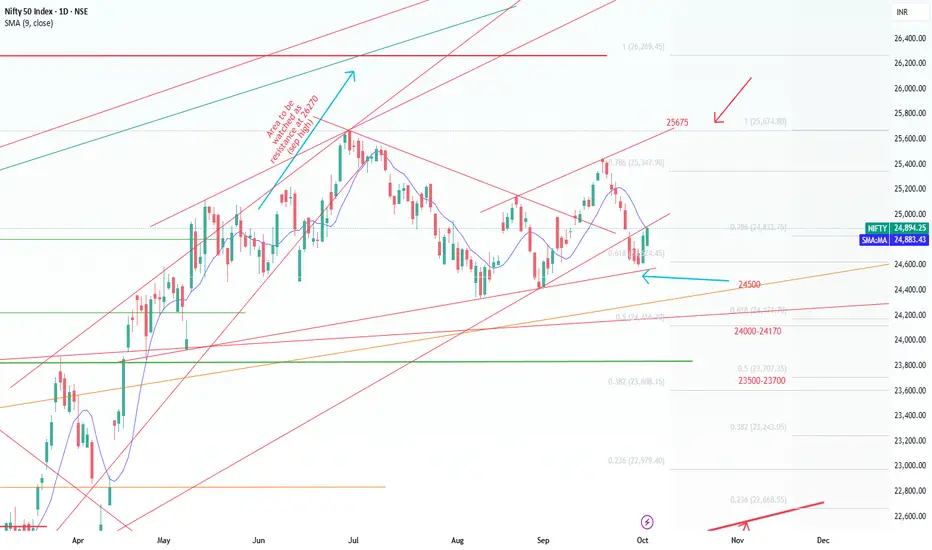
Nifty Short & Medium Term Support&Resistance_5-Oct to 10-Oct-25Nifty Short & Medium Term Support&Resistance_5-Oct to 10-Oct-25
Nifty very well hold the 24500 Support and currently near to the trend line support (as drawn) as mentioned last week.
Repo rate reduction by RBI boosted the market as there will be more liquidity in the market and it will aid more loan disbursal. But there is a small concern is FD rate reduction and inflation may go little higher.
Last two days trade reflected it and market moved up, one more positive decisive break can take to short term resistance.
Quarterly result and Tariffs deal will decide the future path of the Nifty. Since it is a Volatile situation SIP route or buy in multiple parcel route with a goal of 3-5 years will workout.
Since FD rate reduction, people may have to choose Debt/Commodity/Equity as alternate in order to beat the inflation.
Apart from that Low Cost ULIPs (2.5 L Limit per person) as one of the option to save the tax- ICICI & HDFC ULIPs are doing well, ULIPs are simplified and charges are lesser compared to MFs in terms of long term, Various fund option including passive funds are introduced.
Market was on decline/ Consolidation mode recently because of new Tariff's imposed by Trump mainly on Pharma and IT - H1 B Visa and Tax for Outsourcing IT and the recent pharma tarrifs imposition.
GST 2.0 is a reform which can aid in Auto/ FMCG / Home Appliances sales will get a boost due to the festival season.
Since market is volatile, use the dips (Opportunity) and buy through SIP or through multiple parcel in these uncertain times with a goal of 3-5 years.
Nifty Short Term Supports:
1. 24500 (Trend Line as shown)
2. 24000-24170 (Fibonacci Retracements Supports- Two Supports in this zone 24116 & 24171 as shown)
Medium Term Support:
3. 23500-23700 (Fibonacci Retracements Supports- Two Supports in this zone 23608 & 23707 as shown)
4. 23000
Resistance ( Multiple Resistances are there between 25000-25650):
1. 25000
2. 25200 ( 25154 Aug 2025 high)
3.25350 ( Fibonacci resistance shown )
3. 25500 ( 25441 Sep 18th 2025 High )
Medium Term:
1.25670 ( Jun 2025 High) Should cross this resistance in short term decisively inorder to move up.
2.26269 ( Sep 2024 High)
Positive Sentiment Drives Nifty Higher, Resistance in SightThe Nifty 50 closed the week on a positive note, rising nearly 1%, supported by strong macro cues and sectoral gains.
RBI Policy Boost:
The Reserve Bank of India kept the repo rate unchanged at 5.50% for the second straight meeting while raising FY26 GDP growth to 6.8% and lowering the inflation forecast — a move that lifted overall market sentiment.
Sector Highlights:
Banking stocks led the rally, with Bank Nifty up over 2% as private lenders like Kotak Mahindra Bank and Axis Bank posted solid gains.
Metals also shined, with Nifty Metal up 1.85%, driven by optimism over potential Fed rate cuts and a weaker dollar.
Key Levels to Watch:
Resistance: 25,000–25,100 remains a tough barrier. A breakout above 25,100 could spark a rally toward 25,400.
Support: 24,400–24,500 is the key zone to hold. A dip below this may trigger renewed selling pressure
Outlook:
The market is expected to consolidate within the current range, with sector rotation likely to drive short-term moves. Overall sentiment remains constructive as long as Nifty holds above key support levels.
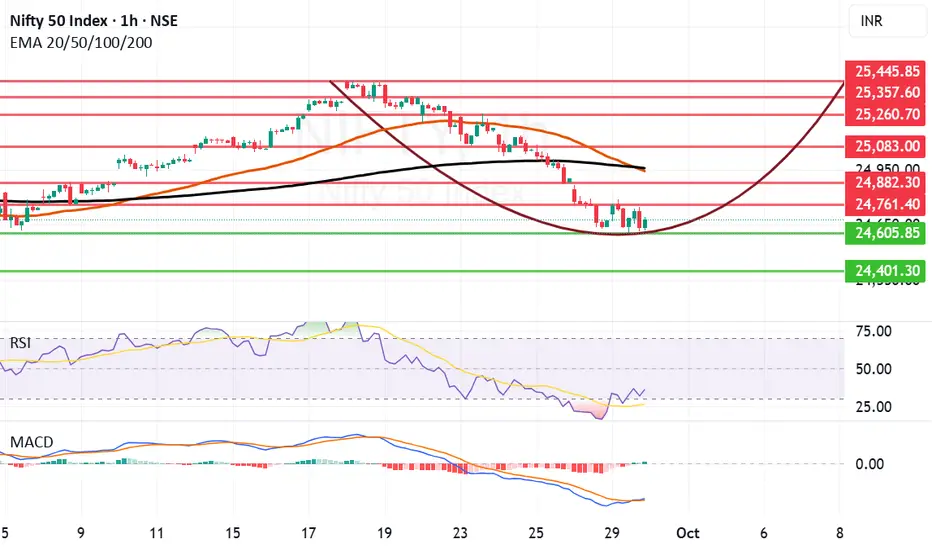
Temporary Bottom formations seems to be happening in Nifty. It seems that Nifty is trying to form a bottom around 24605 levels. If this level is broken the next support seems to be near 24401. On the upper side the seem to be near 24761 and 24882. If we get a closing above 24882 the most important resistance will be at 24944 and 24960 where we have the Mother and the father line respectively. Bulls will get back in business above 24960 with further resistances at 25083 and 25260. these seem to be the levels to watch out this week.
Mark Mobius veteran investor looks at Sesex reaching 100,000 within 1 year. Corresponding level for Nifty can be close to 27K+ this is the news on the positive side. RSI has started to move in a positive direction. Moving Average Convergence and Divergence has given a slight indication showing the trend might change sooner rather than later.
To learn more about my Mother, Father and Small Child Theory, RSI, MACD, Profit booking averaging and other Techno-Funda aspects of investing you can read my book THE HAPPY CANDLES WAY TO WEALTH CREATION. It is a book considered by many as a hand book to equity investment. Currently the book enjoys 4.8/5 Star rating on Amazon. Paperback edition or Kindle edition can be bought from there or many other sources.
Disclaimer: The above information is provided for educational purpose, analysis and paper trading only. Please don't treat this as a buy or sell recommendation for the stock or index. The Techno-Funda analysis is based on data that is more than 3 months old. Supports and Resistances are determined by historic past peaks and Valley in the chart. Many other indicators and patterns like EMA, RSI, MACD, Volumes, Fibonacci, parallel channel etc. use historic data which is 3 months or older cyclical points. There is no guarantee they will work in future as markets are highly volatile and swings in prices are also due to macro and micro factors based on actions taken by the company as well as region and global events. Equity investment is subject to risks. I or my clients or family members might have positions in the stocks that we mention in our educational posts. We will not be responsible for any Profit or loss that may occur due to any financial decision taken based on any data provided in this message. Do consult your investment advisor before taking any financial decisions. Stop losses should be an important part of any investment in equity.
Market Mood Turns Sour as Nifty Slips Below 25KThe Nifty 50 ended its three-week winning streak with a sharp fall of ~2.6% , slipping below the crucial 25,000 psychological mark .
What Triggered the Decline?
● Global headwinds weighed on sentiment as trade tensions resurfaced, hurting risk appetite across equity markets.
● Domestic pressures coupled with persistent selling by foreign investors added to the weakness.
● Foreign Institutional Investors (FIIs) offloaded equities worth over ₹5,500 crore during the week.
● Concerns around a potential change in U.S. H-1B visa norms spooked the IT sector, a key driver of Indian exports.
Technical Backdrop
● The index has now fallen for 7 straight sessions , showing clear downward momentum.
● Immediate support: 24,400–24,500 zone. A break below this could drag the index toward the 23,900–24,000 strong support zone.
● Resistance levels: After slipping below the 25,000 mark, this level will now act as an immediate resistance. Strong resistance is placed at 25,400–25,500.
Market Outlook
With global uncertainties and foreign outflows, cautiousness and volatility are likely to dominate sentiment heading into October.
Strategy for Traders & Investors
● Maintain strict stop-loss discipline and manage position sizing carefully in this environment.
● For short-term traders: watch the 24,400–24,500 support zone for signs of reversal or breakdown.
● For investors: remain selective, focus on quality stocks, and avoid chasing momentum until stability returns.

Nifty Short & Medium Term SupportsNifty on a decline mode because of new Tariff's imposed by Trump mainly on Pharma this week.
Primarily New announcement on IT - H1 B Visa and Tax for Outsourcing IT and the recent pharma tarrifs are the concern.
Use the dips (Opportunity) and buy through SIP or through multiple parcel in this uncertain times with a goal of 3-5 years.
Nifty Short Term Supports:
1. 24500 ( Trend Line as shown )
2. 24000-24170 (Fibonacci Retracements Supports- Two Supports in this zone 24116 & 24171 as shown)
Medium Term Support:
3. 23500-23700 ( Fibonacci Retracements Supports- Two Supports in this zone 23608 & 23707 as shown)
4. 23000
Resistance:
1. 25000
2. 25200 ( 25154 Aug 2025 high)
3. 25500 ( 25441 Sep 18th 2025 High )
Medium Term:
1.25670 ( Jun 2025 High)
2.26269 ( Sep 2024 High)
Nifty : Expecting short term bearishnessThe price has now broken below both its 20-day and 50-day EMAs with momentum, signalling a shift in market character and underlying weakness.
At the same time, institutional flows have been unimpressive over the past several sessions — foreign institutions (FIIs) have been net sellers, while domestic institutions (DIIs) are offering only modest support.
From a valuation lens, the index trades at a P/E of ~22x, roughly in the ballpark of its historical average — not cheap enough to invoke a confident “value play.”
With Q2 earnings starting to trickle out from the second week of October, the key question is: will companies deliver meaningful upside surprises? In the absence of strong earnings triggers or fresh catalysts, there’s a heightened risk of further downside.
Thus, rather than chasing new swing positions now, a more prudent approach is to pause, reassess, and wait for clearer confirmation of stability or reversal before reentering.
📢📢📢
If my perspective changes or if I gather additional fundamental data that influences my views, I will provide updates accordingly.
Thank you for following along with this journey, and I remain committed to sharing insights and updates as my trading strategy evolves. As always, please feel free to reach out with any questions or comments.
Other posts related to this particular position and scrip, if any, will be attached underneath. Do check those out too.
Disclaimer : The analysis shared here is for informational purposes only and should not be considered as financial advice. Trading in all markets carries inherent risks, and past performance is not indicative of future results. It’s essential to conduct your own research and assess your risk tolerance before making any investment decisions. The views expressed in this analysis are solely mine. It’s important to note that I am not a SEBI registered analyst, so the analysis provided does not constitute formal investment advice under SEBI regulations.

Nifty Rides 3-Week Rally, Faces Tough Resistance AheadThe Indian benchmark indices extended their rally for the third week in a row, reinforcing the ongoing bullish sentiment.
From a technical perspective, Nifty is trading just below its long-term trendline resistance, where it recently lost some steam. Immediate support lies in the 25,200–25,300 zone, while resistance is expected around 25,400–25,500, due to heavy call writing.
On the global front, markets were briefly unsettled after Donald Trump announced a sharp H-1B visa fee hike, triggering concerns for Indian IT companies. However, clarity came soon after — the White House confirmed that the $100,000 fee would apply only to new petitions, not to renewals or existing holders. This eased fears, ensuring minimal impact on ongoing IT operations.
Outlook: Nifty may witness short-term swings amid global uncertainties, but the broader setup still points to an underlying bullish trend.

Nifty trying to inch back into Bullish territoryNifty has done a good job so far in the last 2 weeks to inch back towards bullish territory. This was the second week where we saw a fantastic Green candle. We saw Nifty close above an important Fibonacci resistance of 24994 at 25114.
The Next major Fibonacci resistances are at 25152 which is very near and 25378 which might also look relatively nearby. Once we get a closing above these 2 levels the next targets for Nifty will be at 25669, 26044 and 26529. Let us see if Nifty momentum takes us above 25152 or 25378 within next week.
If the resistance stops nifty growth the supports for Nifty will be at Fibonacci levels of 24994, 24804, 24645 (next strong Fibonacci support). Final support for Nifty before it falls back into bearish zone will be at 24337. Mother line support of 50 Weeks EMA is at 24144.
Shadow of the candle looks positive as of now and RSI is also slowly getting into the Bullish zone. Currently the RSI of Weekly chart is 56.99 which is very conducive for further progress.
Disclaimer: The above information is provided for educational purpose, analysis and paper trading only. Please don't treat this as a buy or sell recommendation for the stock or index. The Techno-Funda analysis is based on data that is more than 3 months old. Supports and Resistances are determined by historic past peaks and Valley in the chart. Many other indicators and patterns like EMA, RSI, MACD, Volumes, Fibonacci, parallel channel etc. use historic data which is 3 months or older cyclical points. There is no guarantee they will work in future as markets are highly volatile and swings in prices are also due to macro and micro factors based on actions taken by the company as well as region and global events. Equity investment is subject to risks. I or my clients or family members might have positions in the stocks that we mention in our educational posts. We will not be responsible for any Profit or loss that may occur due to any financial decision taken based on any data provided in this message. Do consult your investment advisor before taking any financial decisions. Stop losses should be an important part of any investment in equity.

Nifty Holds Above 25K, Market Drivers Signal More UpsideNifty’s winning streak hit eight sessions, closing above psychological 25,000 mark as global optimism and strong domestic cues kept the rally alive.
Technical View
● The index has registered a fresh breakout above the trendline resistance, pointing toward renewed bullish momentum.
Key Levels to Watch
● Immediate resistance is seen around 25,200–25,300, while a stronger hurdle lies at 25,500–25,600.
● Support has shifted higher to 25,000–24,900, keeping the short-term outlook positive.
Market Drivers
● Global cues: Hopes of a US Fed rate cut and progress on the India–US trade deal have lifted market sentiment.
● Domestic macros: India’s economy looks strong with solid financial stability, steady GDP growth, and easing inflation.
● Consumer demand: Spending is expected to rise sharply after September 22, especially in automobiles and consumer durables, which could boost markets in the near term.
● Policy & earnings: Market mood is supported by GST reforms, easier monetary policy, and positive earnings expectations for the second half of FY26.
Strategic View
● The overall market trend is expected to stay positive. Traders should follow a buy-on-dips strategy with strict stop-losses. As long as Nifty holds above support, it can gradually move higher in the coming sessions.

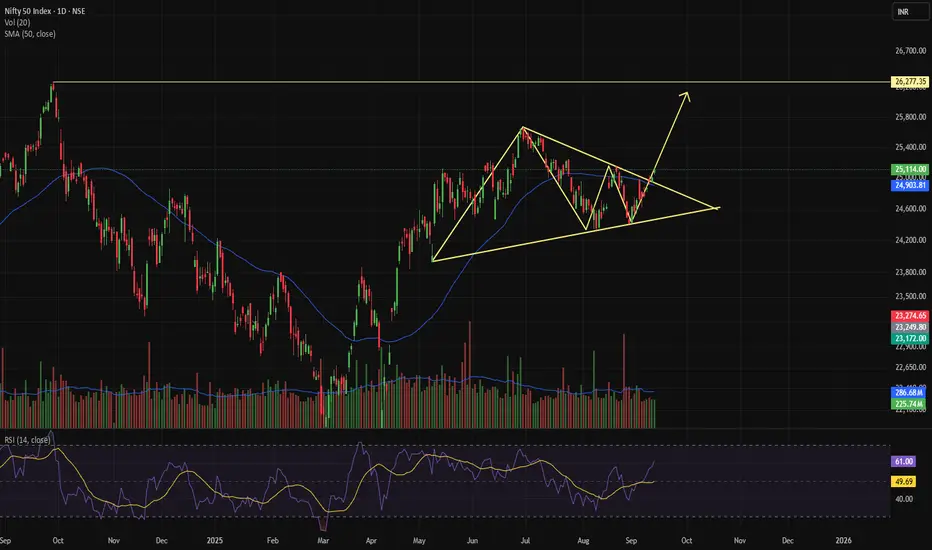
NIFTY- READY FOR UP MOVE CONFIRMATION OF TRIANGLE PATTERNThe daily candle closed above the triangle pattern, indicating a potential upward move, and the RSI index is currently at a value of 61. The first target may be the 25,650 level, while the second target could be the 26,250 level. The market is also finding support at the 50 DSMA, which reinforces the triangle pattern.
NIFTY BREACHED TRIANGLE PATTERNDaily candle of nifty successfully breached the triangle pattern. 15-minute candle is trading between 24915 to 25035 level since last two days and closed above a trend line with support of VWAP and RSI is also showing strength. A sustainable closing above 25035 level will give buy for intraday position as well as for Positional trade.

Nifty Analysis EOD – September 10, 2025 – Wednesday🟢 Nifty Analysis EOD – September 10, 2025 – Wednesday 🔴
📌 Doji at Resistance – Market in Consolidation Grip
🗞 Nifty Summary
Nifty opened with a 114-point gap-up, well above the previous day’s high and right in the middle of the strong resistance zone of 24,975 ~ 25,004. Initially, the index attempted to stabilize and hold above 25,000, but couldn’t sustain the level. It gradually lost ground, broke the VWAP and day’s low, marking a low of 24,915.
A recovery of 75 points from the low brought Nifty back to 24,977.5 at close, resulting in a Doji candle formed near the middle of the resistance zone.
Such large gap-ups or gap-downs are not favorable for intraday players, and positional BTST option buyers were left vulnerable, as the first-minute slip wiped out initial gains.
🛡 5 Min Intraday Chart with Levels
📉 Daily Time Frame Chart with Intraday Levels
🕯 Daily Candle Breakdown
Open: 24,991.00
High: 25,035.70
Low: 24,915.05
Close: 24,973.10
Change: +104.50 (+0.42%)
🏗️ Structure Breakdown
Red candle (Close < Open).
Body: 17.90 points → small.
Upper wick: 44.70 points.
Lower wick: 58.05 points.
This forms a Spinning Top-type candle with long shadows on both sides → indicative of intraday tug-of-war.
📚 Interpretation
Market opened near 25,000, briefly touched 25,035, but sellers rejected higher levels.
Buyers defended 24,915, as seen from the long lower wick.
Closing slightly below open signals mild bearish pressure despite overall gains compared to the previous close.
This is a classic indecision candle, with bulls managing to hold ground but failing to assert dominance.
🕯Candle Type
Spinning Top / Indecision Candle with balanced pressure leaning slightly bearish (due to red close).
📉📈 Short-Term View – September 11, 2025
Support: 24,910 – 24,915 (defended today).
Resistance: 25,030 – 25,050 (strong supply zone with multiple rejections).
👉 Key Insight:
Bulls are trying to protect 24,900 but facing strong resistance near 25,030–25,050.
Market is consolidating and coiling tighter between 24,900–25,050.
A breakout above 25,050 may trigger fresh momentum towards 25,160, while a dip below 24,900 opens risk toward 24,750.
🛡 5 Min Intraday Chart
⚔️ Gladiator Strategy Update
ATR: 193.36
IB Range: 59.3 → Small
Market Structure: Balanced
Trade Highlights:
10:30 AM – Long Trigger → SL Hit
13:20 PM – Short Trigger → SL Hit
📌 Support & Resistance Levels
Resistance Zones:
24,975 ~ 25,004
25,035 ~ 25,140
25,160
Support Zones:
24,915 ~ 24,895
24,845 ~ 24,835
24,785
💡 Final Thoughts
Today’s indecisive spinning top reflects a market stuck in consolidation, caught between supply and demand. Until a decisive breakout occurs, avoid large positional bets and remain focused on intraday tactical trades.
📖 “Patience in consolidation builds the strongest trends later.”
✏️ Disclaimer
This is just my personal viewpoint. Always consult your financial advisor before taking any action.

Mother Line Resistance and Trend line Resistance stopping Nifty.Two important Resistances on the daily chart Mother line at 24788 and Trend line which is at 24910 are stopping Nifty from flying high. The sectoral index providing maximum support and allowing Nifty to hold above 24700 is defiantly Auto sector which is doing heavy weight lifting. Again today Auto index rose by 3.3%. It can still grow a bit but it is clearly entering the overbought zone. The sector looking most laggard is IT index. Again today it fell close to 1% with no respite in sight with torrid signals still coming from US.
With this seesaw battle continuing Resistances for Nifty currently are at: 24788 (Mother line resistance) and 24910 trendline resistance. If these 2 resistances are crossed the major resistances will be at 25K, 25149 and 25245. Above 25245 Nifty can grow stronger and reach bullish territory.
Supports for Nifty currently remain at: 24621, 24486 (trendline support), 24409 and finally 24292 (Father line Support). A closing below 24292 will drag Nifty further downwards into a strong bearish territory.
Nifty can rise from here and reach 24910 where it will be tested or it can fall towards 24621 or 24486 and then again try to rise towards the trend line at 24910. Which path it will take is yet to be deciphered.
To know more about Trend lines, Supports, Resistances, Mother line and Father line and to draw the same on your chart and for learning Techo-Funda analysis read my Book THE HAPPY CANDLES WAY TO WEALTH CREATION. The book is available on Amazon and will help you in your investing journey whether you are a seasoned investor or a new beginner. The chapters in the book are mostly standalone. The book is rated 4.8/5 on Amazon. It is a value for money book priced at Rs.349/- (Delivery charges extra as charged by Amazon).
Disclaimer: The above information is provided for educational purpose, analysis and paper trading only. Please don't treat this as a buy or sell recommendation for the stock or index. The Techno-Funda analysis is based on data that is more than 3 months old. Supports and Resistances are determined by historic past peaks and Valley in the chart. Many other indicators and patterns like EMA, RSI, MACD, Volumes, Fibonacci, parallel channel etc. use historic data which is 3 months or older cyclical points. There is no guarantee they will work in future as markets are highly volatile and swings in prices are also due to macro and micro factors based on actions taken by the company as well as region and global events. Equity investment is subject to risks. I or my clients or family members might have positions in the stocks that we mention in our educational posts. We will not be responsible for any Profit or loss that may occur due to any financial decision taken based on any data provided in this message. Do consult your investment advisor before taking any financial decisions. Stop losses should be an important part of any investment in equity.

Nifty Analysis EOD – September 3, 2025 – Wednesday🟢 Nifty Analysis EOD – September 3, 2025 – Wednesday 🔴
🚀 Inside-Day Rebound: Bulls Eye 24,760 Breakout
🗞 Nifty Summary
Early in the morning, Gift Nifty indicated a gap of more than 50 points, yet surprisingly, Nifty opened with a GapUp of 55 points. Within the first 5 minutes, it lost 97 points and matched Gift Nifty.
The first 5-min range formed at 24,533 ~ 24,630, and the first half of the session was spent consolidating inside this band. Around 12 PM, a breakout attempt above the range high failed to sustain. However, support at 24,600 held firm, and on the second attempt, bulls pushed strongly, breaking past the range high and rallying without looking back, marking the day high at 24,737.
By the close, Nifty held strong near the high at 24,713.6, almost covering yesterday’s lost ground.
🛡 5 Min Intraday Chart with Levels
🔮 Key Takeaway:
The move stayed entirely inside the previous day’s range.
For bullish continuation, 24,745 ~ 24,760 needs to be broken and sustained.
If tomorrow brings a PDH breakout & hold, the upside levels to watch are 24,800, 24,855, and 24,900.
📉 Daily Time Frame Chart with Intraday Levels
🕯 Daily Candle Breakdown
Open: 24,616.50
High: 24,737.05
Low: 24,533.20
Close: 24,715.05
Change: +135.45 (+0.55%)
📊 Candle Structure
Green candle (Close > Open).
Body: 98.55 points → healthy bullish body.
Upper wick: 22.00 points → very small (close near high).
Lower wick: 83.30 points → strong defense by buyers near 24,533.
📌 This forms a near Bullish Marubozu (open near low, close near high).
🔍 Interpretation
Market opened with mixed sentiment but defended the 24,520 zone strongly.
Bulls stepped in and pushed the index steadily higher.
Closing near the high signals confidence and follow-up buying after yesterday’s hesitation.
🔦 Candle Type
Bullish Marubozu–like candle
Indicates strength and continuation potential.
📉📈 Short-Term View
Resistance: 24,740–24,760 zone (tested again today).
Support: 24,520 (bu
yers defended it successfully).
👉 In short:
Today’s session restored bullish momentum, closing near highs with strong buying interest. A breakout above 24,740–24,760 can open the path toward 24,900, while support remains firm at 24,520.
🛡 5 Min Intraday Chart
⚔️ Gladiator Strategy Update
ATR: 204.95
IB Range: 97.5 → Medium
Market Structure: Balanced
Trade Highlights:
1) 12:20 Long Trade Triggered → SL Hit
2) 13:50 Long Trade Triggered → Target Hit (R:R - 1:2)
📌 Support & Resistance Levels
Resistance Zones:
24,740 ~ 24,760
24,805
24,855
24,900 ~ 24,920
Support Zones:
24,600 ~ 24,585
24,520
24,490 ~ 24,465
⚡ Final Thoughts:
“Markets reward patience. Strong bases create stronger rallies.”
Bulls are back in control, but 24,745+ remains the true hurdle for sustained momentum.
✏️ Disclaimer
This is just my personal viewpoint. Always consult your financial advisor before taking any action.

Nifty is trying to break the cage to fly upwards. As you can see Nifty staged a recovery today and crossed the first hurdle that is the Mother line (50 Hours EMA) and closed about it. Not the 2 important hurdles staring at it are the trend line resistance at 24740 and Father line (200 Hours EMA) at 24780.
Bulls will be comfortable after we get a closing above these 2 hurdles. Once these hurdles are crossed we will find some resistances near 24917, 25029 and finally 25148.
The support zones for Nifty currently are at 24674 (Mother line support of 50 hours EMA), 24527 and finally 24339. Bears will control the market if we get a closing below 24339.
Disclaimer: The above information is provided for educational purpose, analysis and paper trading only. Please don't treat this as a buy or sell recommendation for the stock or index. The Techno-Funda analysis is based on data that is more than 3 months old. Supports and Resistances are determined by historic past peaks and Valley in the chart. Many other indicators and patterns like EMA, RSI, MACD, Volumes, Fibonacci, parallel channel etc. use historic data which is 3 months or older cyclical points. There is no guarantee they will work in future as markets are highly volatile and swings in prices are also due to macro and micro factors based on actions taken by the company as well as region and global events. Equity investment is subject to risks. I or my clients or family members might have positions in the stocks that we mention in our educational posts. We will not be responsible for any Profit or loss that may occur due to any financial decision taken based on any data provided in this message. Do consult your investment advisor before taking any financial decisions. Stop losses should be an important part of any investment in equity.

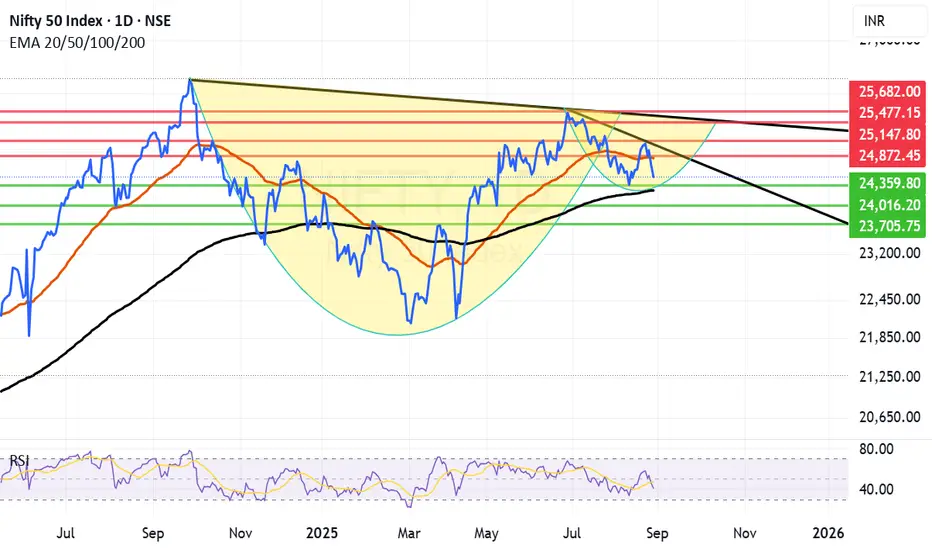
Nifty still in search of strong bottom. Nifty is still in search of a meaningful bottom to launch a fight back. Few support zones are arriving with monthly closing tomorrow Nifty was able to hold on to 24500 levels as it closed dot on that support. It is was a weak closing today indicating a firm bottom is not established yet. Thus further downside can not be ruled out.
The support zone for Nifty is between 24359 and 24266 as of now. 24266 is the Father line or 200 days EMA. If by chance we get a closing below 24359 the next support will be 24266. If 24266 is broken the next support for Nifty will be at 24016 or 23705.
The resistances for Nifty now remain at 24827 (Mother line resistance) and 24872 (Trend line resistance). Closing above 24872 will open the doors for 25147 and 25477. After closing above 25377 the major medium term resistance will be at 25682. Once we get there we will get a fair idea of levels ahead.
Long term chart of Nifty is still not that bad as it is indicating of a cup and handle breakout once we are able to close above 25682. Once we achieve that in next 1 or 2 quarters the doors for 26K and 27K will open. For that we need clarity on GST reduction proposal and Tariff related issue which is plaguing the markets. The Tariff jolt is massive but industry can overcome it in the long run by looking inwards on local consumption and exploring other overseas markets if US remains defiant in the long run.
As indicated by both US and Indian trade and commerce as well as foreign experts the issue will be eventually solved. Till then boost in local consumption / exploring other markets for India Inc. seems to be the only way out for Indian markets to recover. Long term investors should still look at investing holding on to their investments with a longer outlook. Even if there is a 0.5 or 1% reduction in GDP still India will continue to be a fastest growing market.
Years / Quarters and times like these test resolve of Investors but reward the patient handsomely. So patience is the key. Holding on and reshuffling the portfolio / Fresh investment during such phases always pays the mature investor. Always remember the Great man Warren Buffet's advice which goes like this, "Market is the device where money is transferred from the impatient to the patient."
Disclaimer: The above information is provided for educational purpose, analysis and paper trading only. Please don't treat this as a buy or sell recommendation for the stock or index. The Techno-Funda analysis is based on data that is more than 3 months old. Supports and Resistances are determined by historic past peaks and Valley in the chart. Many other indicators and patterns like EMA, RSI, MACD, Volumes, Fibonacci, parallel channel etc. use historic data which is 3 months or older cyclical points. There is no guarantee they will work in future as markets are highly volatile and swings in prices are also due to macro and micro factors based on actions taken by the company as well as region and global events. Equity investment is subject to risks. I or my clients or family members might have positions in the stocks that we mention in our educational posts. We will not be responsible for any Profit or loss that may occur due to any financial decision taken based on any data provided in this message. Do consult your investment advisor before taking any financial decisions. Stop losses should be an important part of any investment in equity.
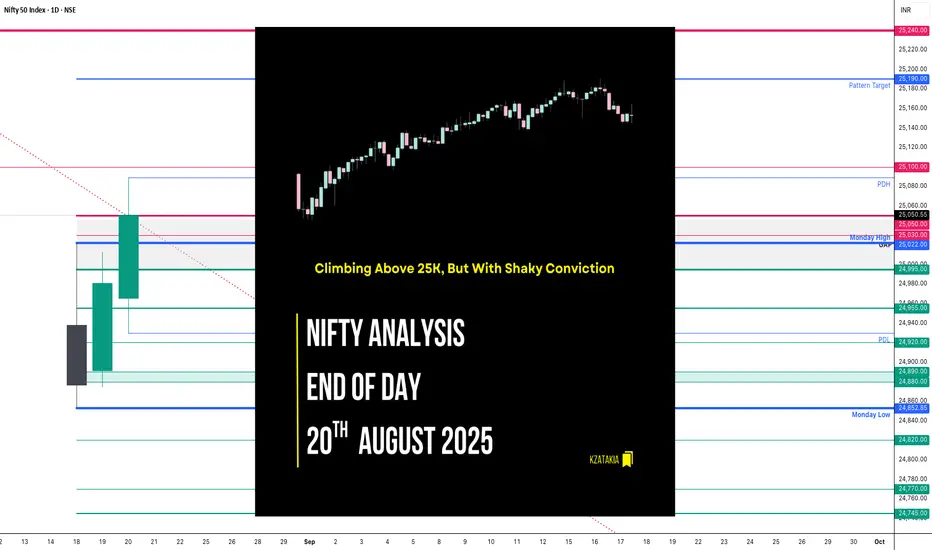
Nifty Analysis EOD – August 20, 2025 – Wednesday🟢 Nifty Analysis EOD – August 20, 2025 – Wednesday 🔴
Climbing Above 25K, But With Shaky Conviction
🗞 Nifty Summary
Nifty opened flat but slipped 50+ points in the opening minutes, sliding below the CPR zone to mark the day’s low at 24,929.70.
A sharp recovery followed — breaking the day’s high and reaching PDC (Previous Day Close) — only to get rejected and pulled back toward the CPR BC.
This 60-point rollercoaster played out within just 30 minutes, setting a volatile tone.
Later, after crossing 24,995, the index faced resistance at 25,020–25,030. Gradual progress pushed Nifty to 25,063, where it hit a trendline hurdle. Despite multiple attempts, it couldn’t hold convincingly above it, and the day ended at 25,050.55 — marginally positive (+ 70 points), but with effort showing fatigue.
👉 Intraday action tells the story: every breakout lacked conviction, with sharp throwbacks. While Nifty somehow managed to hold above 25k, Bank Nifty stayed weak, stuck near VWAP and below CPR (negative bias).
With weekly expiry tomorrow, sustainability above 24,990–25,030 and breakout PDH in the first half could trigger a short-covering rally targeting 25,190–25,240.
🛡 5 Min Intraday Chart with Levels
📊 Intraday Walk
🔻 Early dip → Below CPR, day low at 24,929.70.
🔼 Quick rebound → Tested PDC, rejection pulled back to CPR BC.
⚔️ 60-point whipsaws within first 30 mins = High volatility.
🔼 Crossed 24,995 → Resistance at 25,020–25,030 zone.
🚧 Stalled at 25,063 → Trendline resistance.
📉 Multiple failed breakouts, sharp pullbacks.
✅ Closed 25,050.55, above 25k but not convincing.
📉 Daily Time Frame Chart with Intraday Levels
🕯 Daily Candle Breakdown
Open: 24,965.80
High: 25,088.70
Low: 24,929.70
Close: 25,050.55
Change: +69.90 (+0.28%)
🏗️ Structure Breakdown
Green Candle (Close > Open).
Body: 84.75 points
Upper Wick: 38.15 points
Lower Wick: 36.10 points
Balanced wicks → Intraday tug-of-war.
📚 Interpretation
Buyers managed another close above 25,000.
Supply zone still active near 25,080–25,100 → sellers capping the rally.
Despite intraday volatility, close above open = continuation of bullish structure.
Candle suggests testing phase at 25k, not yet a clean breakout.
🕯️ Candle Type
A Spinning Top (bullish tilt) → indecision with buyers slightly ahead.
🛡 5 Min Intraday Chart
⚔️ Gladiator Strategy Update
ATR: 205.36
IB Range: 61.95 → Small
Market Structure: Balanced
Trade Highlight:
⏰ 10:10 AM → Long Trigger → Target Hit (R:R = 1:2)
🕵️ Range & Bias
Support Zone: 24,920 – 24,890
Resistance Zone: 25,090 – 25,100
Bias: Cautiously Bullish → Above 25k, but conviction lacking.
📌 Support & Resistance Levels
🎚️ Resistance Zones
25,030 – 25,050
25,100
25,190
25,240
🎚️ Support Zones
24,995
24,955
24,920
24,890 – 24,880
💡 Final Thoughts
Nifty is grinding higher, but intraday volatility and failed follow-throughs highlight lack of conviction. For expiry, the 25,100 ceiling is crucial. A sustained move above could trigger short-covering firepower, while below 24,930, the downside gap-filling risk reopens.
"Levels hold the key — conviction comes only when price sustains beyond them."
✏️ Disclaimer
This is my personal analysis — not investment advice. Please consult your financial advisor before trading.
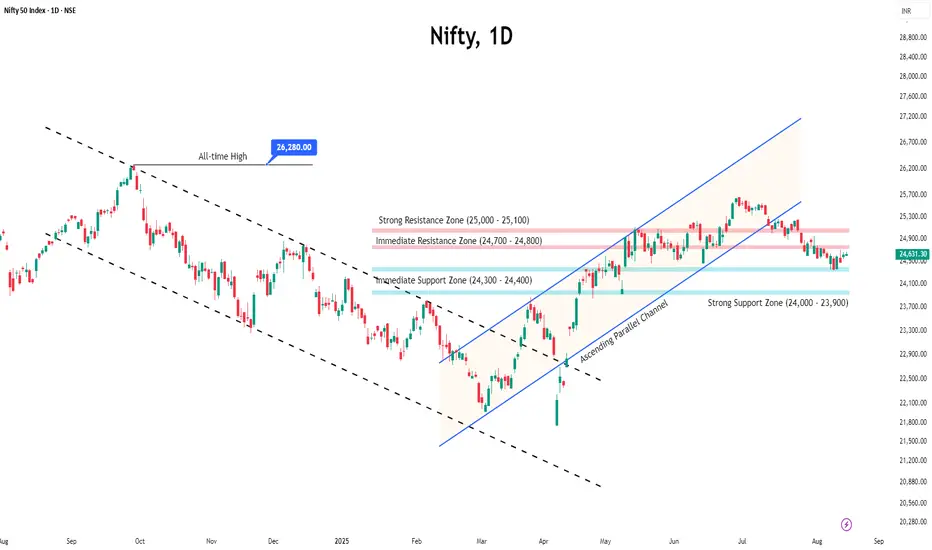
Nifty Rebounds After Six-Week Fall, Consolidation Continues● Nifty finally ended its six-week losing run, closing the week with a 1.10% gain despite trading in a narrow range.
● Volatility inched higher, with India VIX rising 2.68% to 12.35, reflecting a slightly elevated risk perception, though it remains comfortably low.
● On the technical front, the 24,300–24,400 zone is likely to act as immediate support, while resistance is seen at 24,700–24,800.
● Heading into nest expiry, the index is expected to remain in a neutral phase as it continues to consolidate below key resistance levels. Without a decisive breakout, aggressive buying should be avoided.
● Traders are advised to closely monitor price action around these key levels and manage risk carefully while planning trades.