Wild Week Ahead For Nifty on the verge of cup and handle BO.Till Thursday the situation was like 11 overs 100 to win with 8 wickets in hand. Bears pulled one tight over and took a wicket on Friday. Now If someone tells you the team chasing needs 95 runs in 10 overs with 7 wickets in hand with one well set batsmen at the crease and a 'Cricketing Goat' coming in to bat along with well set batsman. Would you like to watch this T-20 match? Obviously you we will say,"Bring it on!" Very exciting match ahead. Right! Well we have a similar match going on between bulls and bears.
Nifty is on the verge of a cup and handle Breakout. In the last throw of dice Bears tried to marinate some negativity on Friday where Nifty closed at 25327 after making a high of 25448 during the week. The correction from high was also due to few technical reasons like high RSI and overbought market zones on daily and hourly charts.
The other reason was that current round of Trade talks between US and Europe are also not yielding some concrete results and Pakistan is going all out with strategic defense deal with KSA. Such deals have more or less no 'locus standi' either in reality or on the market but certainly they 'on paper' seem to be supporting our enemy state. The new GST rates will come into effect from next week which can be a great news for some sectors at the same time some sectors can come out as on the wrong side of the stick.
What to expect? Lot of volatility and sectoral changes. Mutual Funds / HNIs / FII and other DII will try to readjust their portfolio. Such situation can throw wild swings. Intraday trading and short term positional trading will be very risky. F&O traders should be very careful with their positions. They can make or terribly break your banks. Long term retail investors should go with the flow and steer their ship with minute adjustment to their sail or make calculated adjustments if required. Avoid knee-jerk reactions in any case.
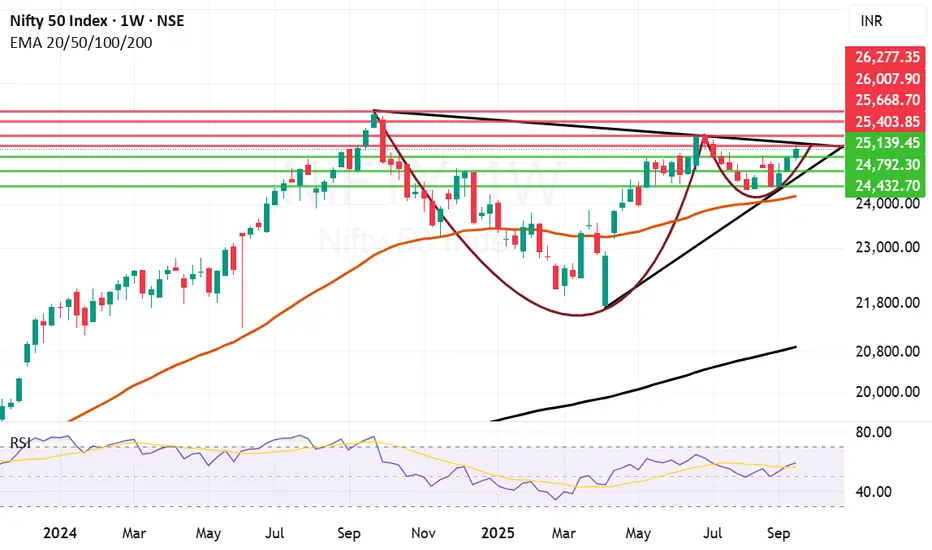
If the cup and handle Breakout happens on Nifty we can swifty reach the previous ATH (All Time High or make a New high within this quarter. If the Cup and Handle / Trend-line Break out fails Nifty will be again send back to search for supports. This week Nifty did try to get a trend line breakout but it did not succeed still the form and momentum looks good. on Friday FII and DII both were on the buying side. This means there are chances that positive momentum can continue making shadow of the candle green.
Supports for Nifty currently remain at: 25139, 24792, 24432 and finally Mother line support of 50 Weeks EMA at 24191.
Resistances for Nifty remain at: Zone between 25403 and 25668 strong resistance zone which includes major Trend line resistance and highs of the year 2025. Above this zone the next resistance can be seen in the chart at 26007 and 26277 (All Time High of Nifty).
As described in the first paragraph the game is in balance right now with possibilities of Breakout and Breakdown remaining almost equal with Bulls currently having a slight edge. Volatile month end awaits with a chance of big red or green candles to be seen in the next 2 to 3 weeks. Very interesting time ahead lets see how the cookie crumbles.
So it is like a team chasing in a T-20 needs 95 runs in 10 overs with 7 wickets in hand with Two well set batsmen at the crease. Bring it on!
If you love cricket as well as the stock market, you can read my book The Happy Candles Way to Wealth Creation. The book juxtaposes cricket and stock market in many ways. Lot of cricketing examples are given for understanding stock market behaviour. You will love it. Those who have read it love the book as it has a rating of 4.8/5 on Amazon. It is value for money hand book to learn Techno-funda Analysis. Do read it. Kindle version is available too!
Disclaimer: The above information is provided for educational purpose, analysis and paper trading only. Please don't treat this as a buy or sell recommendation for the stock or index. The Techno-Funda analysis is based on data that is more than 3 months old. Supports and Resistances are determined by historic past peaks and Valley in the chart. Many other indicators and patterns like EMA, RSI, MACD, Volumes, Fibonacci, parallel channel etc. use historic data which is 3 months or older cyclical points. There is no guarantee they will work in future as markets are highly volatile and swings in prices are also due to macro and micro factors based on actions taken by the company as well as region and global events. Equity investment is subject to risks. I or my clients or family members might have positions in the stocks that we mention in our educational posts. We will not be responsible for any Profit or loss that may occur due to any financial decision taken based on any data provided in this message. Do consult your investment advisor before taking any financial decisions. Stop losses should be an important part of any investment in equity.
Niftycupandhandleformation
Nifty still in search of strong bottom. Nifty is still in search of a meaningful bottom to launch a fight back. Few support zones are arriving with monthly closing tomorrow Nifty was able to hold on to 24500 levels as it closed dot on that support. It is was a weak closing today indicating a firm bottom is not established yet. Thus further downside can not be ruled out.
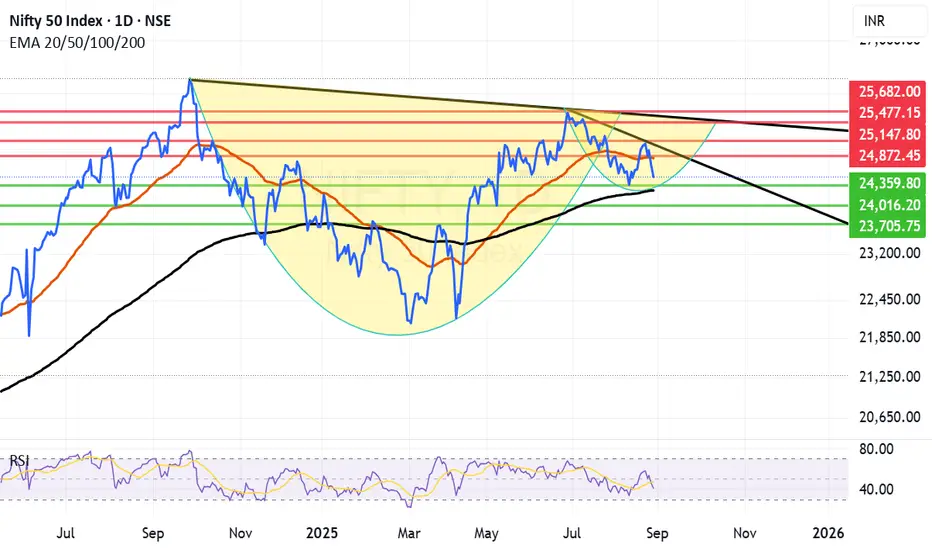
The support zone for Nifty is between 24359 and 24266 as of now. 24266 is the Father line or 200 days EMA. If by chance we get a closing below 24359 the next support will be 24266. If 24266 is broken the next support for Nifty will be at 24016 or 23705.
The resistances for Nifty now remain at 24827 (Mother line resistance) and 24872 (Trend line resistance). Closing above 24872 will open the doors for 25147 and 25477. After closing above 25377 the major medium term resistance will be at 25682. Once we get there we will get a fair idea of levels ahead.
Long term chart of Nifty is still not that bad as it is indicating of a cup and handle breakout once we are able to close above 25682. Once we achieve that in next 1 or 2 quarters the doors for 26K and 27K will open. For that we need clarity on GST reduction proposal and Tariff related issue which is plaguing the markets. The Tariff jolt is massive but industry can overcome it in the long run by looking inwards on local consumption and exploring other overseas markets if US remains defiant in the long run.
As indicated by both US and Indian trade and commerce as well as foreign experts the issue will be eventually solved. Till then boost in local consumption / exploring other markets for India Inc. seems to be the only way out for Indian markets to recover. Long term investors should still look at investing holding on to their investments with a longer outlook. Even if there is a 0.5 or 1% reduction in GDP still India will continue to be a fastest growing market.
Years / Quarters and times like these test resolve of Investors but reward the patient handsomely. So patience is the key. Holding on and reshuffling the portfolio / Fresh investment during such phases always pays the mature investor. Always remember the Great man Warren Buffet's advice which goes like this, "Market is the device where money is transferred from the impatient to the patient."
Disclaimer: The above information is provided for educational purpose, analysis and paper trading only. Please don't treat this as a buy or sell recommendation for the stock or index. The Techno-Funda analysis is based on data that is more than 3 months old. Supports and Resistances are determined by historic past peaks and Valley in the chart. Many other indicators and patterns like EMA, RSI, MACD, Volumes, Fibonacci, parallel channel etc. use historic data which is 3 months or older cyclical points. There is no guarantee they will work in future as markets are highly volatile and swings in prices are also due to macro and micro factors based on actions taken by the company as well as region and global events. Equity investment is subject to risks. I or my clients or family members might have positions in the stocks that we mention in our educational posts. We will not be responsible for any Profit or loss that may occur due to any financial decision taken based on any data provided in this message. Do consult your investment advisor before taking any financial decisions. Stop losses should be an important part of any investment in equity.
If Mother Line Support will hold, we might see a C&H formation. Although we saw a negative closing today, the chart suggests that if Mother line support will hold we might see a reversal and a Cup and Handle Formation in the near future. Cup and Handle formation is a great pattern which can help us reach the previous high and surpass it. If it happens or not only time can tell.
Supports For Nifty right now remain at: 25035, 24930 (Important Mother Line Support of Daily chart), 24759 and 24503. If 24503 is broken then there will be overall weakness in the market and we can see Nifty plummeting to 24097 (Father Line Support of Daily chart). Just below 24907 there will also be the mid channel support of 23929. (Just in case we reach there).
Resistances For Nifty Remain at: 25248, 25400, 25613 and 25915 seems to be the channel top as of now.
Nifty is delicately placed and the support of 24930 and Resistance of 25248 are the key levels to be watched. Above 25248 Bulls become strong. Below 24930 Bears become strong. Right now we are in no man's land with shadow of the candle slightly negative. If we see a bounce tomorrow or from the Mother line the shadow will has potential to turn positive later in the day tomorrow or next week.
Short term Outlook: Neutral to negative.
Medium Term Outlook: Neutral to Positive.
Long Term Outlook: Positive.
Disclaimer: The above information is provided for educational purpose, analysis and paper trading only. Please don't treat this as a buy or sell recommendation for the stock or index. The Techno-Funda analysis is based on data that is more than 3 months old. Supports and Resistances are determined by historic past peaks and Valley in the chart. Many other indicators and patterns like EMA, RSI, MACD, Volumes, Fibonacci, parallel channel etc. use historic data which is 3 months or older cyclical points. There is no guarantee they will work in future as markets are highly volatile and swings in prices are also due to macro and micro factors based on actions taken by the company as well as region and global events. Equity investment is subject to risks. I or my clients or family members might have positions in the stocks that we mention in our educational posts. We will not be responsible for any Profit or loss that may occur due to any financial decision taken based on any data provided in this message. Do consult your investment advisor before taking any financial decisions. Stop losses should be an important part of any investment in equity.
