Nifty Analysis EOD – November 26, 2025 – Wednesday🟢 Nifty Analysis EOD – November 26, 2025 – Wednesday 🔴
The “Greenest Day”: Open = Low and a One-Sided Rally Towards ATH.
🗞 Nifty Summary
Responding strongly to positive news and global market cues, the Nifty started with the formation of Open = Low (25,842.95) and launched a relentless, one-sided rally toward the 26200 level. Many traders were expecting a dip at resistance, but this slow, steady, and strong northern run kept pushing upward.
After a long period, all indices traded firmly in the green. The index closed powerfully at 26,205.30, adding a massive +320.50 points (+1.24%).
The sheer magnitude and structure of the move—a full-body bullish candle—raises the key questions: Was this heavy short covering on the first day of the new expiry, or genuine fresh institutional long positioning? The move has been stunning, and the Nifty is now right on the doorstep of the All-Time High (ATH).
🛡 5 Min Intraday Chart with Levels
🛡 Intraday Walk
The Open = Low condition immediately signaled aggressive buying and zero morning hesitation. The rally consumed all previous resistance levels from the past two days with minimal effort.
This strongly imbalanced market structure created a challenging trading day for those expecting a retracement. The steady climb, driven by strong volumes, suggests high conviction behind the move. The focus now shifts entirely to the imminent challenge of the All-Time High at 26277.
📉 Daily Time Frame Chart with Intraday Levels
🕯 Daily Candle Breakdown
Open: 25,842.95
High: 26,215.15
Low: 25,842.95
Close: 26,205.30
Change: +320.50 (+1.24%)
🏗️ Structure Breakdown
Type: Strong Bullish candle (Marubozu).
Range (High–Low): ≈ 372 points — high volatility and decisive trend strength.
Body: ≈ 362 points — reflecting powerful upside momentum with strong institutional buying.
Upper Wick: ≈ 10 points — buyers held control till the very end, minimal profit booking near the close.
Lower Wick: ≈ 0 points — the market never traded below the open (Open = Low), indicating aggressive, non-stop buying from the first minute.
📚 Interpretation
This is a textbook signal of extreme bullish conviction. The Marubozu-like structure completely engulfs several previous days’ candles, negating the recent bearish retracement and confirming the continuation of the primary trend. The focus now is on follow-through; a move of this strength often precedes an immediate challenge of the next major objective.
🕯 Candle Type
Marubozu Bullish Candle
🛡 5 Min Intraday Chart
⚔️ Gladiator Strategy Update
ATR: 210.90
IB Range: 195.5 → Big
Market Structure: ImBalanced
Trade Highlights:
09:45 Long Trade - Target Hit (R:R 1:2.94)
Trade Summary: Given the powerful one-sided nature of the move, the strategy quickly identified the bullish imbalance and captured the core directional move with a high R:R long trade, performing perfectly in a trending market.
🧱 Support & Resistance Levels
Resistance Zones:
26220 (Immediate Resistance)
26277 (All-Time High / Key Hurdle)
Support Zones:
26104 (Previous Strong Resistance, now first support)
26030
25985
25930 ~ 25920
🧠 Final Thoughts
“Frozen by the move? Now, plan for the ATH breach.”
The market has cleared all immediate resistance and is poised to challenge the All-Time High (26277). Given the strength of today’s close, the bias for Thursday is strongly bullish.
We must watch for an immediate follow-through above 26220. If the market fails to breach the ATH (26277) on the first attempt, a minor dip back to the 26104 support would be healthy before the next attempt.
✏️ Disclaimer
This is just my personal viewpoint. Always consult your financial advisor before taking any action.
Niftyprediction

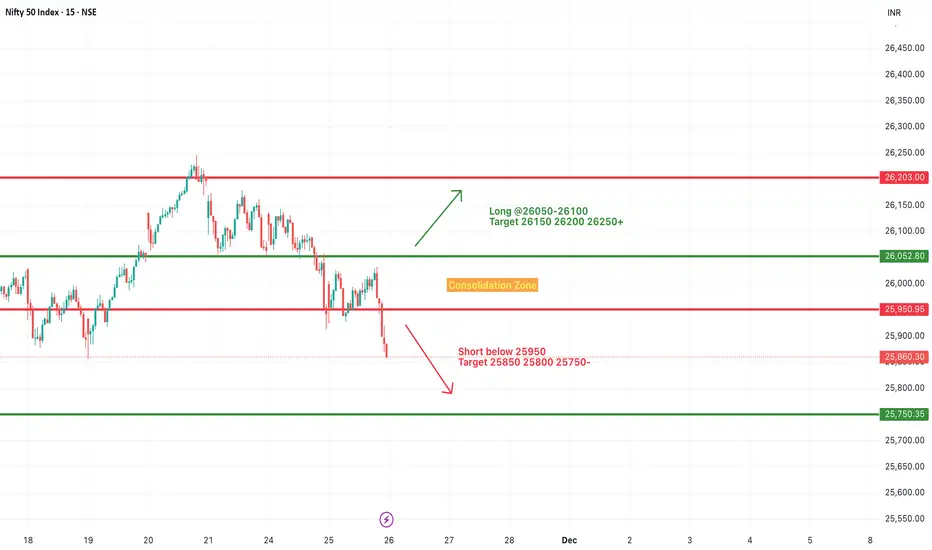
#NIFTY Intraday Support and Resistance Levels - 26/11/2025Nifty is expected to open with a gap-up today, and if the index sustains above the 26050 level, bullish momentum may continue in the early part of the session. A stable move above the 26050–26100 zone will activate the long setup with upside targets of 26150, 26200, and 26250+. If buyers remain strong, the move can further extend toward the higher resistance zone.
On the downside, weakness will be confirmed only if Nifty falls below 25950, which will trigger the short setup with downside targets of 25850, 25800, and 25750-. With a gap-up opening expected above 26050, the early trend remains positive, but sustaining above the breakout zone is essential for further upside.
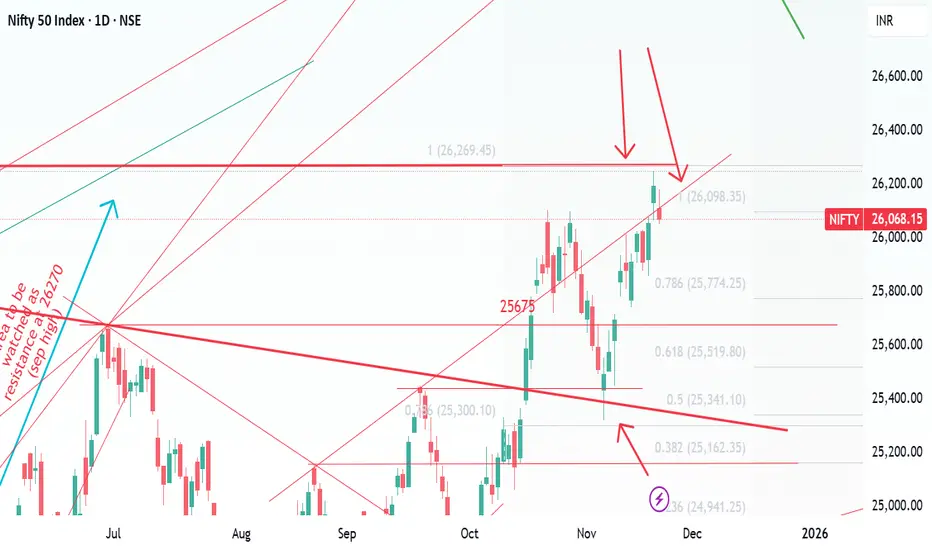
Nifty 50: Trendline Support vs All-Time Highs...Over the past two months, the Nifty 50 has been maintaining a clear bullish structure, moving in a classic UP → PULLBACK → UP sequence. On the hourly timeframe, the index has been respecting a well-defined ascending trendline, which has consistently acted as dynamic support.
Recently, Nifty took support at the confluence of the trendline and the 0.5 Fibonacci retracement level, triggering a strong upside continuation. Now, the same confluence setup is forming again, indicating that the market may be preparing for another potential bounce.
The key level to monitor is 25,750, where both the trendline and the 50% Fib level intersect. If the index holds and rebounds from this zone, the ongoing uptrend is highly likely to extend further.
However, traders should remain cautious—Nifty is approaching its all-time high region, where profit-booking and volatility typically increase. A successful bounce could lead to a short-term move toward the next resistance zone at 26,250.
In summary:
📌 Trend remains bullish unless the trendline breaks.
📌 25,750 is the critical support to watch.
📌 Upside target on continuation: 26,250.

SBI Life Insurance: Breaking 420-Day Consolidation BUY Setup 🛡️
Entry: ₹1,936-1,945 (Current Level)
Target 1: ₹1,984-1,990
Target 2: ₹2,019-2,030
Target 3: ₹2,056-2,075 (Extended)
Stop Loss: ₹1,910
Technical Rationale:
MAJOR BREAKOUT after 420 days of consolidation (highlighted in cyan)
Breaking above long-term resistance at 1,930 level with strong momentum
Weekly chart showing powerful +5.27% surge
Volume buildup visible (highlighted) - institutional accumulation
Price breaking above descending trendline from 2024 highs
Trading above both EMAs indicating strong bullish trend
Rounding bottom formation on weekly - classic bullish reversal
High volume (5.03M) confirming breakout authenticity
RSI trending upward with room for further upside
Insurance sector showing relative strength
Clear support base at 1,876-1,910 zone
Risk-Reward: Excellent 1:4+ ratio
Pattern: Multi-month base breakout + Rounding bottom - extremely reliable bullish setup on weekly timeframe
Strategy: Positional/long-term - Book 25% at T1 (1,990), 25% at T2 (2,025), trail remaining 50% with SL at 1,950 after T1 achieved
Key Levels:
Breakout Zone: 1,930-1,945 (critical resistance broken)
Strong Resistance: 1,984, 2,019, 2,056
Major Support: 1,910, 1,876
Major Catalyst:
420-day consolidation breakout = huge pent-up energy
Volume accumulation phase complete
Financial sector strength
Disclaimer: For educational purposes only. Not SEBI registered. 420-day base breakout is significant - these typically lead to sustained moves. Weekly chart for medium to long-term position. Manage risk appropriately and conduct thorough research before investing.

Nifty50 hit the temporary resistance at the channel Nifty50 hit the temporary resistance at the channel, more pause for the upside

Nifty Short & Medium Term Support&Resistance_24-Nov to 28-Nov-25Nifty Short & Medium Term Support&Resistance_24-Nov-25 to 25-Nov-25
Nifty 26068
Long call ( Buy) was given five weeks before at 24896, Nifty crossed near to 1000 points.
Long buy Call was reiterated two weeks before after a dip, with buy on dip for medium to long term perspective.
Quarterly results of companies are being released and so far it have mixed - Postive results.
Margins and revenue growth are major concern, Net profit being achieved by savings on employee cost and other savings. To be more cautious on picking the right stock and rebalance the portfolio.
Overall, Tariffs deal will decide the future path till Dec - Jan for the Nifty. Since it is a Volatile situation SIP route or buy in multiple parcel route with a goal of 3-5 years will workout. US Trade deal, 1st Feb budget and reforms if any will decide Nifty's path.
Some of the stocks to watchout given last week are Warree Energies, HDFC AMC, NMDC, Apar, Sharda Crop, VRL Logistics, krishna Phos chem, Cipla, Dr Reddy, Natco ( Buy on Dip as still there is negative trend), Apl Apollo Tubes, Muthoot Finance ( On Dips) , tata Steel ( Contra Stock due to Business Cycle), Bank of Mah, BPCL, CG Power, hero motor, shriram finance. Shared for Analysis purpose only. Dr Reddy, shriram fin, natco pharma, Hero moto corp,Muthoot Finance have already given more than 10% return in this 1 month.
The strategy continued to be long and use the opportunity to buy on dips similar to SIP.
Current Short Term Resistance 26270 ( all time high). It need to break the resistance 26270 decisively to move up to 27000 target in med-long term. As RSI is up more than 80% for more than two weeks, room to go higher will be less in short term.
Nifty Short Term Supports ( Multiple Supports are there between 25000-25500):
26000
25670 (Jun 2025 High)
25360-25420 ( Sep high and trendline support as shown in chart)
25300-25350 (Two Fibonacci resistance shown ) - Major Support
Hence 25300- 25420 acts as major short term support.
25500 ( 25441 Sep 18th 2025 High )
25450 ( 25442 is the Aug 2025 high)
25200 ( 25154 Aug 2025 high)
25000 ( Milestone)
Short Term Resistance
1.26098 ( Recent two week high)
2.26269 ( All time High)
Medium Term Support:
1.24700 (Trend Line as shown)
2. 24000-24170 (Fibonacci Retracements Supports- Two Supports in this zone 24116 & 24171 as shown)
3. 23500-23700 (Fibonacci Retracements Supports- Two Supports in this zone 23608 & 23707 as shown)
2. 23000
Medium Term Resistance:
1.27000 ( Need to decisively break 26269 all time high) This resistance is based on Fibonacci resistance at 27034
Long term resistance:
1.28000 ( Need to decisively break and move up 27000)This resistance is based on Fibonacci resistance at 28106
Long Term Support
1.22700-23000 ( Trend line and Mar 2024 High)
2.Big support at 20000 (Sep 2023 high)
Nifty Analysis EOD – November 21, 2025 – Friday🟢 Nifty Analysis EOD – November 21, 2025 – Friday 🔴
Bulls Fail to Sustain Rally; Panic from Global Markets
🗞 Nifty Summary
nfluenced by negative global news, the Nifty started with a 71-point Gap Down and quickly lost another 30 points. The 26100 psychological support came to the rescue initially, triggering an 80-point bounce from the day’s low. However, the crucial swing resistance at 26170 acted as a firm ceiling, pushing the index back down sharply by 118 points. This move set the temporary day low at 26,055.95.
After a period of tight consolidation (15-18 points range), a second rally attempted to breach 26170, but this upward move fizzled out due to renewed selling pressure. The Nifty closed near the day’s low at 26,068.15, resulting in a loss of -124.00 points (-0.47%). The panic was clearly driven by global clues.
Despite the drop, the close and low are near the previous day’s low and the November 19th high, suggesting the long-term bullish structure remains technically intact.
Action planning must await Monday’s session closing.
🛡 5 Min Intraday Chart with Levels
🛡 Intraday Walk
The session was highly volatile, characterized by sharp 80-point swings, almost entirely contained within the Initial Balance (IB) Range. The initial fake-down below the IB Low served as a bear trap, leading to the morning bounce.
However, the consistent rejection at the 26170 level was the defining feature of the day. Every attempt by bulls to reclaim higher ground was met with aggressive selling, culminating in a close almost at the low of the day. This type of price action offers good opportunities for intraday traders but highlights structural uncertainty for the swing bias.
📉 Daily Time Frame Chart with Intraday Levels
🕯 Daily Candle Breakdown
Open: 26,109.55
High: 26,179.20
Low: 26,052.20
Close: 26,068.15
Change: −124.00 (−0.47%)
🏗️ Structure Breakdown
Type: Bearish candle with a strong upper wick.
Range (High–Low): ≈ 127 points — moderate intraday volatility.
Body: ≈ 41 points — controlled but clear downside pressure.
Upper Wick: ≈ 69 points — strong selling pressure and rejection at the higher levels (26170 zone).
Lower Wick: ≈ 16 points — mild buying from the day’s lows but ultimately insufficient to shift the closing momentum.
📚 Interpretation
The strong upper wick is the most important structural element, indicating that sellers aggressively entered the market every time the index attempted to rise. The close near the low confirms that the sellers maintained control throughout the session, despite the initial bounce from the 26100 support. This candle is a clear sign that overhead supply is active near the recent highs.
🕯 Candle Type
Bearish Candle with Strong Upper-Wick Rejection — A clear signal that resistance is active and the upward momentum has paused.
🛡 5 Min Intraday Chart
⚔️ Gladiator Strategy Update
ATR: 191
IB Range: 80.55 → Medium
Market Structure: Balanced
Trade Highlights:
10:56 Long Trade - Target Hit (R:R 1:2.89)
Trade Summary: The strategy successfully captured the morning counter-trend bounce, demonstrating adaptability to the initial range-bound fakeout. The volatility offered limited opportunities, but the core profitable trade capitalised on the immediate reaction at the 26100 support.
🧱 Support & Resistance Levels
Resistance Zones:
26104
26135
26180 (Crucial Rejection Level)
26220 ~ 26245
26277 (ATH)
Support Zones:
26075 ~ 26040 (Current Holding Zone)
26000 (Psychological Support)
25950 ~ 25940
🧠 Final Thoughts
“The bulls must defend the lower ground to maintain the structure.”
The close near the lows means the market is vulnerable to further downside, but the crucial structural support lies in the 26040 ~ 26000 zone. The bullish structure is intact only if Nifty successfully holds this band.
A decisive breach above 26180 is required to signal renewed confidence toward the ATH.
Until then, stay cautious and respect the volatility.
✏️ Disclaimer
This is just my personal viewpoint. Always consult your financial advisor before taking any action.

Nifty Intraday Levels : 24-Nov-25Nifty closed near the support level of trendline and Support Zone sustain above the zone upside move and if break will expect downfall
Bearish < 26020
Bullish > 26130
Wait for Proper Rejection/Pattern :
Support : Bullish
Resistance : Bearish
Use Sl Trailing to reduce Risk
*All views for educational purpose only

Based on our fundamental analysis of Monolithisch India Ltd.Recommendation: NEUTRAL / HOLD
Rationale:
The company's fundamentals are strong—demonstrating phenomenal growth, high profitability, and a lean balance sheet. However, the current stock price has already discounted a significant amount of this future growth. The valuation is very rich (P/E of ≈71.9x), which leaves little room for error or unexpected slowdowns.
For an existing investor, holding the stock is reasonable to capture the expected growth. For a new investor, we recommend a Neutral stance, suggesting it is best to wait for a better entry point (a pullback in price) that offers a more favorable risk-to-reward balance.
Price Target and Duration
Since the market is currently rewarding the exceptional growth with a high multiple, we anchor our near-term target to a slight premium on the current valuation based on sustained financial performance.
Target Price: ₹550
Target Duration: 12-15 Months (This is a long-term view that factors in the execution of the company's current expansion plans).

Nifty Analysis EOD – November 20, 2025 – Thursday🟢 Nifty Analysis EOD – November 20, 2025 – Thursday 🔴
Bullish Extension Continues, Nifty Just 29 Points Away from All-Time High!
🗞 Nifty Summary
The Nifty opened with an 83-point Gap Up, confidently trading above the Previous Day’s High (PDH). The initial few minutes saw the gap fill, finding solid support exactly at the PDH level.
The index then consolidated for about 90 minutes near the CDH + IBH, forming a narrow 20-25 point range. Following this pause, Nifty resumed its upward march with steady “baby steps,” successfully breaching the crucial 26220 resistance level and marking the day’s high at 26,246.65. Although unable to sustain above 26220, leading to a sharp, volatile slip back, the index closed strongly at 26,192.15, adding +139.50 points (+0.54%) from the previous day’s close.
This was a clear bullish extension day, achieving the targets aimed for yesterday, though the lack of participation from small-cap and mid-cap segments remains a point of caution. We are now merely 29 points away from marking a new All-Time High (ATH).
🛡 5 Min Intraday Chart with Levels
🛡 Intraday Walk
The session was defined by an initial deep gap-up, followed by the gap-fill and strong defense of the PDH, confirming the bullish bias.
The mid-session consolidation was a low-volume affair, acting as a spring for the second leg of the upward rally.
The move through 26220 was aggressive, but the quick rejection from the high indicated strong supply at the historical peak levels.
The final closing level, however, remains robust, signaling that overall control is with the buyers, and the primary objective is the ATH.
📉 Daily Time Frame Chart with Intraday Levels
🕯 Daily Candle Breakdown
Open: 26,132.10
High: 26,246.65
Low: 26,063.20
Close: 26,192.15
Change: +139.50 (+0.54%)
🏗️ Structure Breakdown
Type: Bullish candle.
Range (High–Low): ≈ 183 points — healthy, broad intraday movement.
Body: ≈ 60 points — showing controlled but steady bullish strength.
Upper Wick: ≈ 54 points — indicating profit-booking or resistance near the 26220 high.
Lower Wick: ≈ 69 points — strong buying from lower levels, confirming demand on dips.
📚 Interpretation
The strong opening and consistent follow-through buying throughout the day confirm the prevailing bullish trend. Although the upper wick is substantial, reflecting the failure to sustain the breakout above 26220, the close is well above the open and previous major resistance levels. This indicates that while bears defended the immediate high, they were unable to shift the overall market structure.
🕯 Candle Type
Bullish Candle with Both-Side Wicks (Buyers Dominant) — This is a strong continuation signal, confirming the control of the bulls despite minor overhead resistance.
🛡 5 Min Intraday Chart
⚔️ Gladiator Strategy Update
ATR: 196.67
IB Range: 72.8 → Medium
Market Structure: ImBalanced
Trade Highlights:
10:05 Long Trade - Target Hit (R:R 1:3.13)
12:24 Long Trade - Target Hit (R:R 1:3.96)
Trade Summary: The strategy performed exceptionally well today, capitalising on the clear directional moves after the initial range-bound phase. The two high R:R long trades captured the core bullish extension of the day.
🧱 Support & Resistance Levels
Resistance Zones:
26220 (Immediate Resistance)
26277 (All-Time High)
Support Zones:
26135 (Gap Fill Zone)
26104 ~ 26075 (Critical Intraday Support)
26063 ~ 26040
26000 (Psychological Support)
25950 ~ 25940
🧠 Final Thoughts
“The final frontier is 26,277.”
The market is in clear bullish territory, with all major resistance levels below 26220 successfully converted into support. The primary focus for the next session is the All-Time High at 26,277.
A decisive breach and close above this level will trigger strong momentum. If the market fails to breach the ATH, we may see a slight correction toward the 26135 support zone before the next attempt.
Traders must remain mindful that non-participation from the broader market (mid/small-caps) could eventually lead to market breadth deterioration.
✏️ Disclaimer
This is just my personal viewpoint. Always consult your financial advisor before taking any action.

NIFTY Short SetupNIFTY is likely in distribution phase
Structure is getting weak, so we may see some selling in Large caps by end of November or by end of December.
Overall setup is valid only if the recent high is protected!
Have a profitable day and succesful trades!

Hero Motocorp: Major Weekly Breakout | Auto Sector Leader
STRONG BUY Setup 🏍️
Entry: ₹5,798-5,820 (Current Level)
Target 1: ₹5,899-5,920
Target 2: ₹6,033-6,060
Target 3: ₹6,251-6,280
Target 4: ₹6,400-6,500+ (Extended Breakout Target)
Stop Loss: ₹5,588
Technical Rationale:
BREAKING OUT from year-long rectangle consolidation (5,588-5,899 range - blue shaded area)
Powerful +4.69% weekly surge showing strong bullish momentum
Testing upper boundary of rectangle at 5,899 (marked "3d 21h" - breakout imminent)
Weekly chart showing major pattern completion
Trading above descending channel (black trendlines) - channel broken
Volume at 1.77M - strong for weekly timeframe confirming breakout
RSI trending upward around 70-75 - strong momentum (overbought but in uptrend)
Trading well above rising EMA - bullish trend confirmed
Auto sector leader - largest two-wheeler manufacturer globally
Multiple resistance levels clearly marked: 5,899, 6,033, 6,251
Strong support established at 5,588 (rectangle base)
Previous consolidation for 12+ months = powerful breakout potential
Pattern similar to 2024 rally from 3,500 to 6,000+
Risk-Reward: Excellent 1:3 to 1:5+ ratio depending on targets
Pattern: RECTANGLE CONSOLIDATION BREAKOUT on WEEKLY Chart - extremely powerful continuation pattern after year-long base building
Strategy: Medium to long-term positional (weeks to months)
Book 20% at T1 (5,910), 20% at T2 (6,045), 20% at T3 (6,260)
Hold remaining 40% for extended target 6,400-6,500+
Trail SL to 5,820 after crossing T1
Disclaimer: For educational purposes only. Not SEBI registered.

Axis Bank: Falling Wedge Pattern | Wait for Breakout Above 1,26Entry: ₹1,241-1,250 (Current Level)
Target 1: ₹1,259-1,265
Target 2: ₹1,275-1,285 (Breakout Confirmation)
Target 3: ₹1,300-1,320+ (Extended if breaks channel)
Stop Loss: ₹1,222
Disclaimer: For educational purposes only. Not SEBI registered.

HCLTECH: Year-Long Trendline Breaking | IT Services Rally StartsSTRONG BUY Setup 💻
Entry: ₹1,662-1,675 (Current Level)
Target 1: ₹1,703-1,720
Target 2: ₹1,764-1,780
Target 3: ₹1,820-1,850
Target 4: ₹1,900-1,950+ (Extended - Trendline Breakout Target)
Stop Loss: ₹1,591Technical Rationale:
BREAKING ABOVE year-long descending trendline (marked "Trendline" in blue on chart)
Explosive +4.23% surge with exceptional volume spike (6.34M - highlighted as "Volume Spurt")
Daily chart showing decisive breakout from long-term resistance
Trading well above rising EMA (blue curve) - strong bullish reversal
Volume is highest in months (marked with blue arrow) - institutional buying confirmed
RSI trending strongly upward around 70-75 - powerful momentum
IT Services sector leader - one of India's top IT companies
Multiple resistance levels clearly mapped: 1,703, 1,764
Strong support established at breakout zone 1,591-1,600
Previous consolidation near 1,500-1,600 now acting as strong base
Pattern shows consistent recovery from October 2025 lows
Breaking above the descending channel that dominated 2025
Risk-Reward: Excellent 1:3 to 1:5+ ratio depending on targetsPattern: DESCENDING TRENDLINE BREAKOUT on DAILY Chart with massive volume confirmation - highly reliable bullish reversal setupStrategy: Short to medium-term swing/positional (weeks to months)
Book 20% at T1 (1,715), 20% at T2 (1,772), 20% at T3 (1,835)
Hold remaining 40% for extended target 1,900-1,950+
Trail SL to 1,675 after crossing T1
Disclaimer: For educational purposes only. Not SEBI registered.

GRM Overseas: Breaking 480 After 2 Years | Agri-Export LeaderSTRONG BUY Setup 🌾Entry: ₹494-500 (Current Level)
Target 1: ₹509-515
Target 2: ₹519-525
Target 3: ₹528-540
Target 4: ₹560-580+ (Extended Breakout Target)
Stop Loss: ₹480Technical Rationale:
EXPLOSIVE BREAKOUT from multi-year resistance at 480 (blue horizontal line at top)
Massive +2.83% surge on weekly chart with strong momentum
Breaking above 2-year consolidation/resistance zone (highlighted "1d 19h" in green)
Volume at 3.23M - strong for weekly timeframe confirming breakout
Weekly chart showing major pattern completion
Trading well above rising EMA (blue curve) - strong bullish trend
RSI trending upward around 70-75 - strong momentum
Basmati rice exporter - agri-commodity play with export potential
Multiple resistance levels clearly marked: 509, 519, 528
Clear support established at breakout zone 480
Strong recovery from 2023-2024 lows (~160) to current levels
Pattern shows consistent higher highs and higher lows since mid-2024
Breaking into new all-time high territory
Risk-Reward: Excellent 1:4 to 1:6+ ratio for extended targetsPattern: MULTI-YEAR HORIZONTAL RESISTANCE BREAKOUT on WEEKLY Chart - extremely powerful setup after 2+ years of consolidationStrategy: Medium to long-term positional/investment (weeks to months)
Book 20% at T1 (512), 20% at T2 (522), 20% at T3 (534)
Hold remaining 40% for extended target 560-580+
Trail SL to 500 after crossing T1
Disclaimer: For educational purposes only. Not SEBI registered.

Nifty closed above 26,000 mark What next ?Hello Friends,
Today market was bullish and closed above 26,000 mark and what am I expecting from the Market Lets talk
Thank you

NIFTY 50 Bullish Scenario: Weekly ChartNIFTY 50 Bullish Scenario: Weekly Chart
* Expected next couple of weeks Bullish and upside target is 26277.
* We might get a retracement day when we hit previous short term high (27107.10) which will be a good opportunity to add longs for
*Area market with green rectangle is SR flip/Support , price recently showed are strong upside reaction from this are.

NiftyBreakout retest looking strong — If price holding above 26,020-26100 zone.
If momentum sustains, next targets on radar: 26,836 → 26,926 🚀
Trendline resistance flipped to support. Bulls still in control.

Nifty Short & Medium Term Support&Resistance_10-Nov-25 to 14-NovNifty Short & Medium Term Support&Resistance_10-Nov-25 to 14-Nov
Nifty 25910
Long call ( Buy) was given four weeks before at 24896, Nifty crossed near to 1000 points.
Long buy Call was reiterated two weeks before after a dip, with buy on dip for medium to long term perspective.
Quarterly results of companies are being released and so far it have mixed results.
As the margins and revenue growth are major concern, to be more cautious on picking the right stock and rebalance the portfolio.
Overall, the Qtrly Results and Tariffs deal will decide the future path till Dec - Jan for the Nifty. Since it is a Volatile situation SIP route or buy in multiple parcel route with a goal of 3-5 years will workout. US Trade deal, 1st Feb budget and reforms if any will decide Nifty's path.
Some of the stocks to watchout given last week are Warree Energies, HDFC AMC, NMDC, Apar, Sharda Crop, VRL Logistics, krishna Phos chem, Cipla, Dr Reddy, Natco ( Buy on Dip as still there is negative trend), Apl Apollo Tubes, Muthoot Finance ( On Dips) , tata Steel ( Contra Stock due to Business Cycle), Bank of Mah, BPCL, CG Power, hero motor, shriram finance. Shared for Analysis purpose only. Dr Reddy and Muthoot Finance have already given near to 10% return.
Hence the strategy can be shifted to long considering medium to long and use the opportunity to buy on dips similar to SIP.
Current Short Term Resistance are 26000 and 26270 ( all time high). It need to break the resistance 26270 decisively to move up to 27000 target in med-long term.
Nifty Short Term Supports ( Multiple Supports are there between 25000-25500):
25670 (Jun 2025 High)
25360-25420 ( Sep high and trendline support as shown in chart)
25300-25350 (Two Fibonacci resistance shown ) - Major Support
Hence 25300- 25420 acts as major short term support.
25500 ( 25441 Sep 18th 2025 High )
25450 ( 25442 is the Aug 2025 high)
25200 ( 25154 Aug 2025 high)
25000 ( Milestone)
Short Term Resistance
1.26098 ( Recent two week high)
2.26269 ( All time High)
Medium Term Support:
1.24700 (Trend Line as shown)
2. 24000-24170 (Fibonacci Retracements Supports- Two Supports in this zone 24116 & 24171 as shown)
3. 23500-23700 (Fibonacci Retracements Supports- Two Supports in this zone 23608 & 23707 as shown)
2. 23000
Medium Term Resistance:
1.27000 ( Need to decisively break 26269 all time high) This resistance is based on Fibonacci resistance at 27034
Long term resistance:
1.28000 ( Need to decisively break and move up 27000)This resistance is based on Fibonacci resistance at 28106
Long Term Support
1.22700-23000 ( Trend line and Mar 2024 High)
2.Big support at 20000 (Sep 2023 high)

Nifty spot hourly trend analysis for the next week - Nov 17-21As per my Time, Price and Pattern analysis, I expect the Nifty Spot to drop down in the
next week. The likely resistance levels are at 25988 and 26062 whereas the support
levels likely to be at 25534 and 25480.
My Technical Views may differ from the real-time market response due to various external factors. Traders are suggested to conduct own technical analysis while trading this instrument with proper risk management.

Nifty50 AnalysisHere is a analysis of NIFTY50 indices . Its currently in a make or break level . Its the best support level at current time. We can expect this ti move higher from the market support level and a possible new ATH soon. But if this support break the indices can plunge and give sharp fall easily to the lower marked levels.

Nifty Spot for 10-14 Nov 2025Nifty Spot on last friday pulled back from a breakout retest near 25300
Global cues are mixed today morning
But for the whole week 25617.95 on Nifty spot will be a make or break level.
though the trend is sell on rise
NS can find its first hurdle near 25885
Concentrate on
25600 CE & 25600 PE - likely to be most liquid strike prices for this week
Will share above options analysisin following charts.
Like & Share so many can benefit.

Buy Cholamandalam Investment & Finance above 1707Buy above 1707.
Stop-loss: 1640.
Targets: 1745 / 1791.
