Nifty Analysis EOD – November 11, 2025 – Tuesday 🟢 Nifty Analysis EOD – November 11, 2025 – Tuesday 🔴
Bulls Launch a Massive 250-Point Recovery, Trapping Bears on Expiry Day!
🗞 Nifty Summary
The session delivered an amazing recovery by the bulls, creating classic bear traps on this expiry day. The market’s ability to recover 250 points non-stop from the lows and close strongly at 25705.55, near the day’s high, confirms the return of powerful bullish conviction.
Crucially, we achieved the close above 25650 that was anticipated in yesterday’s commentary. The long lower wick structure confirms demand is aggressive at dips. We now anticipate a further extension of the continuation move in the next session.
🛡 Intraday Walk
Nifty opened with a 45-point Gap Up, landing exactly at the immediate resistance zone of 25615 ~ 25635. Following the first tick, the index slipped sharply by around 150 points, breaching the PDL before the Initial Balance (IB) could even form. This initial sell-off flipped sentiment bearish for a short period.
The aggressive slide was halted precisely at our important support zone of 25440 ~ 25460, where strong demand emerged. From this support, the index executed a non-stop, powerful recovery of 250 points, systematically breaching the PDC, CDH, the 25615 ~ 25635 resistance, and the PDH.
This sustained upward move carried the index to the next key resistance level of 25715. The day ultimately closed at 25705.55, just shy of the day’s high, confirming a highly bullish structural close.
🛡 5 Min Intraday Chart with Levels
📉 Daily Time Frame Chart with Intraday Levels
🕯 Daily Candle Breakdown
Open: 25,617.00
High: 25,715.80
Low: 25,449.25
Close: 25,694.95
Change: +120.60 (+0.47%)
🏗️ Structure Breakdown
Type: Bullish candle with a long lower wick.
Range (High–Low): ≈ 266.55 points — a wide and active trading range, indicative of high intraday volatility.
Body: ≈ 77.95 points — moderate body size.
Lower Wick: ≈ 167.75 points — a strong sign of aggressive buying and demand resurgence from lower levels.
Upper Wick: ≈ 20.85 points — limited resistance near the high, enabling a strong close.
📚 Interpretation
Price opened near mid-range, dipped sharply toward 25,449, but buyers stepped in aggressively, rejecting the lower prices and lifting the index almost to the day’s high. The long lower shadow confirms high demand and the rejection of the deep intraday sell-off. Closing near the upper end solidifies bullish momentum and significantly improved sentiment.
🕯 Candle Type
This session formed a Bullish Pin Bar (Hammer-like candle) in an up-move. This candlestick suggests renewed buying strength and strong follow-through after the previous session’s bullish commitment.
🛡 5 Min Intraday Chart
⚔️ Gladiator Strategy Update
ATR: 206.65
IB Range: 150.95 → Medium
Market Structure: ImBalanced
Trade Highlights:
10:09 Long Trade – SL Hit
10:15 Short Trade - Target Achieved (R:R 1:1.64)
12:21 Long Trade - Target Achieved (R:R 1:3.36)
Trade Summary: The early volatility led to an immediate Stop Loss, but the strategy quickly recovered with a profitable short trade and then successfully capitalized on the strong, sustained bullish reversal later in the day.
🧱 Support & Resistance Levels
Resistance Zones:
25790
25865 ~ 25880
25920
Support Zones:
25635 ~ 25615
25585
25550
🧠 Final Thoughts
“On expiry, the longest wicks are often the graves of aggressive shorts and the foundations for the next rally.”
Today’s action teaches a crucial lesson: do not trade the emotion of the gap. The sharp initial dip was a perfect bear trap on expiry. The non-stop 250-point recovery emphasizes the importance of waiting for price to stabilize near structural support (like 25440) before committing. For motivation, the recovery from an early SL shows that discipline and sticking to the trend reversal signals pay off with high-R:R opportunities.
✏️ Disclaimer
This is just my personal viewpoint. Always consult your financial advisor before taking any action.
Niftytradesetup

Nifty Spot for 10-14 Nov 2025Nifty Spot on last friday pulled back from a breakout retest near 25300
Global cues are mixed today morning
But for the whole week 25617.95 on Nifty spot will be a make or break level.
though the trend is sell on rise
NS can find its first hurdle near 25885
Concentrate on
25600 CE & 25600 PE - likely to be most liquid strike prices for this week
Will share above options analysisin following charts.
Like & Share so many can benefit.


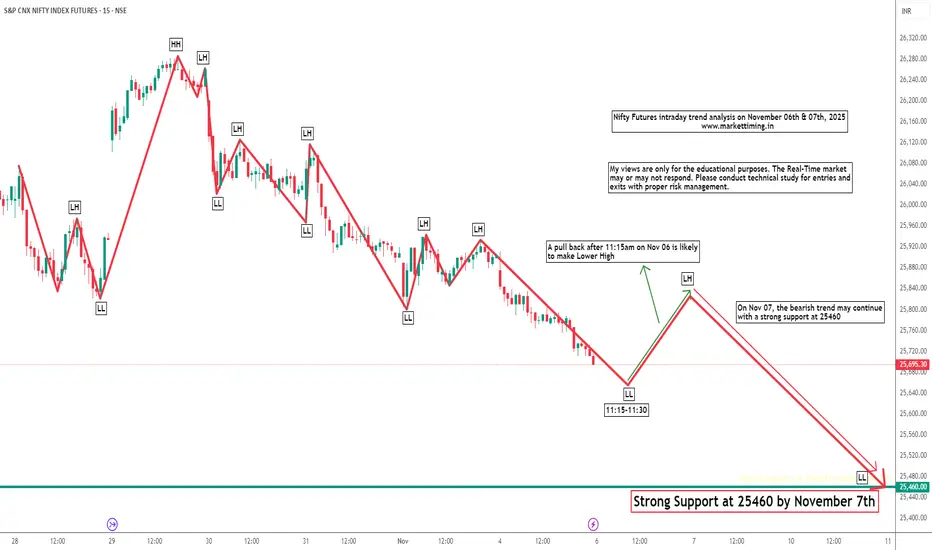
Nifty Futures Intraday Trend Analysis for November 6th and 7thBased on my pattern analysis, I anticipate the bearish momentum to persist until November 7th, potentially testing the support level around 25,460. However, on November 6th, a pullback after 11:15 AM is possible, which could result in a lower high formation.
Please note that this is my personal market outlook, and actual price action may vary due to potential gaps on either side. Traders are advised to perform their own technical analysis for entries and exits, while maintaining proper risk management practices.
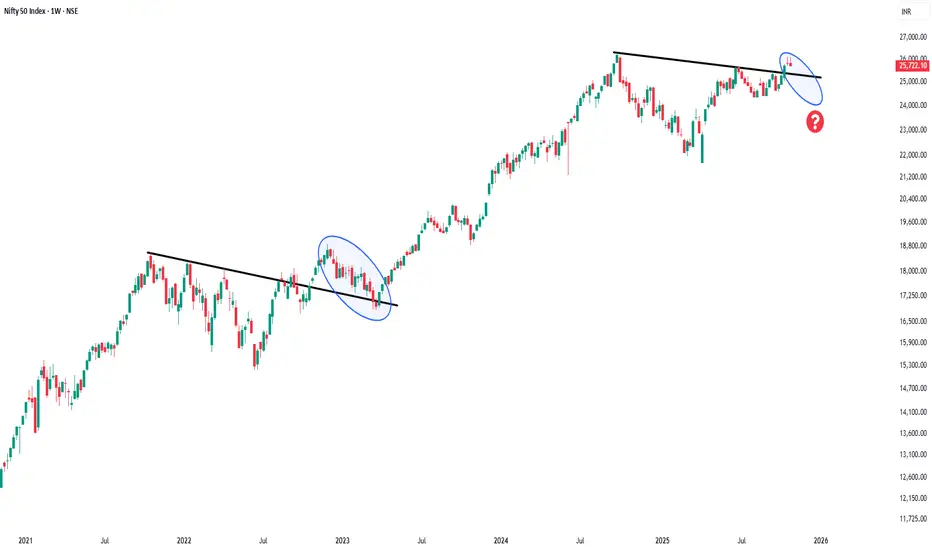
Will history repeat this time ?Previously nifty after breakout retest its support . Will history repeatthis time ?
NIFTY | Twin Bullish Patterns Signaling Market ConfidenceNIFTY | Dual Bullish Pattern on 15-Minute Timeframe
This is the 15-minute timeframe chart of NIFTY.
NIFTY is currently forming two bullish patterns — a triangle pattern and a falling flag pattern.
If the triangle pattern support breaks, the next strong support lies near the ₹25,550–₹25,600 zone, aligned with the lower boundary of the falling flag.
As long as this support zone holds, NIFTY is likely to resume its upward momentum, potentially heading toward a new high in the ₹26,250–₹26,300 range.
Thank You !!

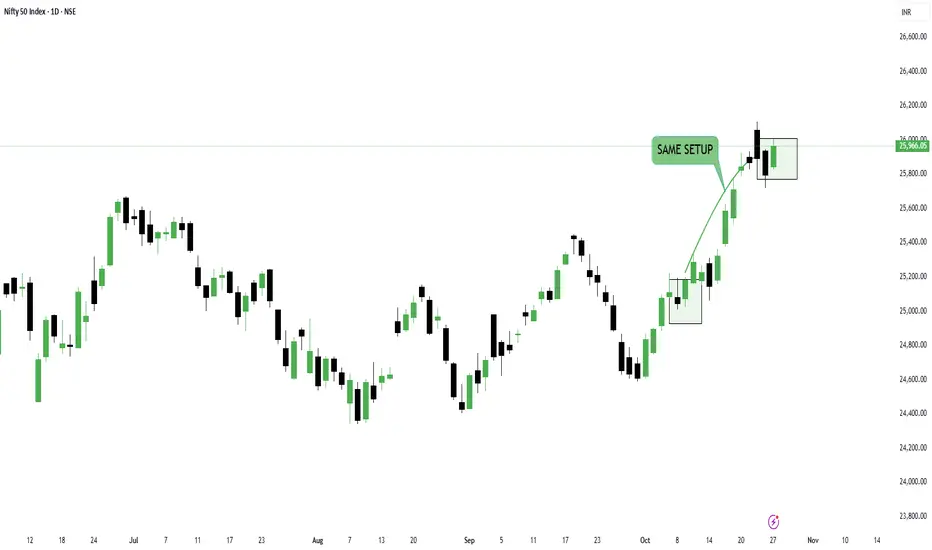
Buyers dominating Nifty ready to break all time high?Friday’s candle was a shakeout, and today that shakeout got completely absorbed.
This is the same combination we caught on October 8-9.
But note this — the recent five candles have continuously been signaling profit-booking levels, meaning the index could give a dip anytime.
Also, the October 9 candle had a clear pivot low, which today’s candle doesn’t have — that’s worth noticing.
However, the short-term undertone still remains bullish. Institutions are buying every dip, and that’s why we aren’t seeing any sharp pullback.
Today, buyers’ volume in #Nifty was higher by nearly 50 million compared to sellers, which should reflect tomorrow.
The PP is tight, which means the upcoming move will be sharp.
Which direction? That will depend on which level breaks first.
For tomorrow, resistance will be 26135 and support will be 25900.
Now, if we talk about market breadth — the ratio stands at 1.08, which clearly shows that buildup has started in the broader market.
That means the stocks in your portfolio should start moving now.
If they’re still not performing, it’s time to replace the inactive ones.
Dump the laggards and ride the trend.
On the sectoral front, the strongest momentum is visible in Auto Parts and Finance.
Overall, the market looks positive for tomorrow, but risk management remains equally important.
---
Levels at a glance:📊
Pivot: Tight (sharp move expected)
Support: 25900
Resistance: 26135
Market Breadth Ratio: 1.08 (broader buildup visible)
Bias: Short-term bullish, institutions buying dips
Sectors to watch: Auto Parts, Finance
Strategy: Replace inactive stocks and ride the trend
That’s all for today. Take care and have a profitable tomorrow.
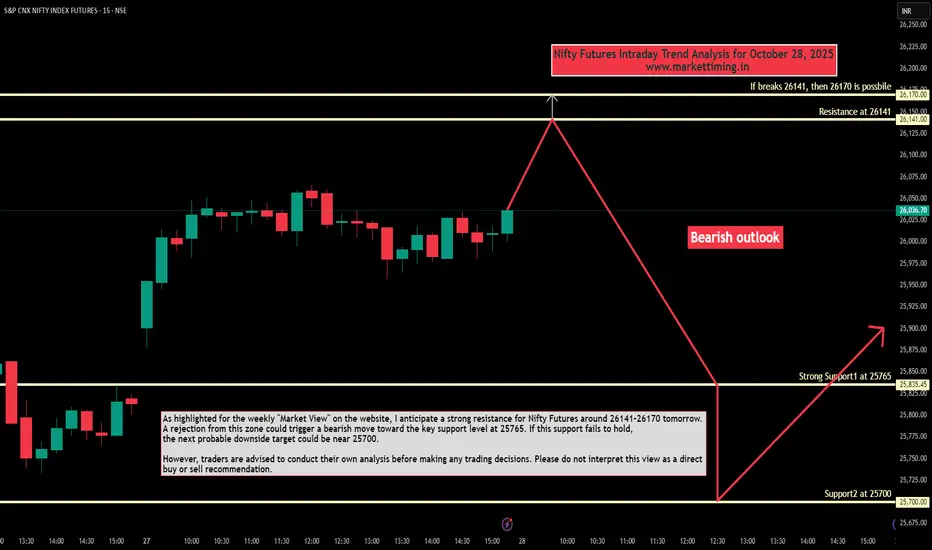
Nifty Futures Intraday Trend Analysis for October 28, 2025As highlighted for weekly "Market View" outlook on the website, I anticipate a strong resistance for Nifty Futures around 26141–26170 tomorrow. A rejection from this zone could trigger a bearish move toward the key support level at 25765. If this support fails to hold, the next probable downside target could be near 25700.
However, traders are advised to conduct their own analysis before making any trading decisions. Please do not interpret this view as a direct buy or sell recommendation.
Nifty - A shakeout to go more higher or a Bull trap?So on Friday, NSE:NIFTY fell as profit booking started after that sharp rally which we spotted earlier on October 9.
Big congrats to all the ones who trusted the analysis and traded it well.
Now, on Friday we saw both-side buildup on the index, but sellers’ volume was higher — that’s important to note.
For tomorrow, we only need to focus on one thing — whether Nifty breaks above 25850 or below 25750. These two levels hold massive OI buildups and will decide the next move.
If Nifty breaks above 25850, expect a sharp short rally (sharp because the PP is tight) that could push the index to new highs in the coming days.
But if it breaks below 25750 and sustains for one hour, we could see a drop toward 25666 / 25445.
However, my view stays Sell-on-Rise unless the index gives a strong close above 25850.
Why? Look at the attached chart — Friday’s candle was a clear shakeout candle, and there’s visible selling pressure buildup. This combination suggests that while accumulation is happening, buyers still lack the strength to dominate the sellers.
This weakness might reflect tomorrow. And remember — this view fails if Nifty breaks 25850 and sustains above it for one hour.
In trading, execution always beats opinion. So I’ll execute based on how the market behaves tomorrow — because I’d rather lose my view than lose my money.
Pivot stays at 25819, you guys already know what to do with that information.
On the sectoral front, NSE:CNXFINANCE , NSE:BANKNIFTY , and NSE:CNXMETAL continue to look strong.
That’s all for today. Take care and have a profitable tomorrow.
📊Levels at a glance:
Pivot: 25819
Support: 25750 (below = 25666 / 25445)
Resistance: 25850 (above = sharp short rally to new highs)
Pivot Percentile: Tight (volatile breakout/breakdown possible)
Bias: Sell-on-Rise until close above 25850
Market view: Shakeout candle with selling buildup
Sectors to watch: Financials, Banks, Steel
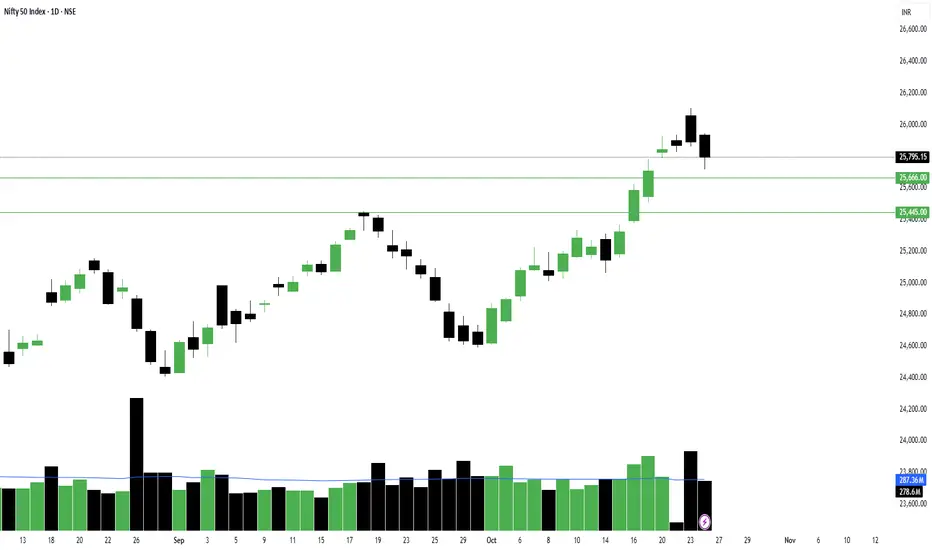
Nifty 50 @ 52 Week high but Could not Break ATH!What is there for Nifty 50 Now?
Nifty 50 went up till 52 week High @ 26104
but Could not Cross the ATH of 26277
missed by 173 points
There is a Hammer Candle formation on weekly charts from Controlling Supply Zone at the top. Which means bears are not interested to turn to bulls right now.
There is a Strong Resistance @ 26250
and if we talk about Support it is @ 25500 & 25000 and if it breaks it then @ 24500
As per my analysis
1. It should test 25500 and then turn bullish and try top break 26200-26250 Strong Resistance and it it breaks it then we will find a new ATH.
2. it cant hold on 25500 then next Support will be 25000. if it takes support from there it can find resistance much more near @ 25500 then and if it breaks it then it can rally again up till 26200 - 26250 strong resistance or otherwise drop till 24500.
3. If Nifty 50 cant hold on to 25500 & 25000 then it can settle @ 24500 then. It will be a strong Support as then it will be @ Controlling Demand Zone of Monthly. it will take some time then to reach this level monthly EMA 20 will also be near then and it should take Support from it and Start a new Bullish Journey
if it reaches 24500 then it will be a very good opportunity for investors to invest in major shares as they also be at very good level to buy then.

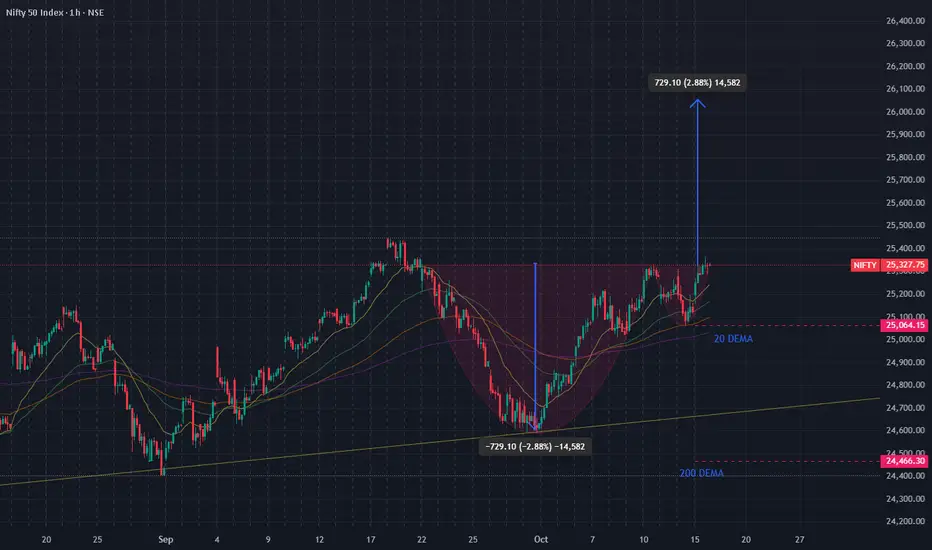
A Cup and Handle is visible in the Nifty 1 hour Chart... Setup - Completion of a Cup and Handle pattern.
Condition for Entry- A decisive break and close above the resistance level (the "rim" of the cup).
This confirms the pattern's breakout.
Entry Price - Enter long (buy) on a confirmed breakout above the rim resistance
(approximately 25,350 to 25,400 based on the chart).
Price Target - The conventional target for a Cup and Handle pattern is measured by
taking the depth of the cup and projecting it upwards from the breakout
point. The chart marks the depth as 775.10. Therefore, the target would
be: Breakout Price + Depth of the Cup. Example: If the breakout is at
25,350, the target is 25,350 + 775 = 26,125.
Stop-Loss (Risk Management) -
Place the stop-loss order below the lowest point of the "handle". This
ensures the trade is cut short if the breakout fails and the price reverses
into a downtrend.
Timeframe - This is an Hourly (1H) chart, so the trade would be suitable for a swing
trader or a short-term position trader, potentially lasting days to a couple
of weeks.
Nifty 50 Is Showing Sign of ReversalIn previous chart, Expected upsurge accomplished:
Nifty has reached the optimal supply zone and is expected to decline, at least up to 24,584 . The retracement of wave A (0.786) could act as a strong resistance for a reversal. The lower boundary lies at 24,120 , while 24,377 marks the low of wave (W). It’s better to consider the lower boundary as the potential maximum downside level.
Once the reversal level is identified, we will proceed toward the bullish path.
Stay tuned!
@Money_Dictators
Thanks :)

Nifty - Expecting a minor dip with short term bullishnessSo as we studied yesterday, a sharp move was under development — and that’s exactly what played out today.
Today’s move in NSE:NIFTY was genuine as it was backed by strong buyers’ volume of nearly 70 million.
However, I believe that’s just half the action I was expecting. Since today’s Pivot Percentile is again tight, we may see another sharp move soon.
Intraday momentum looks a bit exhausted, so a small dip can’t be ruled out.
Pivot has now moved up to 25300, which will act as intraday support tomorrow.
If this level breaks, we can see 25250–25180 levels being tested — that would be a good opportunity to collect longs.
A crucial support remains at 25100. The short-term trend stays clearly bullish as long as this level holds.
Next important resistance stands at 25355 — if Nifty breaks this, we could see another rally toward 25500 or even higher.
NSE:BANKNIFTY also looks strong after crossing its short-term resistance at 56156.
With this setup, we’re actively trading in NSE:CNXPSUBANK
Another short-term theme looking good right now is NSE:NIFTY_IND_DEFENCE
That’s all for the day. Take care and have a profitable tomorrow.
📊 Levels at a glance:
Pivot: 25300
Support 1: 25250–25180 (buy zone on dip)
Support 2: 25100 (crucial level)
Resistance: 25355 (break = rally to 25500+)
Pivot Percentile: Tight (sharp move likely)
Bias: Short-term bullish with minor intraday dip expected
Sectors to watch: PSU Banks, Defence

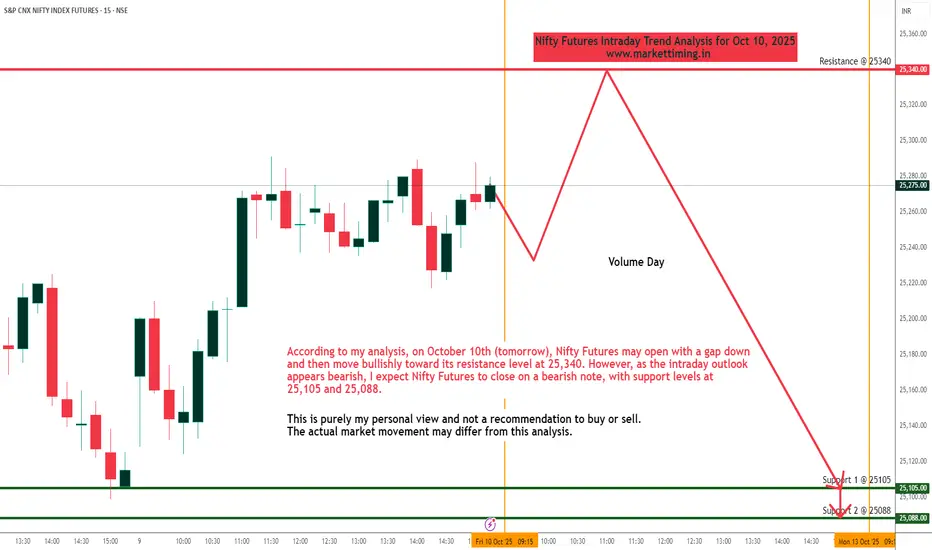
Nifty Futures Intraday Trend Analysis for October 10, 2025According to my analysis, on October 10th (tomorrow), Nifty Futures may open with a gap down and then move bullishly toward its resistance level at 25,340. However, as the intraday outlook appears bearish, I expect Nifty Futures to close on a bearish note, with support levels at 25,105 and 25,088.
This is purely my personal view and not a recommendation to buy or sell. The actual market movement may differ from this analysis.
Nifty - Shd hit 27000 in short termNIFTY - is bullish setup and gave entry around 24600 with SL 24400. we are expecting 27000 in short term.

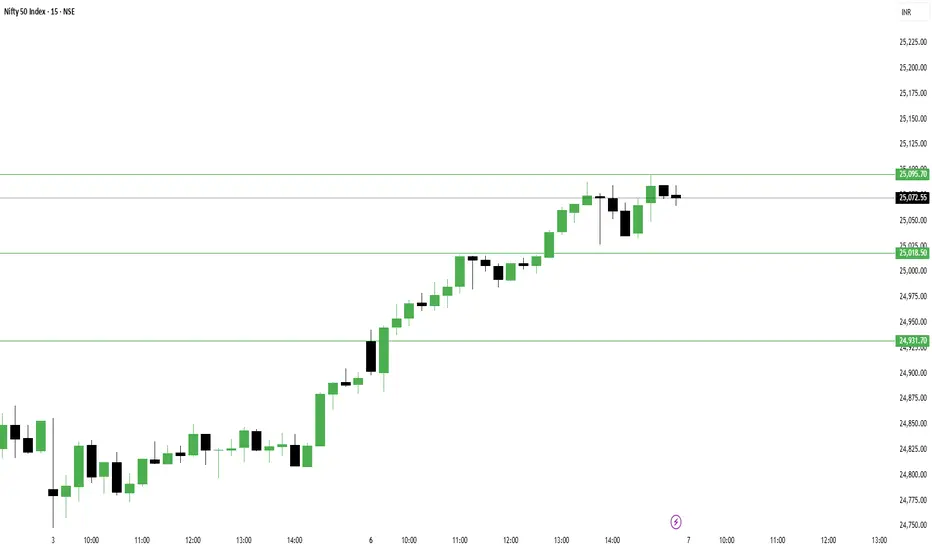
Today's Bullish Move Looks CautiousAs per the price and volume analysis I did yesterday, NSE:NIFTY was expected to give a dip to the support today and then bounce.
But instead, it moved sharply and closed above a very important resistance level — 25000!
However, I’m not fully confident in this move unless we get a follow-up candle of the same strength tomorrow.
Why?
Because there’s a clear pattern suggesting that Smart Money — or say institutions (and I’m not referring to FII data here; I don’t usually trust that) — sold their positions to retailers. The Retail Index went down even on such a strong up day!
That’s not a good sign for the index in the coming days. I think this will soon reflect as a shakeout in the near term.
Now yes, today’s move was backed by buyers’ data and the trend did turn upward — but the momentum didn’t follow through.
Now let’s check what the data says for tomorrow:
– Pivot has risen to 25018, and PP is still tight
– Support for tomorrow: 25025
– Resistance for tomorrow: 25095
According to the data, the index should stay sideways tomorrow.
However, if any of these levels break, here’s my plan:
1. If 25018 breaks on the downside, I’ll short with targets 24930 / 24850
2. If 25095 breaks on the upside, I’ll go long with a target of 25225
Let’s see how it plays out. I’ll stick to my plan as always — no blind chasing.
NSE:BANKNIFTY has broken above its short-term pivot, so I’ll keep my focus there too. Any dip there would be an opportunity to go long.
FnO stocks backed by buyers’ volume:
1. NSE:KEI
2. NSE:BHARATFORG
Sectors to watch tomorrow – Healthcare and Finance.
That’s all for today. Take care and have a profitable tomorrow!
---
📊 Levels at a glance:
- Pivot: 25018
- Support: 25025
- Resistance: 25095
- Downside targets (if pivot breaks): 24930 / 24850
- Upside target (if resistance breaks): 25225
- Pivot Percentile: Tight (range-bound bias)
- Bias: Sideways, watch for shakeout or follow-up confirmation
- Sectors to watch: Healthcare, Finance
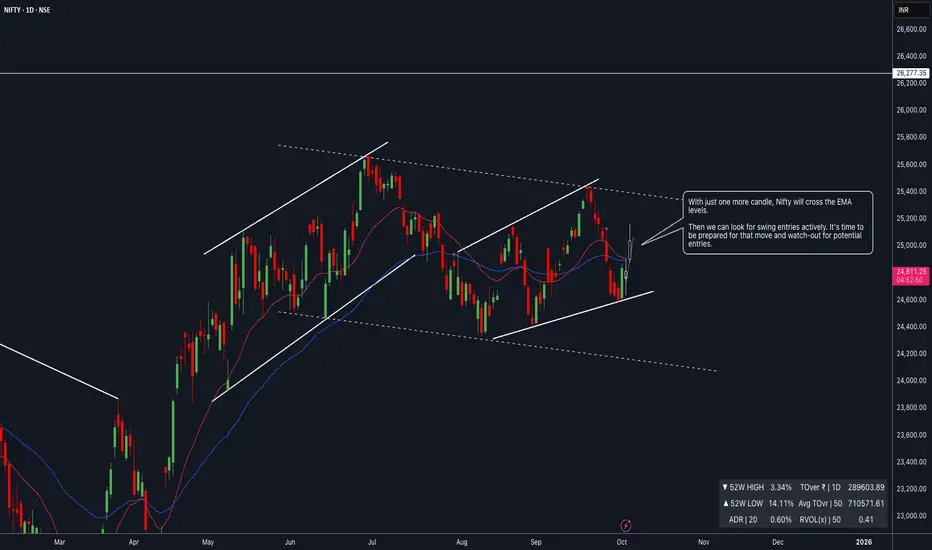
NIFTY : Nifty at a Turning Point : EMA Breakout in Sight📈 Nifty Technical & Fundamental Outlook
With just one more candle, Nifty looks set to cross above the key EMA levels. This shift is crucial as it signals potential strength building up in the market. Once that confirmation comes through, we can start actively looking for swing entries. The next few sessions will be important to track, so it’s time to stay prepared and alert for possible opportunities.
From a broader perspective, the market seems to be aligning with the best-case scenario I was expecting. The sentiment is turning bullish, and unless we witness sharp bouts of selling pressure in the coming days, the probability of a sustained recovery appears strong.
On the fundamental side, a couple of factors are supportive:
The GST cut is expected to boost consumption and corporate earnings.
With upcoming quarterly results, the overall market P/E ratio could find stronger justification if earnings come in robust.
Institutional delivery data is not reflecting any aggressive selling interest, which adds confidence to the current setup.
✅ All these tailwinds together create a strong case for a bullish bias in the near term.
As traders, the plan now is simple: track the EMA breakout, monitor earnings triggers, and stay ready for high-probability swing setups.
📢📢📢
If my perspective changes or if I gather additional fundamental data that influences my views, I will provide updates accordingly.
Thank you for following along with this journey, and I remain committed to sharing insights and updates as my trading strategy evolves. As always, please feel free to reach out with any questions or comments.
Other posts related to this particular position and scrip, if any, will be attached underneath. Do check those out too.
Disclaimer : The analysis shared here is for informational purposes only and should not be considered as financial advice. Trading in all markets carries inherent risks, and past performance is not indicative of future results. It’s essential to conduct your own research and assess your risk tolerance before making any investment decisions. The views expressed in this analysis are solely mine. It’s important to note that I am not a SEBI registered analyst, so the analysis provided does not constitute formal investment advice under SEBI regulations.
Volume turnaround seen in Nifty on daily chart but...So as we’ve been studying for the past 3 days – NSE:NIFTY ’s candle kept closing red but the volume was with buyers. Yesterday, that clearly reflected with the index jumping +225 points in a sharp, clean move.
Cheers to those who trusted the commentary and took early entries! I did too.
The idea now is simple – hold on to that position until we see sellers’ volume with a green candle.
Now, let’s check the data for tomorrow:
– Pivot has moved up to 24770
– PP is wide, which signals a sideways to trending day with bullish tone intact
– Support for tomorrow is 24800
– Resistance for the day is 24930. Only if this level is breached and sustained for at least 1 hour can we expect a sharp move.
Any dip from here remains a buy opportunity as long as the index stays above the pivot at 24770, because the current candle is backed by buyers’ volume.
But keep this in mind – the net volume of the market is still in red. That means it’s not yet the time to open long-term portfolio positions. Wait for net volume to give a turnaround before building long-term stock holdings. Remember, we are still under the correction zone that began in September 2024.
On the sector front, rotation is being seen in Defence and Media, while Finance and NBFC continue in high momentum for the short term.
FnO stocks with buyers’ volume up are:
NSE:BHARATFORG and NSE:BSE
You can look for intraday opportunities here. But for options trading, be mindful of pivotal entries and IVP. Sometimes these stocks take more than a day to move, so don’t be disheartened if they don’t react immediately. Keep them on watch and plan your entry to manage risk.
That’s all for the day. Take care and have a profitable tomorrow.
I truly hope you learn and earn a lot with me!
---
📊 Levels at a glance:
Pivot: 24770
Support: 24800
Resistance: 24930 (sustain 1 hour = sharp move)
Pivot Percentile: Wide (sideways to trending)
Bias: Bullish as long as index holds above pivot, buy dips backed by volume
Sectors to watch: NSE:NIFTY_IND_DEFENCE , NSE:CNXMEDIA , NSE:CNXFINANCE , NBFC
FnO Focus: #BHARATFORGE, #BSE
Nifty 50: Genuine Rally or Selloff Setup?The Nifty 50 Index went up, but this upward move was likely just a temporary correction, not the start of a new, long-term rise.
Bottom (Wave W): The index first hit a low around 24,377
Bounce (Wave X): It then went up to a high near 25,448. This rise was a clear, three-part corrective move (like an ABC pattern) that stayed inside a rising channel .
Clue: Because the move from the bottom (W) to the peak (X) was corrective, it suggests the overall trend is still bearish (downward).
Points to look at:
1. Reversal: The index is currently around 24,836 and is starting to turn down from the top of that rising channel. This suggests the temporary rise is over.
2. Projected Drop (Wave Y): The main prediction is a significant drop (Wave Y) that will likely break the previous low of 24,377 .
3. Target: This decline is expected to head toward the lower blue trendline on the chart, completing a larger WXY corrective pattern.
4. Projection: Ending point of wave (Y) can act as the ride for the new impulse cycle.
5. Bearish Stance: Traders should be cautiously bearish (expecting the price to fall).
6. Price action perspective: Previous swing is bearish, better to look at short positions for safe entry.
7. Selling Opportunities: Any small upward movements (retracements) are seen as good selling opportunities (betting on the price going down), as long as the price doesn't break above the recent highs or the channel ceiling.24,300 is indeed a strong demand zone.
Stay tuned!
Money Dictators :)

nifty50 Analysis | be careful from trapMarket Outlook
Support Zone: 24,550 – 24,400
Resistance Levels: 24,750 – 24,790 and 24,960 – 24,990
A falling wedge pattern is currently forming just above the support zone. The key level to watch is 24,590, as a sweep of this low appears likely. However, before a potential breakdown, price may first retest the immediate resistance area and face rejection, leading back toward the support zone.

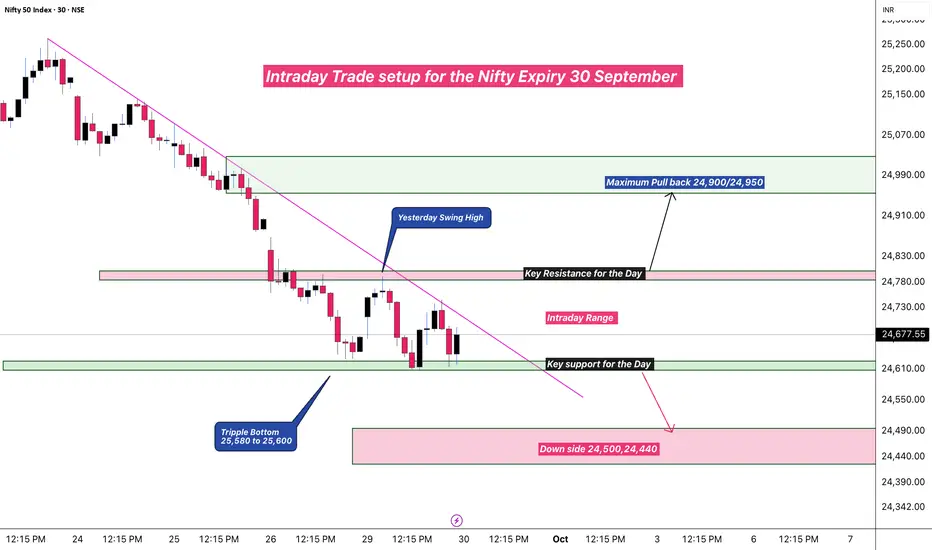
Expiry Trade Setup : 30 September 📊 Nifty Expiry Day Analysis
I’ve prepared a detailed trade setup for today’s Nifty expiry session. The key resistance zone is placed around 24,800, while 24,600 acts as a crucial lower boundary.
It’s advisable to avoid trading within the 24,600–24,800 range, as the market may remain choppy and directionless.
Instead, wait for a clear breakout beyond 24,800 or a breakdown below 24,600 to initiate intraday positions with better risk-reward opportunities.
Stay disciplined and trade with proper risk management.
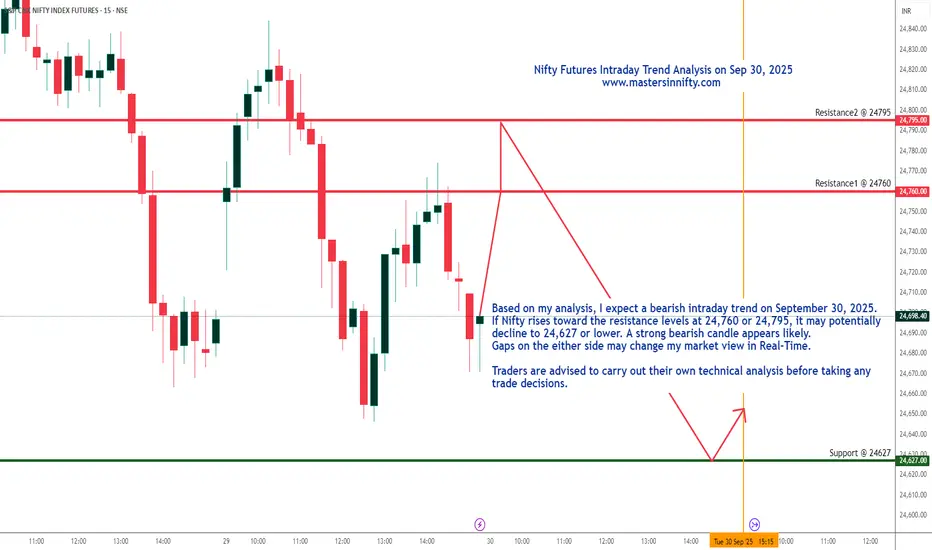
Nifty Futures Intraday Trend analysis on Sept 30, 2025Based on my analysis, I expect a bearish intraday trend on September 30, 2025. If Nifty rises toward the resistance levels at 24,760 or 24,795, it may potentially decline to 24,627 or lower. A strong bearish candle appears likely. Gaps on the either side may change my market view.
Traders are advised to carry out their own technical analysis before taking any trade decisions.
Nifty Spot Daily Trend Analysis from September 29Nifty spot may find support near 24,530 with a potential rebound toward 25,100, indicating the possibility of a Head and Shoulders formation in the coming sessions.
A gap-up opening on September 29, 2025 cannot be ruled out, which may influence these projected levels. Traders should rely on their own technical assessment before initiating positions.
Adherence to disciplined risk management is strongly recommended.
