Nifty AnalysisNifty formed a Green candle in daily timeframe with upper and long lower shadow. Nifty is above short term EMA in daily timeframe (20,50,100). Though it supports Bullish sentiment, Nifty is nearing strong resistance around 25,000.
Nifty may attempt to fill the Gap created on 26th Aug.
Green Path: If Nifty breaks and sustains above 24,990, then Nifty may reach 25,110 - 25,140 - 25,180.
Red Path: If Nifty fails to break and sustain above 24,990, then Nifty may reach 24,840 - 24,755 - 24,600
Niftytradesetup

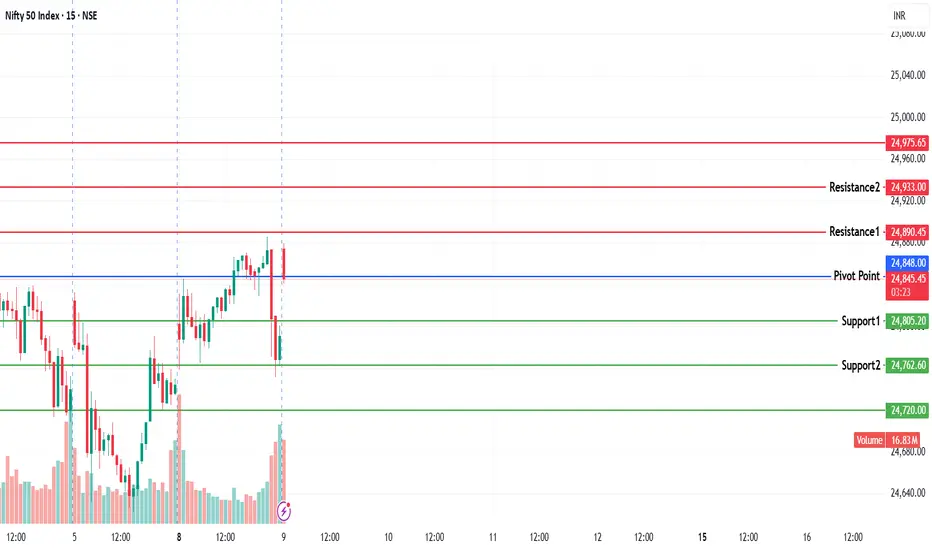
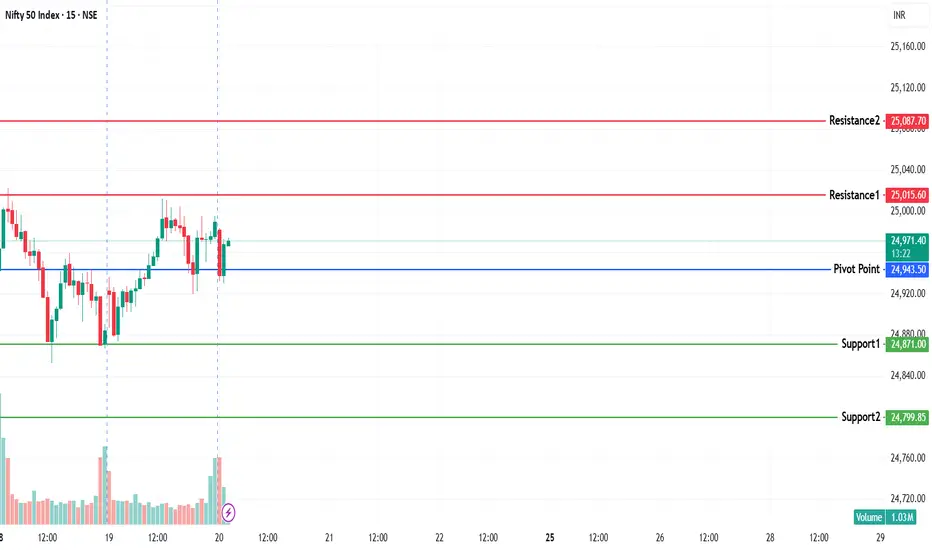
NIFTY KEY LEVELS FOR 09.09.2025NIFTY KEY LEVELS FOR 09.09.2025
RTF: 3 Minutes
If the candle stays above the pivot point, it is considered a bullish bias; if it remains below, it indicates a bearish bias. Price may reverse near Resistance 1 or Support 1. If it moves further, the next potential reversal zone is near Resistance 2 or Support 2. If these levels are also broken, we can expect the trend.
If the range(R2-S2) is narrow, the market may become volatile or trend strongly. If the range is wide, the market is more likely to remain sideways
📢 Disclaimer
I am not a SEBI-registered financial adviser.
The information, views, and ideas shared here are purely for educational and informational purposes only. They are not intended as investment advice or a recommendation to buy, sell, or hold any financial instruments.
Please consult with your SEBI-registered financial advisor before making any trading or investment decisions.
Trading and investing in the stock market involves risk, and you should do your own research and analysis. You are solely responsible for any decisions made based on this research.
Nifty Analysis EOD – September 8, 2025 – Monday🟢 Nifty Analysis EOD – September 8, 2025 – Monday 🔴
Shooting Star Signals – Bulls vs Bears Tug-of-War Continues
🗞 Nifty Summary
Nifty opened with a 58-point gap-up, briefly surged another 28 points in the first minute, then slipped 73 points lower, nearly filling the gap. It found support and bounced back, rallying toward the PDH and resistance zone at 24,835 ~ 24,845, where it faced rejection and marked the day high at 24,845.7.
Support at 24,785 (previous resistance turned support) held well. Later, bulls attempted to break PDH and resistance again and succeeded temporarily. However, a long-term trendline held firm and ultimately broke. That breakout attempt turned into a false breakout, and strong selling pressure erased all intraday gains. The index closed near the day’s low at 24,773.15, just 32 points higher than the prior close.
The last 3 consecutive red candles, each with marginal gains, reflect ongoing selling pressure at higher levels.
🛡 5 Min Intraday Chart with Levels
📉 Daily Time Frame Chart with Intraday Levels
🕯 Daily Candle Breakdown
Open: 24,802.60
High: 24,885.50
Low: 24,751.55
Close: 24,773.15
Change: +32.15 (+0.13%)
🏗️ Structure Breakdown
Red candle (Close < Open).
Body: 29.45 points → small body (indecision).
Upper wick: 82.90 points → long upper wick indicates strong rejection.
Lower wick: 21.60 points → short.
📚 Interpretation
The market opened higher and attempted to sustain at highs but was met with strong supply near 24,880.
Selling pressure dominated, pushing the price back toward the lows.
Long upper wick signals profit-booking and bearish hesitation.
🕯Candle Type
Shooting Star / Inverted Hammer (bearish context) → suggests resistance and inability to extend bullish momentum.
🔍 Short-Term View – September 9, 2025
Resistance: 24,895 – 24,910 (strong supply zone).
Support: 24,750 (today’s defended level), then 24,620.
👉 Bias Direction:
Failure to cross 24,880 may lead to renewed weakness.
A close below 24,750 could drag the index quickly toward 24,620.
🚩 Current Market Sentiment:
A tug-of-war:
Bulls defending 24,620–24,650.
Bears defending 24,880–24,980.
A decisive breakout from this range will determine the next directional move.
🛡 5 Min Intraday Chart
⚔️ Gladiator Strategy Update
ATR: 204.9
IB Range: 87.2 → Medium
Market Structure: Balanced
Trade Highlights:
12:35 AM – Long Trigger → SL Hit
📌 Support & Resistance Levels
Resistance Zones:
24,785
24,835 ~ 24,845
24,895 ~ 24,910
24,975 ~ 25,004
Support Zones:
24,685
24,657
24,630 ~ 24,620
24,540 ~ 24,525
💡 Final Thoughts
Today’s Shooting Star reflects a clear bearish bias at higher levels. Despite small gains, the inability to sustain above 24,880 highlights selling pressure. Until bulls reclaim 24,880–24,910 convincingly, expect continued sideways to bearish action.
📖 “When resistance holds, strength is tested, and only time reveals the winner.”
✏️ Disclaimer
This is just my personal viewpoint. Always consult your financial advisor before taking any action.

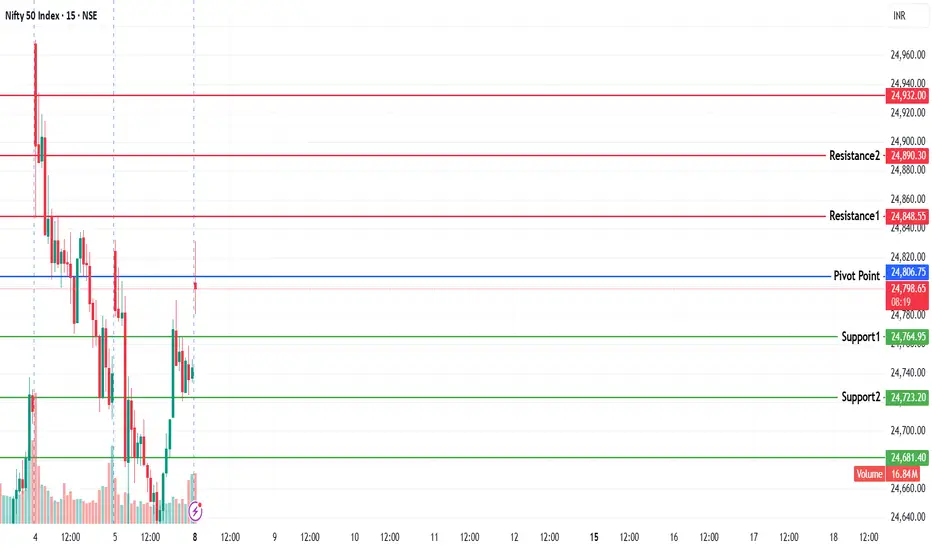
NIFTY KEY LEVELS FOR 08.09.2025NIFTY KEY LEVELS FOR 08.09.2025
RTF: 3 Minutes
If the candle stays above the pivot point, it is considered a bullish bias; if it remains below, it indicates a bearish bias. Price may reverse near Resistance 1 or Support 1. If it moves further, the next potential reversal zone is near Resistance 2 or Support 2. If these levels are also broken, we can expect the trend.
If the range(R2-S2) is narrow, the market may become volatile or trend strongly. If the range is wide, the market is more likely to remain sideways
📢 Disclaimer
I am not a SEBI-registered financial adviser.
The information, views, and ideas shared here are purely for educational and informational purposes only. They are not intended as investment advice or a recommendation to buy, sell, or hold any financial instruments.
Please consult with your SEBI-registered financial advisor before making any trading or investment decisions.
Trading and investing in the stock market involves risk, and you should do your own research and analysis. You are solely responsible for any decisions made based on this research.
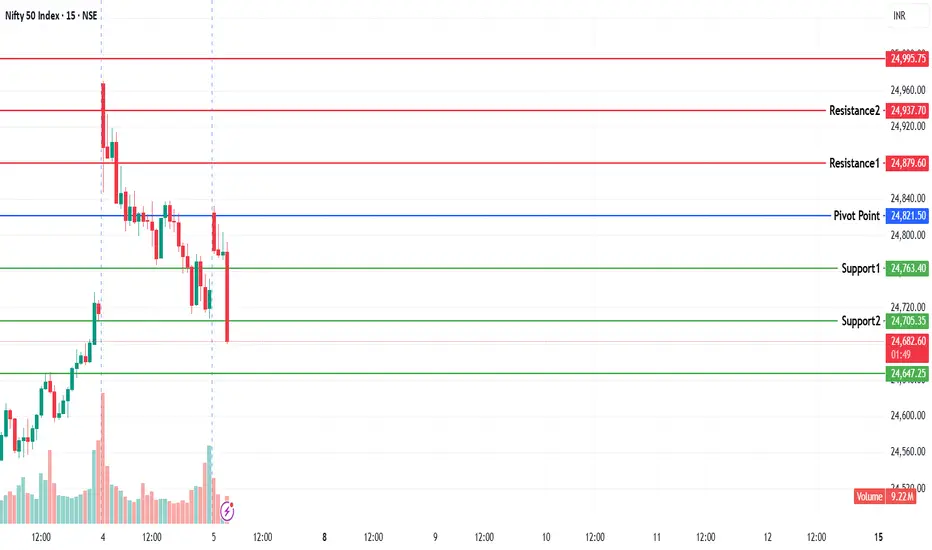
NIFTY KEY LEVELS FOR 05.09.2025NIFTY KEY LEVELS FOR 05.09.2025
RTF: 3 Minutes
If the candle stays above the pivot point, it is considered a bullish bias; if it remains below, it indicates a bearish bias. Price may reverse near Resistance 1 or Support 1. If it moves further, the next potential reversal zone is near Resistance 2 or Support 2. If these levels are also broken, we can expect the trend.
If the range(R2-S2) is narrow, the market may become volatile or trend strongly. If the range is wide, the market is more likely to remain sideways
📢 Disclaimer
I am not a SEBI-registered financial adviser.
The information, views, and ideas shared here are purely for educational and informational purposes only. They are not intended as investment advice or a recommendation to buy, sell, or hold any financial instruments.
Please consult with your SEBI-registered financial advisor before making any trading or investment decisions.
Trading and investing in the stock market involves risk, and you should do your own research and analysis. You are solely responsible for any decisions made based on this research.
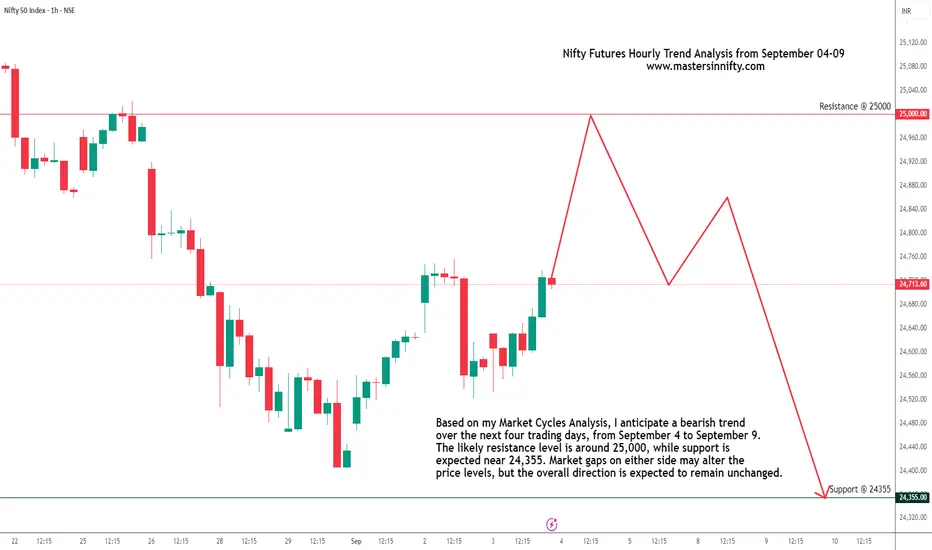
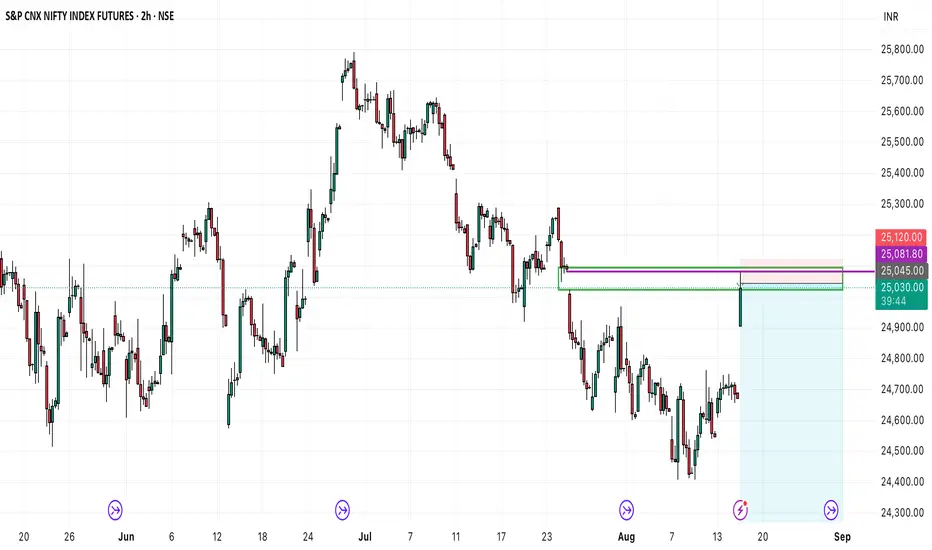
Nifty Futures Hourly Trend Analysis for the next 4 Trading DaysBased on my Market Cycles Analysis, I anticipate a bearish trend over the next four trading days, from September 4 to September 9. The likely resistance level is around 25,000, while support is expected near 24,355. Market gaps on either side may alter the price levels, but the overall direction is expected to remain unchanged.
This is just my personal view but not a recommendation to buy or sell. Use your own technical study for entries, exits and risk management.
NIFTY KEY LEVELS FOR 02.09.2025NIFTY KEY LEVELS FOR 02.09.2025
RTF: 3 Minutes
If the candle stays above the pivot point, it is considered a bullish bias; if it remains below, it indicates a bearish bias. Price may reverse near Resistance 1 or Support 1. If it moves further, the next potential reversal zone is near Resistance 2 or Support 2. If these levels are also broken, we can expect the trend.
If the range(R2-S2) is narrow, the market may become volatile or trend strongly. If the range is wide, the market is more likely to remain sideways
📢 Disclaimer
I am not a SEBI-registered financial adviser.
The information, views, and ideas shared here are purely for educational and informational purposes only. They are not intended as investment advice or a recommendation to buy, sell, or hold any financial instruments.
Please consult with your SEBI-registered financial advisor before making any trading or investment decisions.
Trading and investing in the stock market involves risk, and you should do your own research and analysis. You are solely responsible for any decisions made based on this research.

NIFTY KEY LEVELS FOR 01.09.2025NIFTY KEY LEVELS FOR 01.09.2025
RTF: 3 Minutes
If the candle stays above the pivot point, it is considered a bullish bias; if it remains below, it indicates a bearish bias. Price may reverse near Resistance 1 or Support 1. If it moves further, the next potential reversal zone is near Resistance 2 or Support 2. If these levels are also broken, we can expect the trend.
If the range(R2-S2) is narrow, the market may become volatile or trend strongly. If the range is wide, the market is more likely to remain sideways
📢 Disclaimer
I am not a SEBI-registered financial adviser.
The information, views, and ideas shared here are purely for educational and informational purposes only. They are not intended as investment advice or a recommendation to buy, sell, or hold any financial instruments.
Please consult with your SEBI-registered financial advisor before making any trading or investment decisions.
Trading and investing in the stock market involves risk, and you should do your own research and analysis. You are solely responsible for any decisions made based on this research.

Nifty sell till 23932, trend continueNifty sell till 23932, trend continue towards sell, as per my previous still nifty under selling pressure. for a new buy after reach that range we can consider or after trend change indication will decide. NOW its in Pure SELL

NIFTY KEY LEVELS FOR 29.08.2025NIFTY KEY LEVELS FOR 29.08.2025
RTF: 3 Minutes
If the candle stays above the pivot point, it is considered a bullish bias; if it remains below, it indicates a bearish bias. Price may reverse near Resistance 1 or Support 1. If it moves further, the next potential reversal zone is near Resistance 2 or Support 2. If these levels are also broken, we can expect the trend.
If the range(R2-S2) is narrow, the market may become volatile or trend strongly. If the range is wide, the market is more likely to remain sideways
📢 Disclaimer
I am not a SEBI-registered financial adviser.
The information, views, and ideas shared here are purely for educational and informational purposes only. They are not intended as investment advice or a recommendation to buy, sell, or hold any financial instruments.
Please consult with your SEBI-registered financial advisor before making any trading or investment decisions.
Trading and investing in the stock market involves risk, and you should do your own research and analysis. You are solely responsible for any decisions made based on this research.

NIFTY KEY LEVELS FOR 28.08.2025NIFTY KEY LEVELS FOR 28.08.2025
************************* Time frame 3 Minutes******************************
If the candle stays above the pivot point, it is considered a bullish bias; if it remains below, it indicates a bearish bias. Price may reverse near Resistance 1 or Support 1. If it moves further, the next potential reversal zone is near Resistance 2 or Support 2. If these levels are also broken, we can expect the trend.
If the range(R2-S2) is narrow, the market may become volatile or trend strongly. If the range is wide, the market is more likely to remain sideways
📢 Disclaimer
I am not a SEBI-registered financial adviser.
The information, views, and ideas shared here are purely for educational and informational purposes only. They are not intended as investment advice or a recommendation to buy, sell, or hold any financial instruments.
Please consult with your SEBI-registered financial advisor before making any trading or investment decisions.
Trading and investing in the stock market involves risk, and you should do your own research and analysis. You are solely responsible for any decisions made based on this research.

Nifty 50 Sell at 25093 with this 3 targetsNifty Still in down trend in previous pull back every retail trader thinking to buy, but actual setup is now pure sell starts and driving toward this 3 targets i mentioned in charts. Technical Analysis works

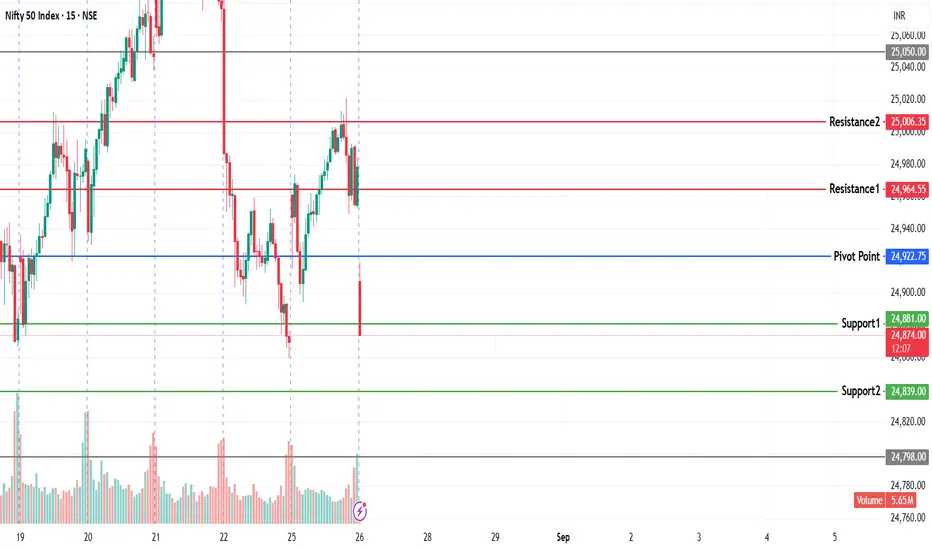
NIFTY KEY LEVELS FOR 26.08.2025NIFTY KEY LEVELS FOR 26.08.2025
************************* Time frame 3 Minutes******************************
If the candle stays above the pivot point, it is considered a bullish bias; if it remains below, it indicates a bearish bias. Price may reverse near Resistance 1 or Support 1. If it moves further, the next potential reversal zone is near Resistance 2 or Support 2. If these levels are also broken, we can expect the trend.
If the range(R2-S2) is narrow, the market may become volatile or trend strongly. If the range is wide, the market is more likely to remain sideways
📢 Disclaimer
I am not a SEBI-registered financial adviser.
The information, views, and ideas shared here are purely for educational and informational purposes only. They are not intended as investment advice or a recommendation to buy, sell, or hold any financial instruments.
Please consult with your SEBI-registered financial advisor before making any trading or investment decisions.
Trading and investing in the stock market involves risk, and you should do your own research and analysis. You are solely responsible for any decisions made based on this research.
NIFTY KEY LEVELS FOR 25.08.2025NIFTY KEY LEVELS FOR 25.08.2025
If the candle stays above the pivot point, it is considered a bullish bias; if it remains below, it indicates a bearish bias. Price may reverse near Resistance 1 or Support 1. If it moves further, the next potential reversal zone is near Resistance 2 or Support 2. If these levels are also broken, we can expect the trend.
If the range(R2-S2) is narrow, the market may become volatile or trend strongly. If the range is wide, the market is more likely to remain sideways
📢 Disclaimer
I am not a SEBI-registered financial adviser.
The information, views, and ideas shared here are purely for educational and informational purposes only. They are not intended as investment advice or a recommendation to buy, sell, or hold any financial instruments.
Please consult with your SEBI-registered financial advisor before making any trading or investment decisions.
Trading and investing in the stock market involves risk, and you should do your own research and analysis. You are solely responsible for any decisions made based on this research.

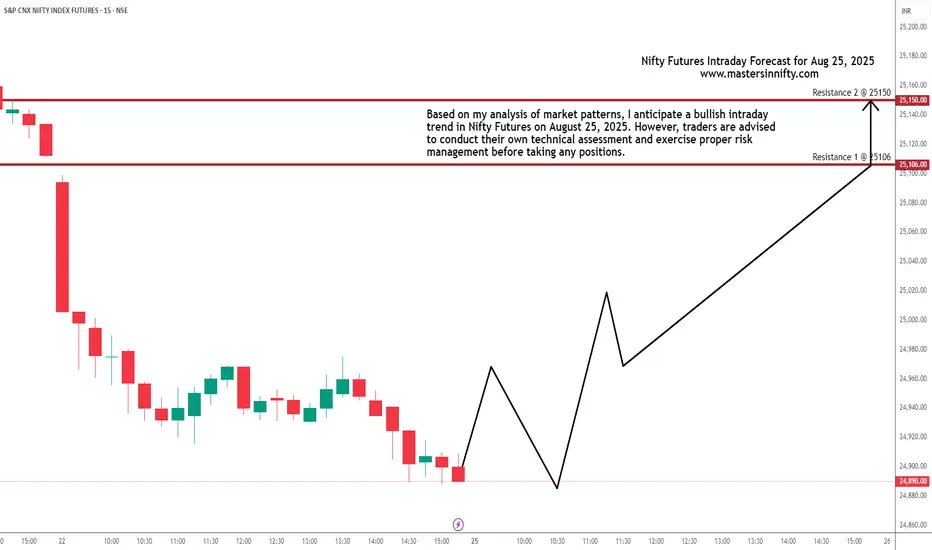
Nifty Futures Intraday Trend analysis on August 25, 2025Based on my analysis of market patterns, I anticipate a bullish intraday trend in Nifty Futures on August 25, 2025. However, traders are advised to conduct their own technical assessment and exercise proper risk management before taking any positions.
My view is not a recommendation to buy or sell but intended for educational purposes.
Nifty Analysis EOD – August 22, 2025 – Friday🟢 Nifty Analysis EOD – August 22, 2025 – Friday 🔴
Bears finally break the wall — wiping out 4 sessions’ gains
🗞 Nifty Summary
Yesterday, we noted:
“Though the close is higher by +33 points vs the previous day, it left behind a red daily candle (close < open). This indicates fading bullish momentum, even though HH-HL structure is still intact. The range was narrow (≈98 points), categorising the day as range-bound, not sideways. The previous weekly expiry was also narrow yet sideways.”
That caution proved valid today. Right from the opening candle, Nifty broke the PDL + S1 zone, invalidating the HH-HL structure and giving bears a clean entry. The past two sessions’ range contraction added fuel to the breakdown, resulting in a 225-point fall.
The attempted defense at 24,995, 24,955, 24,920, and 24,890 provided only temporary halts, but the downside momentum was too strong. The day ended at 24,869.45, erasing gains of the last 4 sessions.
On the weekly chart, the index now resembles a bearish pin bar / inverted hammer, a sign of exhaustion at the top.
📌 For Monday:
If Nifty fails to hold 24,850–24,820, then 24,745 and 24,650 come into play.
Bulls must reclaim and close above 24,955 to hold their fort.
🛡 5 Min Intraday Chart with Levels
📌 Intraday Walk
Opened at 25,064.15 with mild optimism.
First 1-min candle → broke PDL + S1 decisively → bears in control.
Gradual fall → temporary fights at 24,995 → 24,955 → 24,920 → 24,890, but all failed.
Closing print at 24,870.10, almost at the day’s low.
📉 Daily Time Frame Chart with Intraday Levels
🕯 Daily Candle Breakdown
Open: 25,064.15
High: 25,084.85
Low: 24,859.15
Close: 24,870.10
Change: −213.65 (−0.85%)
🏗️ Structure Breakdown
Strong red candle (Close < Open)
Body: 194.05 points
Upper wick: 20.70 points
Lower wick: 10.95 points
Full-body bearish bar → strong downside momentum
📚 Interpretation
Sellers seized control after three days of stalling at 25,150–25,180.
Break below 25,000 confirms supply dominance.
Closing near day’s low = no recovery attempt → decisive distribution.
🕯️Candle Type
Bearish Marubozu-style → clear trend shift to sellers.
🛡 5 Min Intraday Chart
⚔️ Gladiator Strategy Update
ATR: 198.19
IB Range: 134.25 → Medium
Market Structure: ImBalanced
Trade Highlight:
9:20 → Short Trigger → Target Achieved (R:R = 1:2).
🕵️Range & Bias
Support zone: 24,850–24,820
Resistance zone: 25,000–25,080
Bias: Bearish momentum → “Sell on rise” until 25k is reclaimed.
📌 Support & Resistance Levels
🎚️ Resistance Zones
24,920
24,955
24,995 ~ 25,005
25,080 ~ 25,090
🎚️ Support Zones
24,850 ~ 24,820
24,770
24,745
24,695 ~ 24,675
💡 Final Thoughts
The market has shifted gears from cautious bullish to outright bearish, with 25,000 now acting as a supply zone. Unless bulls reclaim lost ground above 24,955–25,000, the slide toward 24,745–24,650 seems inevitable.
“Markets climb the stairs but take the elevator down — today, the elevator arrived.”
✏️ Disclaimer
This is my personal analysis — not investment advice. Please consult your financial advisor before trading.

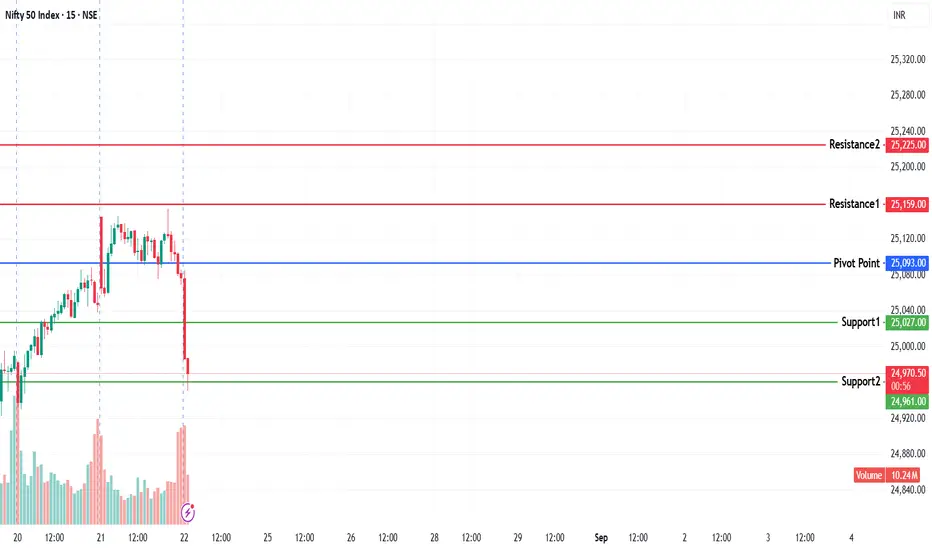
NIFTY KEY LEVELS FOR 22.08.2025NIFTY KEY LEVELS FOR 22.08.2025
If the candle stays above the pivot point, it is considered a bullish bias; if it remains below, it indicates a bearish bias. Price may reverse near Resistance 1 or Support 1. If it moves further, the next potential reversal zone is near Resistance 2 or Support 2. If these levels are also broken, we can expect the trend.
If the range(R2-S2) is narrow, the market may become volatile or trend strongly. If the range is wide, the market is more likely to remain sideways
📢 Disclaimer
I am not a SEBI-registered financial adviser.
The information, views, and ideas shared here are purely for educational and informational purposes only. They are not intended as investment advice or a recommendation to buy, sell, or hold any financial instruments.
Please consult with your SEBI-registered financial advisor before making any trading or investment decisions.
Trading and investing in the stock market involves risk, and you should do your own research and analysis. You are solely responsible for any decisions made based on this research.
Nifty Weekly Outlook (22–28 August 2025)Nifty Weekly Outlook (22–28 August 2025)
Above pivot = bullish bias.
Below pivot = bearish bias.
Watch for reversals near R1/S1, then R2/S2, and finally R3/S3 if levels break.
📢 Disclaimer
I am not a SEBI-registered financial adviser.
The information, views, and ideas shared here are purely for educational and informational purposes only. They are not intended as investment advice or a recommendation to buy, sell, or hold any financial instruments.
Please consult with your SEBI-registered financial advisor before making any trading or investment decisions.
Trading and investing in the stock market involves risk, and you should do your own research and analysis. You are solely responsible for any decisions made based on this research.

Nifty Fut short viewNifty Fut short view
Entry - 25045
Stop loss - 25120
Target - 24085
Risk Reward - 1:12.8
NIFTY KEY LEVELS FOR 21.08.2025NIFTY KEY LEVELS FOR 21.08.2025
If the candle stays above the pivot point, it is considered a bullish bias; if it remains below, it indicates a bearish bias. Price may reverse near Resistance 1 or Support 1. If it moves further, the next potential reversal zone is near Resistance 2 or Support 2. If these levels are also broken, we can expect the trend.
If the range(R2-S2) is narrow, the market may become volatile or trend strongly. If the range is wide, the market is more likely to remain sideways
📢 Disclaimer
I am not a SEBI-registered financial adviser.
The information, views, and ideas shared here are purely for educational and informational purposes only. They are not intended as investment advice or a recommendation to buy, sell, or hold any financial instruments.
Please consult with your SEBI-registered financial advisor before making any trading or investment decisions.
Trading and investing in the stock market involves risk, and you should do your own research and analysis. You are solely responsible for any decisions made based on this research.

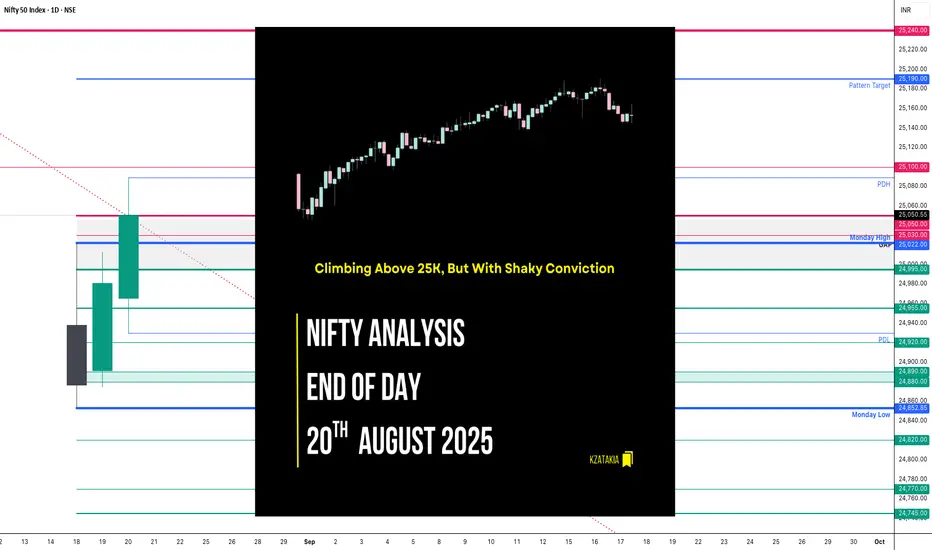
Nifty Analysis EOD – August 20, 2025 – Wednesday🟢 Nifty Analysis EOD – August 20, 2025 – Wednesday 🔴
Climbing Above 25K, But With Shaky Conviction
🗞 Nifty Summary
Nifty opened flat but slipped 50+ points in the opening minutes, sliding below the CPR zone to mark the day’s low at 24,929.70.
A sharp recovery followed — breaking the day’s high and reaching PDC (Previous Day Close) — only to get rejected and pulled back toward the CPR BC.
This 60-point rollercoaster played out within just 30 minutes, setting a volatile tone.
Later, after crossing 24,995, the index faced resistance at 25,020–25,030. Gradual progress pushed Nifty to 25,063, where it hit a trendline hurdle. Despite multiple attempts, it couldn’t hold convincingly above it, and the day ended at 25,050.55 — marginally positive (+ 70 points), but with effort showing fatigue.
👉 Intraday action tells the story: every breakout lacked conviction, with sharp throwbacks. While Nifty somehow managed to hold above 25k, Bank Nifty stayed weak, stuck near VWAP and below CPR (negative bias).
With weekly expiry tomorrow, sustainability above 24,990–25,030 and breakout PDH in the first half could trigger a short-covering rally targeting 25,190–25,240.
🛡 5 Min Intraday Chart with Levels
📊 Intraday Walk
🔻 Early dip → Below CPR, day low at 24,929.70.
🔼 Quick rebound → Tested PDC, rejection pulled back to CPR BC.
⚔️ 60-point whipsaws within first 30 mins = High volatility.
🔼 Crossed 24,995 → Resistance at 25,020–25,030 zone.
🚧 Stalled at 25,063 → Trendline resistance.
📉 Multiple failed breakouts, sharp pullbacks.
✅ Closed 25,050.55, above 25k but not convincing.
📉 Daily Time Frame Chart with Intraday Levels
🕯 Daily Candle Breakdown
Open: 24,965.80
High: 25,088.70
Low: 24,929.70
Close: 25,050.55
Change: +69.90 (+0.28%)
🏗️ Structure Breakdown
Green Candle (Close > Open).
Body: 84.75 points
Upper Wick: 38.15 points
Lower Wick: 36.10 points
Balanced wicks → Intraday tug-of-war.
📚 Interpretation
Buyers managed another close above 25,000.
Supply zone still active near 25,080–25,100 → sellers capping the rally.
Despite intraday volatility, close above open = continuation of bullish structure.
Candle suggests testing phase at 25k, not yet a clean breakout.
🕯️ Candle Type
A Spinning Top (bullish tilt) → indecision with buyers slightly ahead.
🛡 5 Min Intraday Chart
⚔️ Gladiator Strategy Update
ATR: 205.36
IB Range: 61.95 → Small
Market Structure: Balanced
Trade Highlight:
⏰ 10:10 AM → Long Trigger → Target Hit (R:R = 1:2)
🕵️ Range & Bias
Support Zone: 24,920 – 24,890
Resistance Zone: 25,090 – 25,100
Bias: Cautiously Bullish → Above 25k, but conviction lacking.
📌 Support & Resistance Levels
🎚️ Resistance Zones
25,030 – 25,050
25,100
25,190
25,240
🎚️ Support Zones
24,995
24,955
24,920
24,890 – 24,880
💡 Final Thoughts
Nifty is grinding higher, but intraday volatility and failed follow-throughs highlight lack of conviction. For expiry, the 25,100 ceiling is crucial. A sustained move above could trigger short-covering firepower, while below 24,930, the downside gap-filling risk reopens.
"Levels hold the key — conviction comes only when price sustains beyond them."
✏️ Disclaimer
This is my personal analysis — not investment advice. Please consult your financial advisor before trading.
NIFTY KEY LEVELS FOR 20.08.2025NIFTY KEY LEVELS FOR 20.08.2025
Sorry for the delayed post..
If the candle stays above the pivot point, it is considered a bullish bias; if it remains below, it indicates a bearish bias. Price may reverse near Resistance 1 or Support 1. If it moves further, the next potential reversal zone is near Resistance 2 or Support 2. If these levels are also broken, we can expect the trend.
If the range(R2-S2) is narrow, the market may become volatile or trend strongly. If the range is wide, the market is more likely to remain sideways
📢 Disclaimer
I am not a SEBI-registered financial adviser.
The information, views, and ideas shared here are purely for educational and informational purposes only. They are not intended as investment advice or a recommendation to buy, sell, or hold any financial instruments.
Please consult with your SEBI-registered financial advisor before making any trading or investment decisions.
Trading and investing in the stock market involves risk, and you should do your own research and analysis. You are solely responsible for any decisions made based on this research.
NIFTY KEY LEVELS FOR 19.08.2025NIFTY KEY LEVELS FOR 19.08.2025
Sorry for the delayed post..
If the candle stays above the pivot point, it is considered a bullish bias; if it remains below, it indicates a bearish bias. Price may reverse near Resistance 1 or Support 1. If it moves further, the next potential reversal zone is near Resistance 2 or Support 2. If these levels are also broken, we can expect the trend.
If the range(R2-S2) is narrow, the market may become volatile or trend strongly. If the range is wide, the market is more likely to remain sideways
📢 Disclaimer
I am not a SEBI-registered financial adviser.
The information, views, and ideas shared here are purely for educational and informational purposes only. They are not intended as investment advice or a recommendation to buy, sell, or hold any financial instruments.
Please consult with your SEBI-registered financial advisor before making any trading or investment decisions.
Trading and investing in the stock market involves risk, and you should do your own research and analysis. You are solely responsible for any decisions made based on this research.
