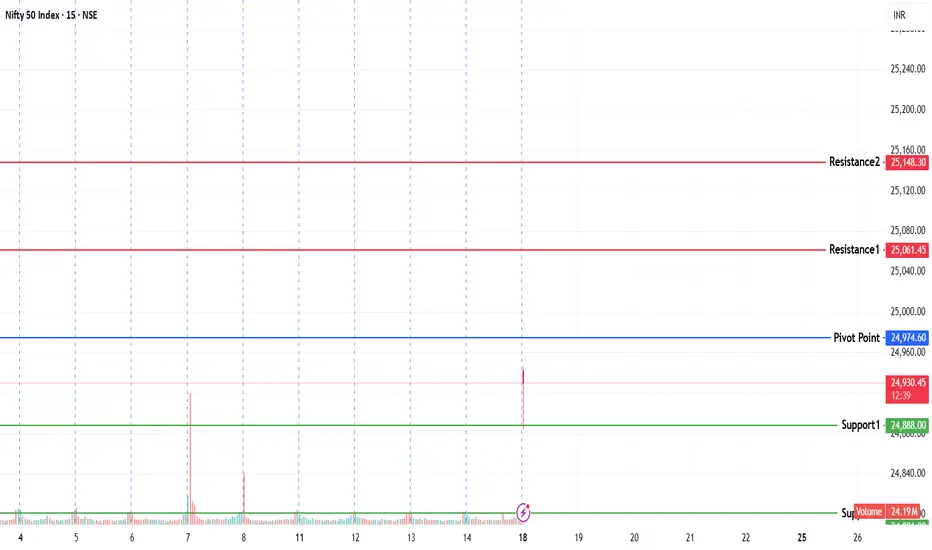
NIFTY KEY LEVELS FOR 18.08.2025NIFTY KEY LEVELS FOR 18.08.2025
If the candle stays above the pivot point, it is considered a bullish bias; if it remains below, it indicates a bearish bias. Price may reverse near Resistance 1 or Support 1. If it moves further, the next potential reversal zone is near Resistance 2 or Support 2. If these levels are also broken, we can expect the trend.
If the range(R2-S2) is narrow, the market may become volatile or trend strongly. If the range is wide, the market is more likely to remain sideways
📢 Disclaimer
I am not a SEBI-registered financial adviser.
The information, views, and ideas shared here are purely for educational and informational purposes only. They are not intended as investment advice or a recommendation to buy, sell, or hold any financial instruments.
Please consult with your SEBI-registered financial advisor before making any trading or investment decisions.
Trading and investing in the stock market involves risk, and you should do your own research and analysis. You are solely responsible for any decisions made based on this research.
Niftytradesetup
GST Reforms + Cooling Inflation: Can Nifty Aim for 25,800..?🚀 Nifty 50: Breakout + Big Policy Boost ?
📉 Technical View
Nifty 50 has broken out of its downward channel and is testing higher levels.
* Key resistance: 24,850 🔑
* If sustained & retested → next target: 25,800 🎯
This could mark the start of a fresh bullish leg if momentum holds.
📊 Macro Tailwinds
* Inflation cools off ➝ July CPI at 1.55% (lowest since June 2017) 😮
* Food inflation at -1.76%, down from -1.06% in June.
👉 Softening inflation = stronger spending power + supportive environment 📈
📰 Policy Catalyst: GST Reforms by Diwali 2025
PM Modi’s Independence Day speech highlighted “Next-Gen GST Reforms” 🇮🇳:
* 12% GST slab ➝ may shift to 5% 💡
* 28% GST slab ➝ may shift to 18% 📉
* New 40% slab for sin goods (tobacco, beer, etc.) 🚬🍺
➡️ Could lighten tax burden, stimulate consumption, and lift corporate profits.
⚡ Takeaway
Technical breakout + cooling inflation + GST reforms = constructive setup for Nifty 50.
* Watch 24,850 carefully → breakout & retest opens gates to 25,800.
📌 Note: Global risk remains. Trump’s proposed additional tariffs could hinder the trend and inject volatility 🌍⚠️.

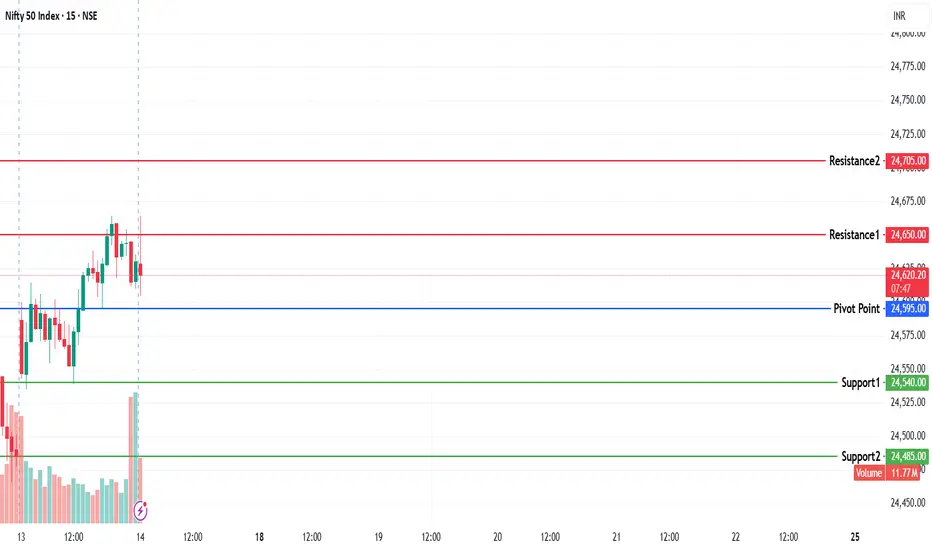
NIFTY KEY LEVELS FOR 14.08.2025NIFTY KEY LEVELS FOR 14.08.2025
If the candle stays above the pivot point, it is considered a bullish bias; if it remains below, it indicates a bearish bias. Price may reverse near Resistance 1 or Support 1. If it moves further, the next potential reversal zone is near Resistance 2 or Support 2. If these levels are also broken, we can expect the trend.
If the range(R2-S2) is narrow, the market may become volatile or trend strongly. If the range is wide, the market is more likely to remain sideways
📢 Disclaimer
I am not a SEBI-registered financial adviser.
The information, views, and ideas shared here are purely for educational and informational purposes only. They are not intended as investment advice or a recommendation to buy, sell, or hold any financial instruments.
Please consult with your SEBI-registered financial advisor before making any trading or investment decisions.
Trading and investing in the stock market involves risk, and you should do your own research and analysis. You are solely responsible for any decisions made based on this research.
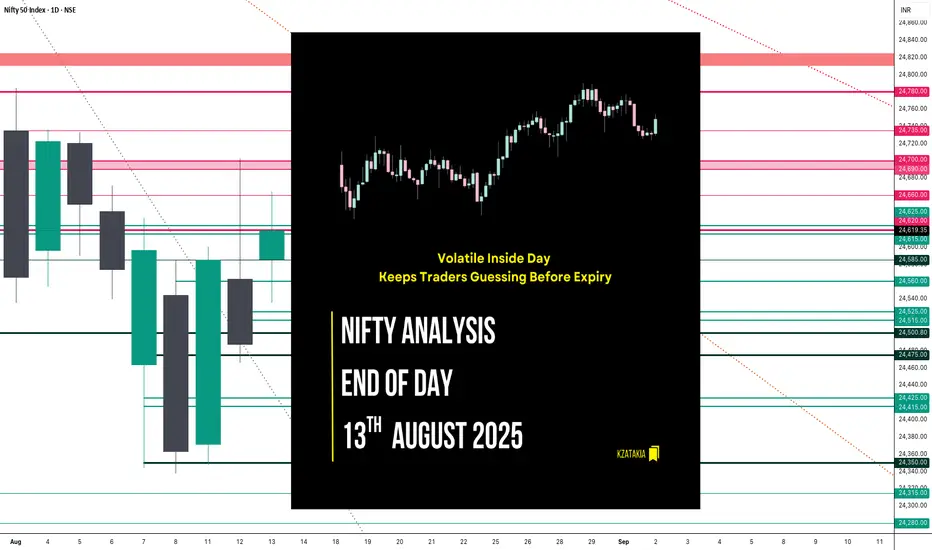
Nifty Analysis EOD – August 13, 2025 – Wednesday🟢 Nifty Analysis EOD – August 13, 2025 – Wednesday 🔴
Volatile Inside Day Keeps Traders Guessing Before Expiry
🗞 Nifty Summary
Nifty opened with a 102-point gap-up, driven by early bullish sentiment. However, the 24,600 zone acted as resistance right from the start, pushing prices down by 64 points to mark the day’s low at 24,535.25. Support emerged from the CPR zone, fueling a rebound that broke through 24,600 and set a new day high at 24,614.20, completing the Initial Balance (IB).
Once again, Nifty failed to sustain above 24,600, drifting between the IB range and VWAP. Around 12:40 PM, IB high was breached, but the index had to fight hard to stay above it. After an extended struggle to reach the previous day’s high, the index finally topped at 24,664.55, then retreated back toward the IB high before closing at 24,630.40.
Price action was highly volatile with no clear directional conviction, reflected in the long wicks on 5-minute candles. Structurally, the day remained balanced and inside the previous day’s range, forming an Inside Bar pattern on the daily chart — a setup known for potential breakout opportunities.
🛡 5 Min Intraday Chart with Levels
🎯 Tomorrow’s Game Plan
Tomorrow is weekly expiry, and my bias starts bullish:
💡 Bullish Plan:
If the market opens inside today’s range, I’ll wait for a breach and hold above 24,660 for long opportunities.
First hurdle: 24,700
Targets: 24,780 → 24,825 → 24,890
💡 Bearish Plan:
Not my primary view, but I’ll consider shorts if 24,525 ~ 24,515 breaks and sustains below.
First hurdle: 24,475 ~ 24,465
Targets: 24,425 → 24,350 → trail for deeper dips
📉 Daily Time Frame Chart with Intraday Levels
🕯 Daily Candle Breakdown
OHLC: Open 24,586.20 | High 24,664.55 | Low 24,535.25 | Close 24,619.35
Change: +131.95 (+0.54%)
Body: 33.15 points (small)
Upper Wick: 45.20 points
Lower Wick: 50.95 points
📌 Interpretation:
Small-bodied green Spinning Top → market hesitation despite a positive close.
Close above the midpoint hints at a mild recovery attempt.
Buyers need follow-through above 24,665 to build momentum; losing 24,535 could shift bias bearish.
📊 Short-Term View
Bias: Mildly bullish above 24,585
Support: 24,500 – 24,475
Resistance: 24,660 – 24,700
🛡 5 Min Intraday Chart
⚔ Gladiator Strategy Update
ATR: 212.98
IB Range: 78.95 → Medium
Market Structure: Balanced
Trade Highlight:
12:40 PM – Long Entry → SL Hit
📌 Support & Resistance Levels
📌 Resistance Zones:
24,660
24,690 ~ 24,700
24,735
24,780
📌 Support Zones:
24,585
24,560
24,525 ~ 24,515
24,500
24,475
💡 Final Thoughts
"Inside Bars before expiry can be like coiled springs — they can snap in either direction, and fast."
Patience in the morning and disciplined level play will be key tomorrow.
✏️ Disclaimer
This is my personal market view for educational purposes — not financial advice.
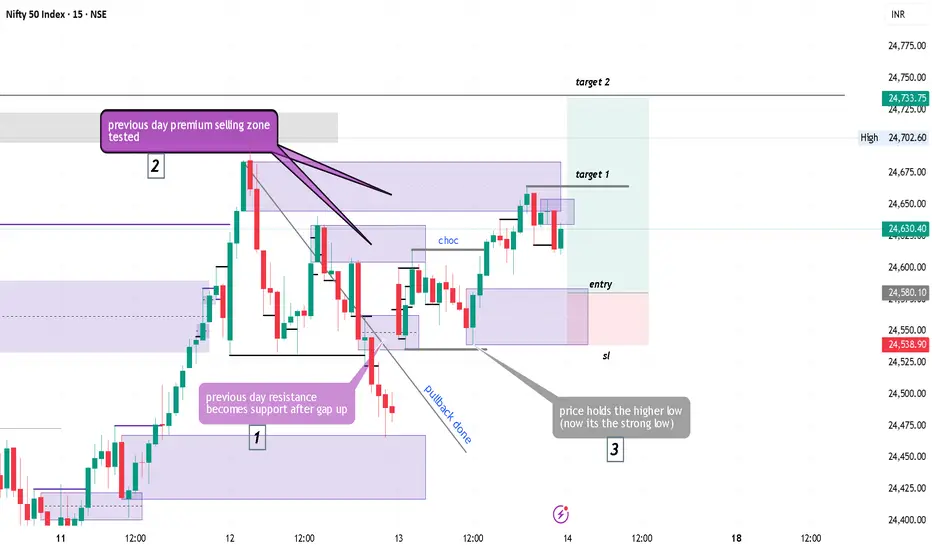
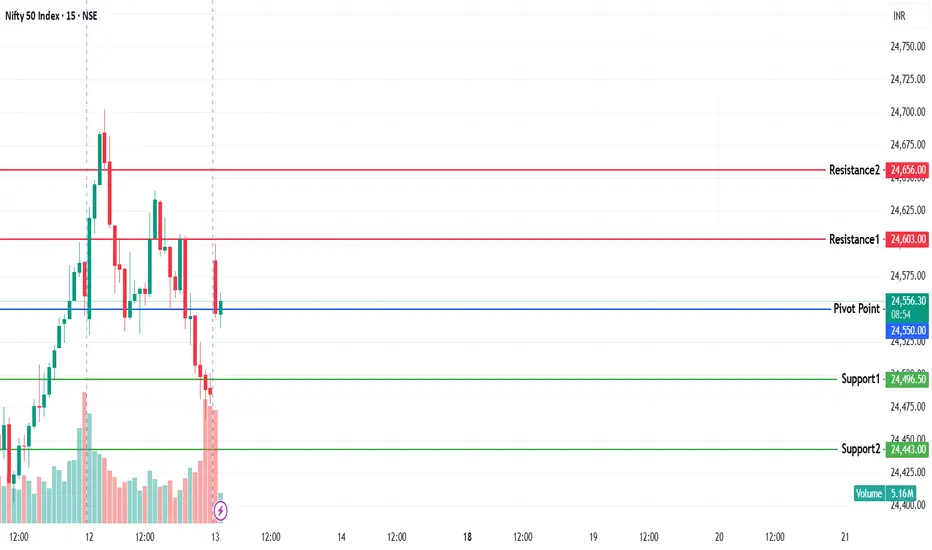
Nifty50 trade Technical Analysis for tomorrow (14 aug)As the market opened on 13 August, it gapped up above Resistance #1, directly entering the premium zone. The resistance, marked as (1), has now turned into support.
Following this, point (2) shows that the remaining supply zones were tested. However, the price did not break the day’s low of 24,538 and instead formed a swing structure favoring the long side. Based on this, our bias for tomorrow remains bullish.
Towards the close, the price tested the top supply zone on the 15-minute chart and showed signs of a pullback. This suggests that the price is likely to retrace into the new demand zone, which lies around the 24,583–24,538 area.
The strong low formed on 13 August is expected to hold. However, since the market is dynamic, it is best to wait for the price to enter the zone and reject bearish pressure before making any moves.
NIFTY KEY LEVELS FOR 13.08.2025NIFTY KEY LEVELS FOR 13.08.2025
If the candle stays above the pivot point, it is considered a bullish bias; if it remains below, it indicates a bearish bias. Price may reverse near Resistance 1 or Support 1. If it moves further, the next potential reversal zone is near Resistance 2 or Support 2. If these levels are also broken, we can expect the trend.
If the range(R2-S2) is narrow, the market may become volatile or trend strongly. If the range is wide, the market is more likely to remain sideways
📢 Disclaimer
I am not a SEBI-registered financial adviser.
The information, views, and ideas shared here are purely for educational and informational purposes only. They are not intended as investment advice or a recommendation to buy, sell, or hold any financial instruments.
Please consult with your SEBI-registered financial advisor before making any trading or investment decisions.
Trading and investing in the stock market involves risk, and you should do your own research and analysis. You are solely responsible for any decisions made based on this research.
NIFTY KEY LEVELS FOR 12.08.2025NIFTY KEY LEVELS FOR 12.08.2025
If the candle stays above the pivot point, it is considered a bullish bias; if it remains below, it indicates a bearish bias. Price may reverse near Resistance 1 or Support 1. If it moves further, the next potential reversal zone is near Resistance 2 or Support 2. If these levels are also broken, we can expect the trend.
If the range(R2-S2) is narrow, the market may become volatile or trend strongly. If the range is wide, the market is more likely to remain sideways
📢 Disclaimer
I am not a SEBI-registered financial adviser.
The information, views, and ideas shared here are purely for educational and informational purposes only. They are not intended as investment advice or a recommendation to buy, sell, or hold any financial instruments.
Please consult with your SEBI-registered financial advisor before making any trading or investment decisions.
Trading and investing in the stock market involves risk, and you should do your own research and analysis. You are solely responsible for any decisions made based on this research.

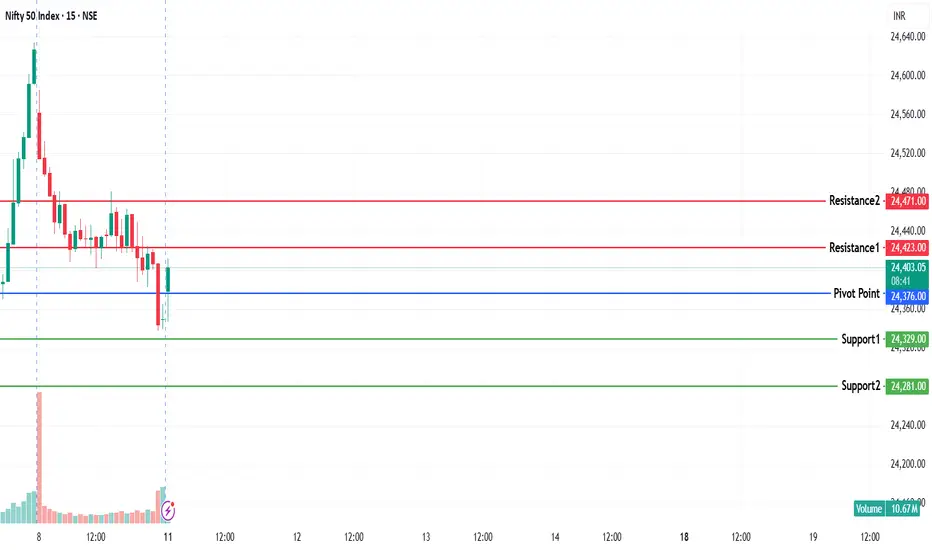
NIFTY KEY LEVELS FOR 11.08.2025NIFTY KEY LEVELS FOR 11.08.2025
If the candle stays above the pivot point, it is considered a bullish bias; if it remains below, it indicates a bearish bias. Price may reverse near Resistance 1 or Support 1. If it moves further, the next potential reversal zone is near Resistance 2 or Support 2. If these levels are also broken, we can expect the trend.
If the range(R2-S2) is narrow, the market may become volatile or trend strongly. If the range is wide, the market is more likely to remain sideways
📢 Disclaimer
I am not a SEBI-registered financial adviser.
The information, views, and ideas shared here are purely for educational and informational purposes only. They are not intended as investment advice or a recommendation to buy, sell, or hold any financial instruments.
Please consult with your SEBI-registered financial advisor before making any trading or investment decisions.
Trading and investing in the stock market involves risk, and you should do your own research and analysis. You are solely responsible for any decisions made based on this research.
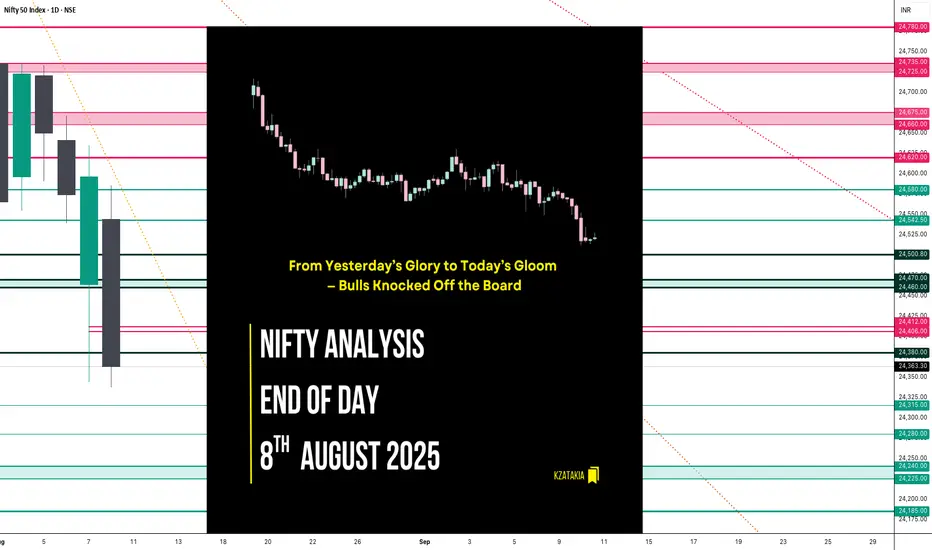
Nifty Analysis EOD – August 8, 2025 – Friday🟢 Nifty Analysis EOD – August 8, 2025 – Friday 🔴
From Yesterday’s Glory to Today’s Gloom — Bulls Knocked Off the Board
Today’s market was a textbook case of how quickly momentum can flip. Yesterday’s 289-point bullish surge was completely erased, with Nifty ending deep in the red and closing at the day’s low. Sellers clearly had the upper hand, leaving little room for bulls to breathe.
🗞 Nifty Summary
Friday opened with a 65-point gap-down — right below the crucial 24,580 support zone — and that level instantly showed rejection.
In the first 45 minutes, Nifty slipped 150 points from the day high and 200 points from the previous day high. The key Fibonacci retracement level from yesterday’s range — 24,406 ~ 24,412 — played the role of intraday savior multiple times, offering support and holding the market within a narrow zone for most of the day.
However, the bulls’ defense cracked after 3:00 PM. The support broke, triggering a sharp slide below 24,380 and even the Previous Day Low (PDL).
The upside was capped by 24,470 ~ 24,460, while 24,406 ~ 24,412 remained the battleground for most of the day until the breakdown.
In a single session, yesterday’s dramatic 289-point recovery rally was completely erased — with Nifty closing at the bottom of the PDL and CDL.
Today’s close is now below the low of 12th May, marking a 64-session (88-day) low.
Now the question for Monday: will bearish momentum extend, or will some positive news bring bulls back into play?
🛡 5 Min Intraday Chart with Levels
Intraday Walk
🔻 Gap-down open below major support at 24580.
⏳ First 45 minutes: Steep drop of 150 points from the day high.
🛡️ Fib support at 24406–24412 holds multiple times… until the late break.
🔻 Post 3 PM: Support collapse leads to fresh lows below PDL.
📉 Close near day’s low — erasing yesterday’s bullish rally.
📉 Daily Time Frame Chart with Intraday Levels
🕯 Daily Candle Breakdown
Open: 24,544.25
High: 24,585.50
Low: 24,337.50
Close: 24,363.30
Change: −232.85 (−0.95%)
Structure:
Real Body: 180.95 pts (Red Candle — Close < Open)
Upper Wick: 41.25 pts
Lower Wick: 25.80 pts
Interpretation:
Strong bearish sentiment — sellers maintained control from open to close.
Very small lower wick — indicates conviction from sellers in closing near the low.
Wiped out prior day’s gains — buyers have lost the short-term edge.
Candle Type:
Bearish Marubozu (near-full body) — signals decisive selling pressure, often a continuation pattern after weakness.
🛡 5 Min Intraday Chart
🥷 Gladiator Strategy Update
ATR: 210.45
IB Range: 134.05 → Medium
Market Structure: Balanced
Trade Summary:
10:35 AM – Short Entry → SL Hit
📌 What’s Next? / Bias Direction
Below 24,400: Bearish momentum likely to extend toward 24,250–24,200.
Above 24,470: Only a strong reclaim can shift bias back to neutral.
Gap-down/weak open on Monday may accelerate selling; bounce attempts will face resistance at 24,400–24,470.
🔍 Support & Resistance Levels
Resistance Zones:
24,406 ~ 24,412
24,460 ~ 24,470
24,500
24,580
Support Zones:
24,315
24,280
24,240 ~ 24,225
24,185
💬 Final Thoughts
"Markets don’t turn on hope — they turn on price. Respect the levels, and let price lead the story."
Bulls had the glory on Thursday, but Friday flipped the script completely. The market now sits at a multi-month low — momentum favors bears, but Monday’s open will decide if we see follow-through selling or a sharp dead-cat bounce.
✏️ Disclaimer
This is just my personal viewpoint. Always consult your financial advisor before taking any action.
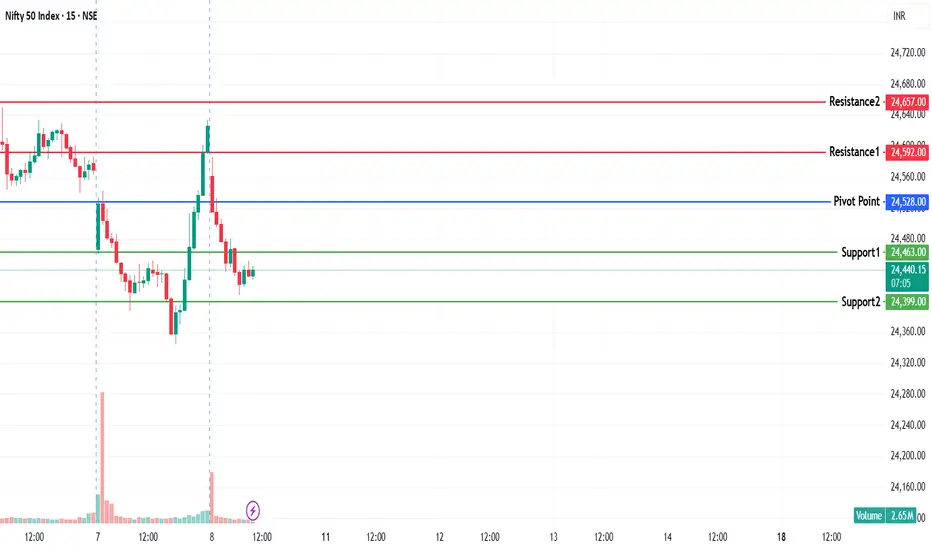
NIFTY KEY LEVELS FOR 08.08.2025NIFTY KEY LEVELS FOR 08.08.2025
Apologies for the delay in sharing this..
If the candle stays above the pivot point, it is considered a bullish bias; if it remains below, it indicates a bearish bias. Price may reverse near Resistance 1 or Support 1. If it moves further, the next potential reversal zone is near Resistance 2 or Support 2. If these levels are also broken, we can expect the trend.
If the range(R2-S2) is narrow, the market may become volatile or trend strongly. If the range is wide, the market is more likely to remain sideways
📢 Disclaimer
I am not a SEBI-registered financial adviser.
The information, views, and ideas shared here are purely for educational and informational purposes only. They are not intended as investment advice or a recommendation to buy, sell, or hold any financial instruments.
Please consult with your SEBI-registered financial advisor before making any trading or investment decisions.
Trading and investing in the stock market involves risk, and you should do your own research and analysis. You are solely responsible for any decisions made based on this research.
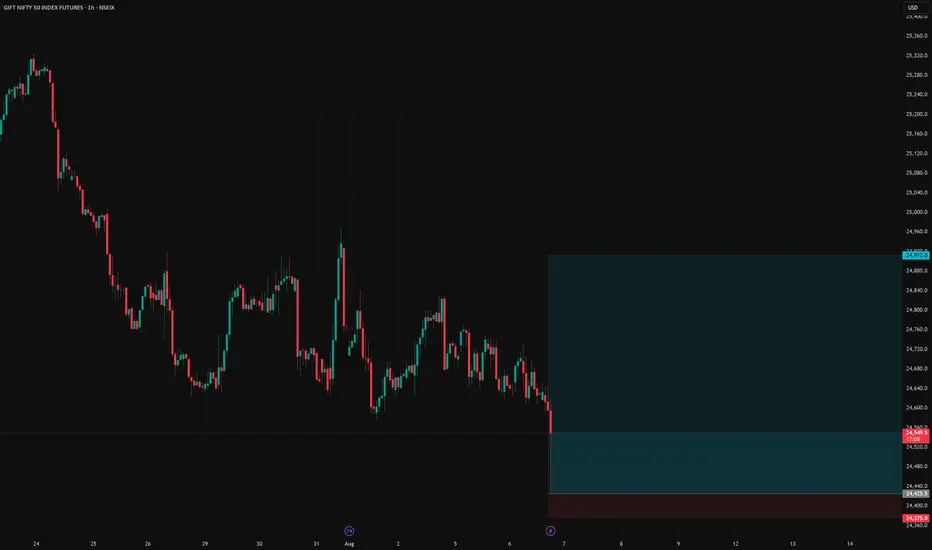
GIFT NIFTY long setupGift NIFTY long setup
Entry price - 24425.5
Stop loss - 24375
Target - 24912
Risk Reward - 1:9.6
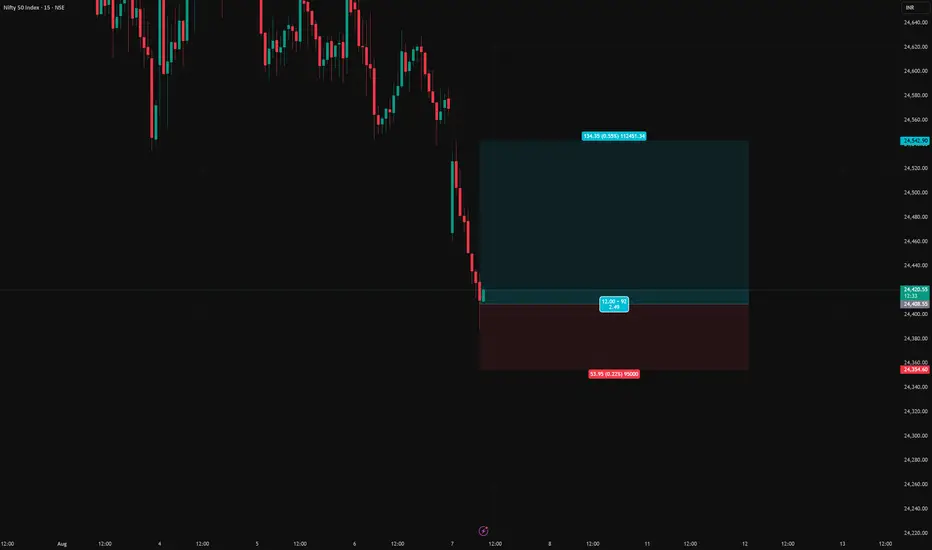
NIFTY long setupNifty long setup
Entry price - 24408.55
Stop loss - 24354.60
Target - 24542.90
Risk Reward - 1:2.5
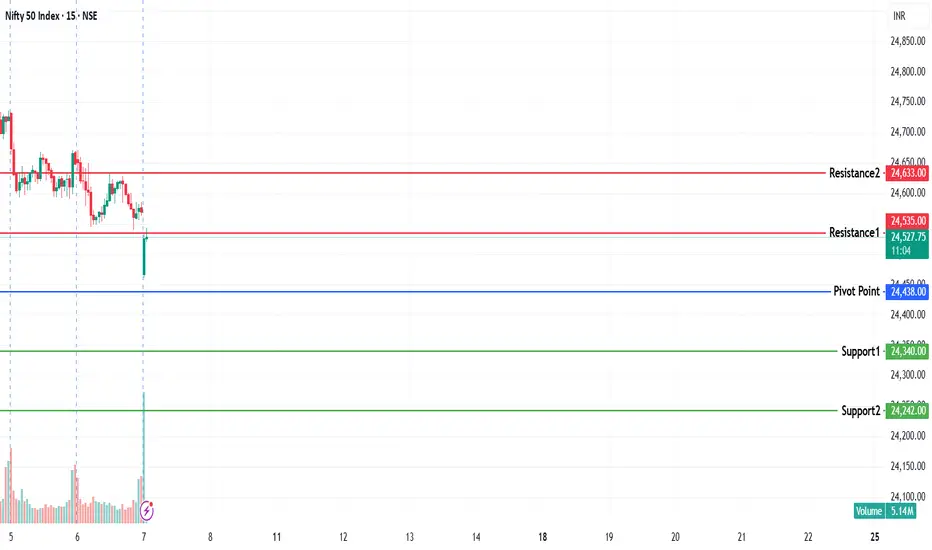
NIFTY KEY LEVELS FOR 07.08.2025NIFTY KEY LEVELS FOR 07.08.2025
If the candle stays above the pivot point, it is considered a bullish bias; if it remains below, it indicates a bearish bias. Price may reverse near Resistance 1 or Support 1. If it moves further, the next potential reversal zone is near Resistance 2 or Support 2. If these levels are also broken, we can expect the trend.
If the range(R2-S2) is narrow, the market may become volatile or trend strongly. If the range is wide, the market is more likely to remain sideways
📢 Disclaimer
I am not a SEBI-registered financial adviser.
The information, views, and ideas shared here are purely for educational and informational purposes only. They are not intended as investment advice or a recommendation to buy, sell, or hold any financial instruments.
Please consult with your SEBI-registered financial advisor before making any trading or investment decisions.
Trading and investing in the stock market involves risk, and you should do your own research and analysis. You are solely responsible for any decisions made based on this research.
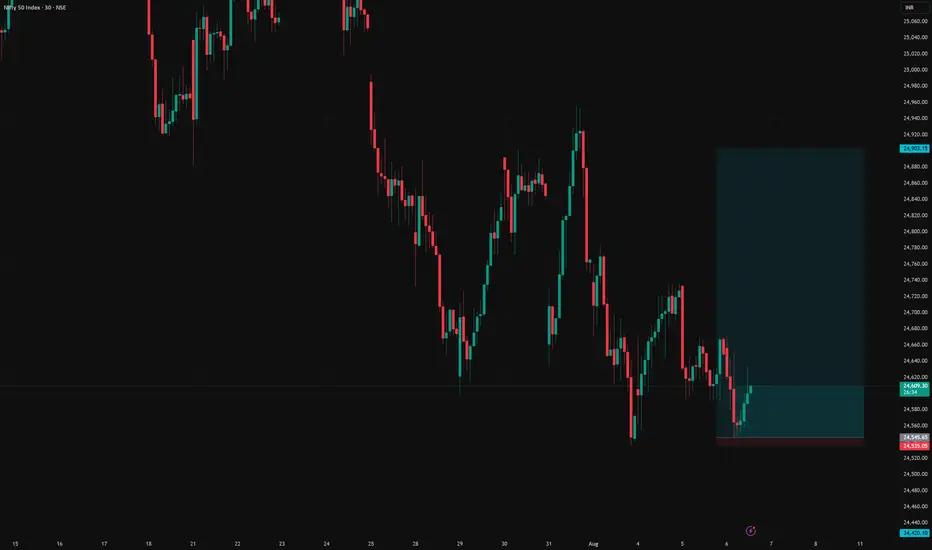
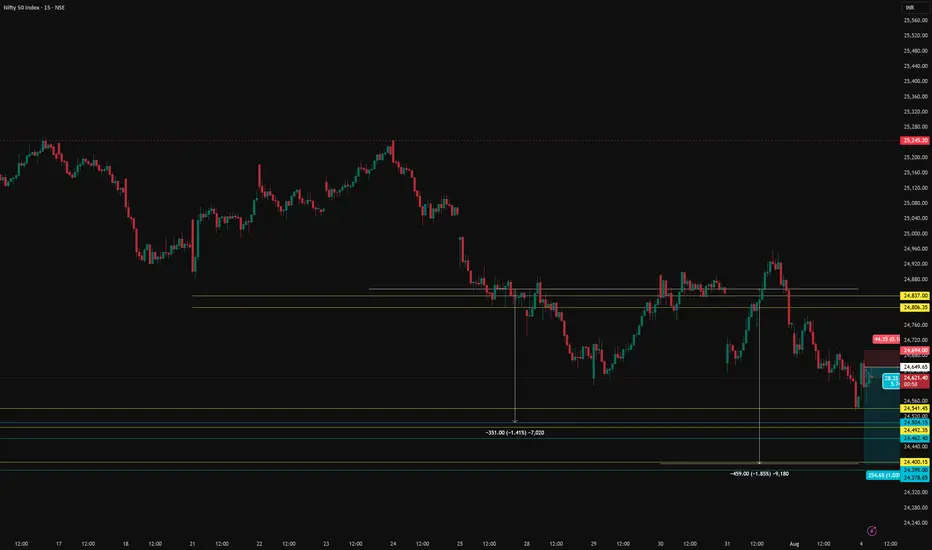
NIFTY spot long setupNifty spot long setup
Entry - 24546
Stop loss - 24535
Target - 24903
Risk Reward - 1:33
NIFTY KEY LEVELS FOR 06.08.2025NIFTY KEY LEVELS FOR 06.08.2025
If the candle stays above the pivot point, it is considered a bullish bias; if it remains below, it indicates a bearish bias. Price may reverse near Resistance 1 or Support 1. If it moves further, the next potential reversal zone is near Resistance 2 or Support 2. If these levels are also broken, we can expect the trend.
If the range(R2-S2) is narrow, the market may become volatile or trend strongly. If the range is wide, the market is more likely to remain sideways
📢 Disclaimer
I am not a SEBI-registered financial adviser.
The information, views, and ideas shared here are purely for educational and informational purposes only. They are not intended as investment advice or a recommendation to buy, sell, or hold any financial instruments.
Please consult with your SEBI-registered financial advisor before making any trading or investment decisions.
Trading and investing in the stock market involves risk, and you should do your own research and analysis. You are solely responsible for any decisions made based on this research.
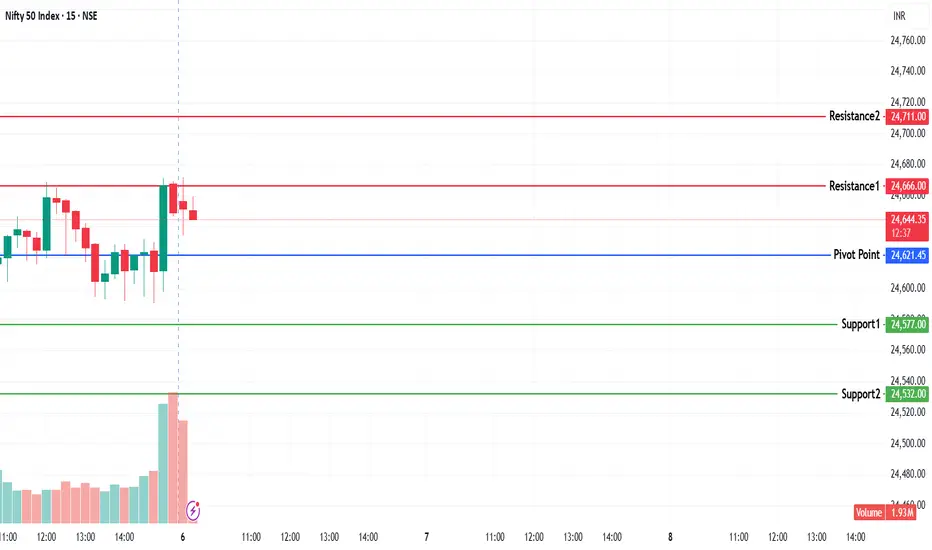
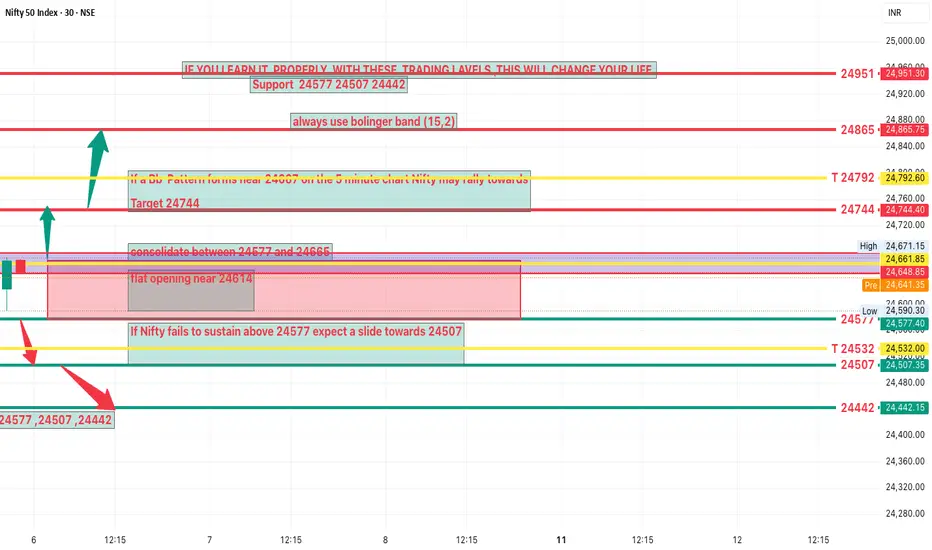
NIFTY Analysis 6 AUGUST, 2025 ,Morning update at 9 amDue to uncertainty in US tariffs on India short covering is unlikely
This global factor could lead to a flat opening near 24614
Expected Intraday Range
Likely to consolidate between 24577 and 24665
Upside Scenario
If a bb Pattern forms near 24666 on the 5 minute chart Nifty may rally towards
Target 24746
Downside Scenario
If Nifty fails to sustain above 24577 expect a slide towards
Support 24507
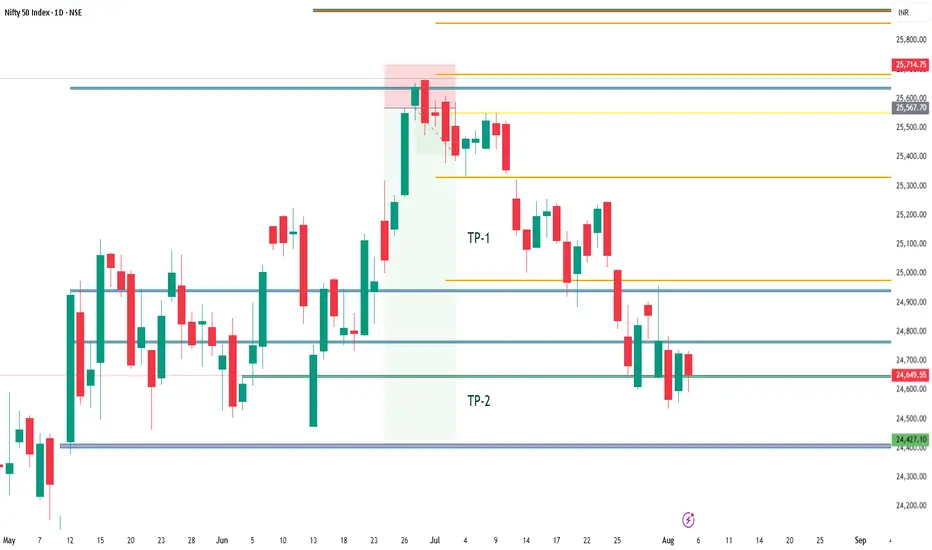
Targets achieved ni NIFTY 50 THE RESULT
Follow for more Simple And accurate swing analysis on Indices, Currency, Commodities.
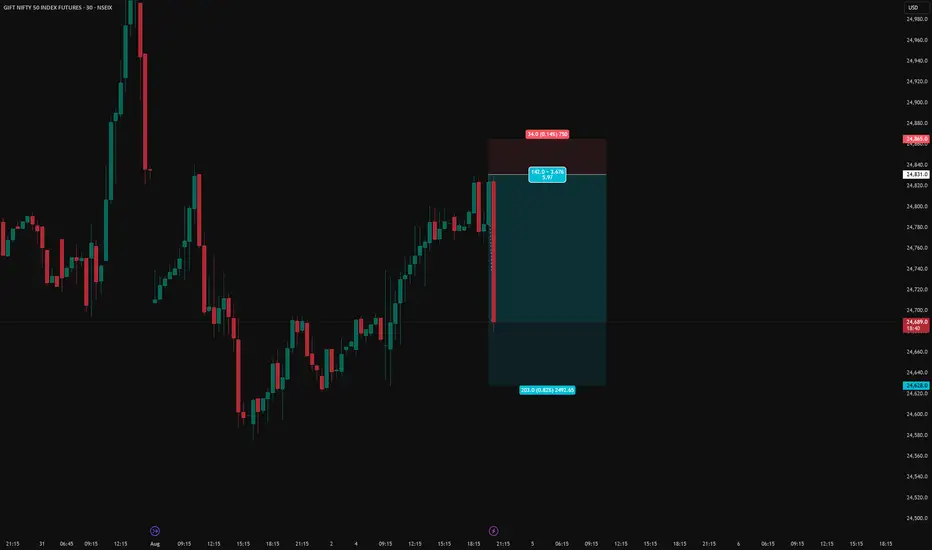
GIFT NIFTY short setupGIFT NIFTY short setup
Entry - 24831
SL - 24865
Target - 24628.0
Risk Reward - Approx 1:6
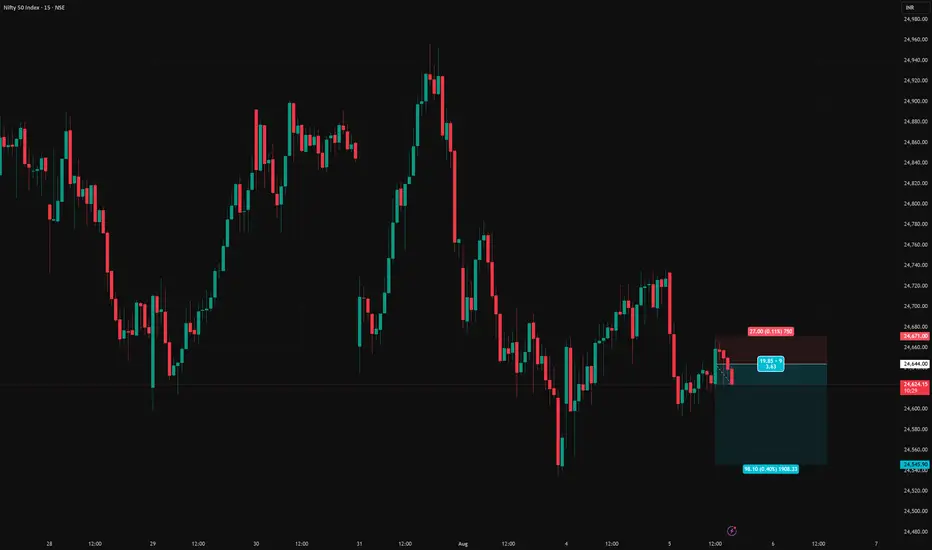
NIFTY short setupNifty short setup
Entry - 24644.00
Stop loss - 24671.00
Target - 24545.90
Risk Reward - 1:3.6
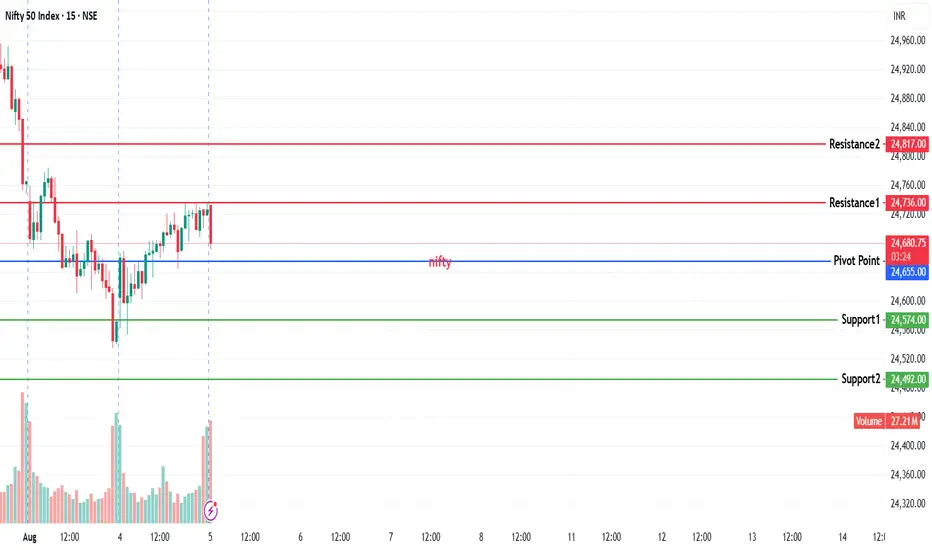
NIFTY KEY LEVELS FOR 05.08.2025NIFTY KEY LEVELS FOR 05.08.2025
If the candle stays above the pivot point, it is considered a bullish bias; if it remains below, it indicates a bearish bias. Price may reverse near Resistance 1 or Support 1. If it moves further, the next potential reversal zone is near Resistance 2 or Support 2. If these levels are also broken, we can expect the trend.
If the range(R2-S2) is narrow, the market may become volatile or trend strongly. If the range is wide, the market is more likely to remain sideways
📢 Disclaimer
I am not a SEBI-registered financial adviser.
The information, views, and ideas shared here are purely for educational and informational purposes only. They are not intended as investment advice or a recommendation to buy, sell, or hold any financial instruments.
Please consult with your SEBI-registered financial advisor before making any trading or investment decisions.
Trading and investing in the stock market involves risk, and you should do your own research and analysis. You are solely responsible for any decisions made based on this research.
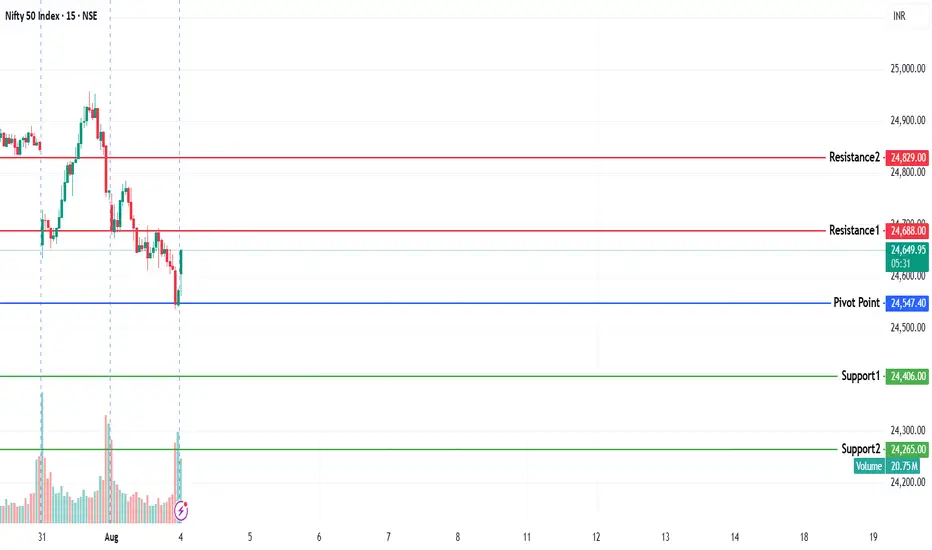
NIFTY KEY LEVELS FOR 04.08.2025NIFTY KEY LEVELS FOR 04.08.2025
If the candle stays above the pivot point, it is considered a bullish bias; if it remains below, it indicates a bearish bias. Price may reverse near Resistance 1 or Support 1. If it moves further, the next potential reversal zone is near Resistance 2 or Support 2. If these levels are also broken, we can expect the trend.
If the range(R2-S2) is narrow, the market may become volatile or trend strongly. If the range is wide, the market is more likely to remain sideways
📢 Disclaimer
I am not a SEBI-registered financial adviser.
The information, views, and ideas shared here are purely for educational and informational purposes only. They are not intended as investment advice or a recommendation to buy, sell, or hold any financial instruments.
Please consult with your SEBI-registered financial advisor before making any trading or investment decisions.
Trading and investing in the stock market involves risk, and you should do your own research and analysis. You are solely responsible for any decisions made based on this research.
Nifty : Technical levels metAs shared last week the nifty support 24510 , 24850 levels were worked as support exactly.
Now we may see sideways market and range bounded moves.
Sharing fresh levels:
Support : 24460
Resistance: 24660, 24850
