USDNOK: Short on the 4H Lower High.The pair has made a Lower High on the 4H Channel Down. With 1D a Channel Down also on bearish stochastics (STOCH = 35.614, STOCHRSI = 35.614) it is more likely to get a decline now towards a Lower Low. Based on the -1.40% metric, we have a short TP = 8.52100.
** If you like our free content follow our profile (www.tradingview.com) to get more daily ideas. **
Comments and likes are greatly appreciated.
NOK

BULLISH INDICATORS! BUYERIC looks like it's ready to run!
On the daily chart, if the stock price can break above $8.90, it should hit $10 to $12
Every indicator on the daily chart is BULLISH
As for the Weekly Chart goes...
Every indicator on the Weekly is BULLISH
POSITION: 500,000 SHARES
COST: $8.50

USDNOK. Oil weakness would hurt NOK.The NOK could have finished it's flat correction.
Oil is set to weaken again and it would hurt krona.
Minimum target is at the previous top 8.99

GBPNOK: Long on Channel Up buy signal.The price is trading inside a 1D Channel Up, which has recently priced its Higher Low (RSI = 54.649, MACD = 0.000, Highs/Lows = 0.0111). We are expecting a Higher High now, hence we are long with TP = 11.200. In case the price reverses to test the support we will open an additional long at 10.800.
** If you like our free content follow our profile (www.tradingview.com) to get more daily ideas. **
Comments and likes are greatly appreciated.

CADNOK: Sell opportunity on a Channel Down.The pair has been trading within a 1D Channel Down pattern (MACD = -0.003, ADX = 20.845, B/BP = -0.0351) with the neutral RSI, Highs/Lows indicating that it is near a Lower High level, hence an optimal short spot. As seen on the chart the High - Low sequence has been fairly straight forward and although it may hit 6.4600 again, the current level offers a respectable R/R sell opportunity with TP = 6.3040.
** If you like our free content follow our profile (www.tradingview.com) to get more daily ideas. **
Comments and likes are greatly appreciated.


USDNOK: Approaching a bottom. Strong buy opportunity.The pair has been trading within a long term 1W Channel Up (RSI = 55.524, MACD = 0.145) since last April and according to its neutral Highs/Lows (0.0000), it is near a Higher Low. Based on the Higher Highs/ Higher Lows measurements, the next Higher High is projected on a +6.50% rise at 9.0000. We are going long setting however a more modest TP at 8.82250 (practically the latest Higher High).
** If you like our free content follow our profile (www.tradingview.com) to get more daily ideas. **
Comments and likes are greatly appreciated.


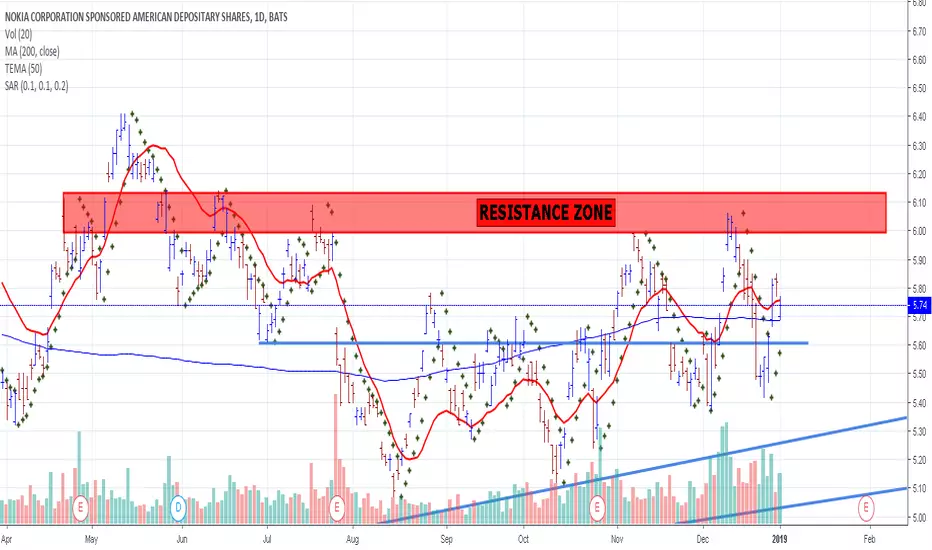
NYSE:NOK NOKIA daily chart could be a good run NYSE:NOK price is above MA200 and I pay attention if is approaching resistance zone .
Resistance zone it is a TA point of view and I can say it is psychological level as well and it is proved that can influence price direction depends of circumstances .
NOK.nyse NOKIA as a long term investment Nokia is coming with new phones and improved ones in 2019 plus new deals around the glob as we can find info around the net on financial news channels.
From a price point of view I think is a good buy for long time holding as investment plus has a good dividend .
The price is under SMA 200 on weekly chart.
Please feel free to comment with new ideas or critics .
Thank you .

Nokia could drop lower after temporary relief from triangleThe breakdown below wave D of 5.07 is needed for confirmation.
It could be a 78.6%-100% retracement and even beyond of a previous move to the upside in Y2012-2014.

USDNOK - double top short correctionAfter key risk-event (Norges Bank rate decision) technicals can take over the field at USDNOK cross. NOK is among most undervalued ccys based on trade-weighted fair value models + it seems crude oil is stabilising. From the USD side eco data came in weaker, that might push Fed to take a softer stance on future rate hikes.


Extremely Bullish Set-up For NOKIAExtremely Bullish Set-up For NOK - Needs to Breakout & Retest To Be In Play: 2019 YE Target 8.5€ / 2020 Target 23€ (!!)


NOKJPY: Channel Down approaching the 1W support. Cautious sell.The pair is trading within a 1D Channel Down (RSI = 44.336, MACD = -0.054, B/BP = -0.047) and it has recently priced its Lower High (Highs/Lows = 0.0000). The downside potential for a Lower Low is strong but attention is need as it may be limited by the existence of the 1W support at 12.9720. We are therefore selling for limited profit with TP = 13.1060 (previous Lower Low).
** If you like our free content follow our profile (www.tradingview.com) to get more daily ideas. **
Comments and likes are greatly appreciated.


#WTI #USOIL #USDNOK - Are you looking at this? Watching ThisLooking at the charts, I can see an opportunity to go #long #WTI #USOIL and if you wish #short #USDNOK, these markets have a correlation (not tick for tick), but you could do a play on a weakening dollar, NOK is typically oil pegged currency, it's very volatile, but you can reap rewards IF traded correctly. I am looking for a short-term bounce in #Oil and an opportunity to sell on the rally, in the meantime I am waiting for a break of 52.60 to initiate long to target the $60-$62.

USD/NOK 1H Chart: Previous forecast at workThe previous forecast worked, and the USD/NOK currency pair has reached the resistance cluster formed by the monthly R1 and the weekly R2 in the 8.5565/8.5889 range.
Currently, the pair is testing given resistance. Given that the exchange rate is being supported by the 55-, 100– and 200-hour SMAs, it is expected that the rate goes upwards to the upper boundary of a long-term ascending channel located circa the 8.7500 mark. Technical indicators for both short and long runs also support bullish scenario.
It is the unlikely case that some bearish pressure still prevails in the market, the US Dollar should not exceed the 200-hour SMA, which is currently located at 8.5056.

USD NOK Bearish Shark Pattern and Double TopShort position can be try with stop loss above the double top.
Stop loss and targets mentioned in graph.

USD NOK Bearish Bat FormationThere is a bearish bat formation. Entry price, targets and stop price mentioned in graph.

GBPNOK: Long term short.GBPNOK is trading within a long term 1W Channel Down and has just made a Lower High. With 1M neutral on RSI = 51.074, CCI = 29.2202 and Highs/Lows = 0.0000, the price is on the most optimal levels to short on the long run. TP = 10.56170 & 10.4500 in extension.

USD NOK SELL (DOLLAR – NORWEGIAN KRONE)Hi there. Price is forming a continuation pattern to the downside. Wait for the price to hit the top of the pattern and watch strong price action for sell.
