NQ 100 point calloutTradingview atleast for me doesnt allow me to show the small time frames 1-5m where I have all my markings but the reversal was pretty easy and clear to spot. Your IHS into your bull flag with your rounded bottom.
Nq!!

#GBPUSD Quickscalp📌 Market Insight: {#GBPUSD }
⚠️ Risk Assessment: {High}
🚀 Approach:
Not a perfect market to trade at all ... but lets have it in our watchlist .
Need valid Momentum structure and just for QuickScalp .
#Ash_TheTrader #Forex #GBPJPY #MarketAnalysis #TradingSetup #RiskManagement #GOLD #Scalper #NQ #EURUSD

NQ Levels 12/92/2025 PT 25,963Pretty simple setup here. Look for your structure to combat the noise intraday and overnight. I'm long here.

Bearish Scenario on NQEyeing a bearish scenario on NQ after retracing it to 0.5 to 0.618 fib levels.
Bearish points
- Bearish Divergence on daily
- Rising wedge broken and retested
- Head n shoulder forming
Just waiting on breaking 24000 level to take a legendary short. And I beleive it should retrace back to atleast 0.5 fib level which is close to 21430.
Let's see....
Currently it seems it is going to pump from here to make a LH and then drop from there since it's oversold on Daily timeframe.
Please share your thoughts.

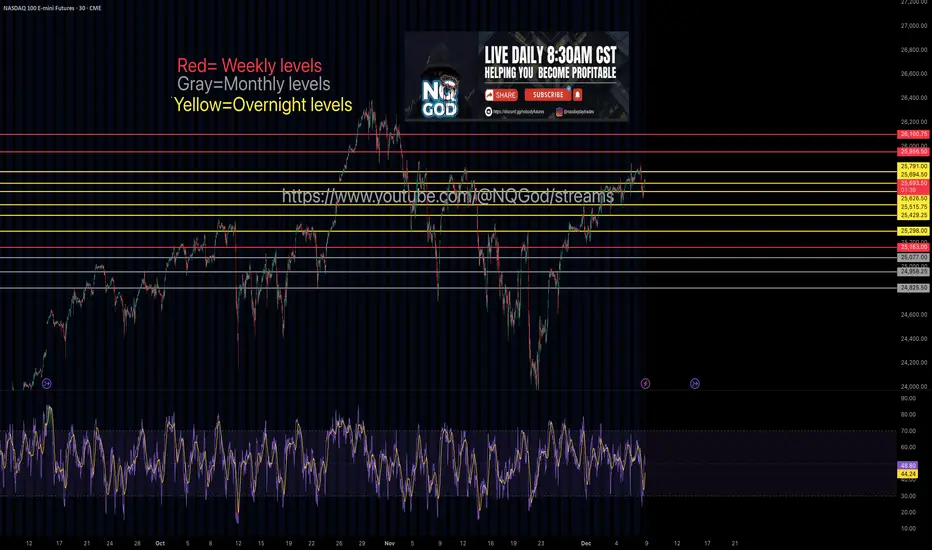
NQ Weekly, monthyl, Overnight levels from a Funded traderPing me with any quetions pretty straight forward levels here
Nasdaq nearing critical balanceIn November, we observed a Hagopian pattern - the market failed to reach the centerline despite the high probability of doing so (see weekly chart left). MACD-V is in divergence since then. A sign to be especially cautious.
This led to the current rally lasting more than ten days without a single close below a prior low. It seems the Plunge Protection Team may be at work.
In any case, we are now approaching the yellow centerline, the market’s point of balance. From there, the market will determine whether we push once more above the yellow centerline toward the white U-MLH, or turn downward, producing a second Hagopian and falling back toward the white centerline.
If the second scenario unfolds, the path toward significantly lower prices would be wide open.
Let’s see what we get for Christmas…

QuickScalp on #USDJPY📌 Market Insight: {#USDJPY }
⚠️ Risk Assessment: {High}
🚀 Approach:
Not a Quality Setup ... Need VALID Momentum Structure .
As its NO NEWS day better to just chill .....
#Ash_TheTrader #Forex #GBPJPY #MarketAnalysis #TradingSetup #RiskManagement #GOLD #Scalper #NQ #EURUSD

Weekly US Market Outlook – SPY, QQQ, DXY, VIX (30 NOV)Weekly US Market Outlook – SPY, QQQ, DXY, VIX
Bullet points:
Market sentiment turned bullish again as the probability of a December Fed rate cut climbed to 87%.
Fear & Greed Index recovered from extreme fear (9) to 24.
Options sentiment still signals extreme fear → room for upside continuation.
DXY remains bearish until 99, supporting risk assets.
VIX continues to decline toward 15.70–14.20, but these levels historically precede sharp corrections.
Heavy data week ahead (ADP, Jobless Claims, PCE) → major volatility drivers.
SPY targets 690 → 700 zone; QQQ targets 625 → 637 → 647.5.
Market Sentiment
Market sentiment has shifted decisively toward a bullish stance after the probability of a December rate cut surged back to 86%. Markets are now pricing in one more cut before 2026, creating a supportive macro backdrop for equities. At the same time, the Fear & Greed Index has rebounded from extreme fear levels of 9 to 24, indicating a slow but clear improvement in risk appetite.
Stronger than expected earnings from NVDA continue to reinforce the narrative that the AI cycle is intact and far from bubble conditions. Additionally, easing geopolitical tensions specifically the US–China trade agreement have reduced risk premia across global markets. Taken together, these developments support a short to mid term bullish environment and increase the likelihood of a Santa Rally.
Options Sentiment
Despite improving market sentiment, options markets remain deeply positioned in the extreme fear zone. This divergence between spot indices and options positioning typically suggests that market participants remain hedged or underexposed, allowing equities to extend higher as positioning normalizes. In other words, options sentiment indicates there is still significant room for markets to explore higher price levels.
DXY – US Dollar Index
Monitoring the DXY is essential because of its direct correlation with risk assets. A rising dollar weighs on equities, while a declining dollar supports them. The DXY was rejected at the 100.30 level and is now retracing toward the HTF Key Zone, highlighted around 99.
My base case is a move down into the 99 region, followed by short term accumulation and a potential bounce back above this level. Until DXY reaches 99, the trend remains bearish, which historically provides strong support for equities, commodities, and other USD sensitive assets.
VIX – Volatility Index
VIX, which reflects S&P 500 options based volatility expectations, has been declining since the November 21 peak, which aligned with the recent local bottom in the S&P 500. I expect VIX to continue trending lower toward 15.70 and potentially 14.20 levels previously associated with S&P 500 all time highs.
However, it is crucial to note that when VIX reaches these zones, markets often experience rapid and unexpected corrections. Therefore, while volatility compression favors short-term bullish continuation, the risk of a sharp reversal increases as VIX approaches these historically significant thresholds.
Upcoming Data Releases
A high-impact macro week is ahead, especially between Wednesday and Friday. The key releases include:
ISM Manufacturing PMI – Monday
JOLTS Job Openings – Tuesday
ADP Nonfarm Employment – Wednesday
Services PMI – Wednesday
ISM Non-Manufacturing PMI – Wednesday
Initial Jobless Claims – Thursday
PCE Inflation (September, delayed) – Friday
Michigan Consumer Sentiment – Friday
The most influential dataset will be the combination of ADP Employment, Initial Jobless Claims, and PCE Inflation. If labor data comes in stronger than expected, the Fed may interpret it as a sign of a resilient labor market reducing the need for additional cuts. Conversely, if PCE inflation comes in hotter than expected, policymakers may see it as a reason to delay cuts.
Given that this PCE print is delayed due to the U.S. government shutdown, the market reaction may be muted, but it still matters for the December policy narrative.
SPY Weekly Outlook – Prediction
In my opinion, SPY is positioned to target new all time highs early in the week. Price may first test 686, followed by a brief retracement or consolidation, and then continue higher toward 690, marking a fresh ATH. Under strong bullish momentum, SPY may extend into the 700 zone by the end of the week. These levels represent the primary upside targets I will be monitoring closely.
QQQ Weekly Outlook – Prediction
QQQ remains structurally weaker than SPY, yet it also maintains strong bullish momentum. The 617 level is a key zone for potential call entries. Price may initially target 625, where a short term rejection could occur, followed by a small pullback. Afterward, QQQ could advance toward its all time high at 637, and in a stronger continuation scenario, possibly extend to 647.5.
Conclusion
Overall, market conditions have turned constructive again. Sentiment is stabilizing, central bank expectations are supportive, volatility is compressing, and the dollar remains weak all providing a tailwind for equities. This week’s heavy macro calendar may bring volatility spikes, but unless data significantly challenges the rate cut narrative, both SPY and QQQ appear positioned to continue their upward trajectory toward new highs.
⚠️ This analysis is for educational purposes only and does not constitute financial advice. Always conduct your own research before trading or investing.

QuickScalp on #CHFJPY📌 Market Insight: {#CHFJPY }
⚠️ Risk Assessment: {High}
🚀 Approach:
Not a Quality Setup ... Need VALID LTF entry Sign first ! ... NO RUSH... Its friday i rather to have NO trade than have a RISKY trade .
#Ash_TheTrader #Forex #GBPJPY #MarketAnalysis #TradingSetup #RiskManagement #GOLD #Scalper #NQ #EURUSD
QuickScalp on #EURUSD 📌 Market Insight: {#EURUSD }
⚠️ Risk Assessment: {High}
🚀 Approach:
Need a valid Momentum Structure , a nice one
better to have LTF entry sign first
#Ash_TheTrader #Forex #GBPJPY #MarketAnalysis #TradingSetup #RiskManagement #GOLD #Scalper #NQ #EURUSD

a HighRisk QuickScalp on #USDJPY📌 Market Insight: {#USDJPY }
⚠️ Risk Assessment: {High}
🚀 Approach:
Not a Quality setup right now ... and need a valid LTF entry . without it , should skip this setup ... NO RUSH
#Ash_TheTrader #Forex #GBPJPY #MarketAnalysis #TradingSetup #RiskManagement #GOLD #Scalper #NQ #EURUSD

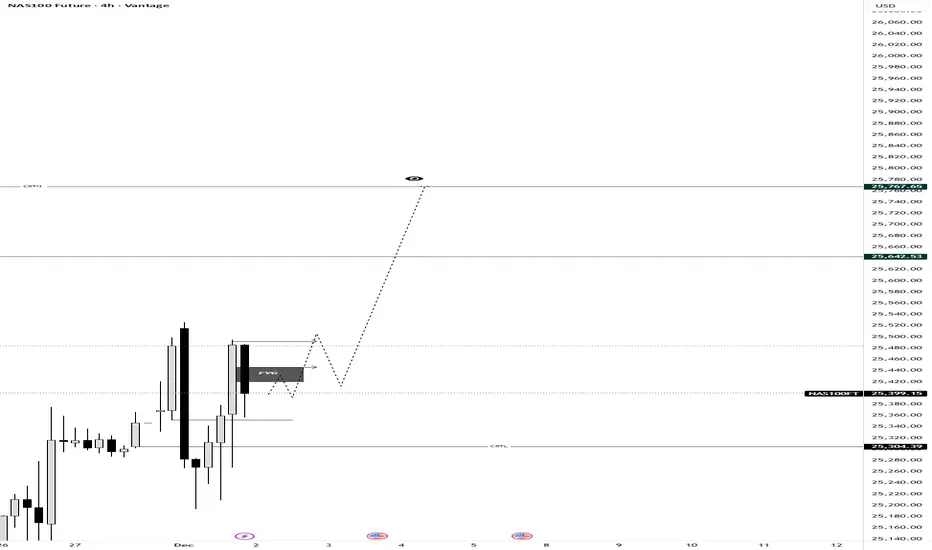
NAS100 Decoded: The Anatomy of a CRT SetupMost traders see random candles; we see a structured story. On this 4H NAS100 chart, we are witnessing a textbook example of Candle Range Theory (CRT) in motion.
If you understand the "Three-Phase Engine" inside every candle, the next move becomes clear.
The 3-Step Logic Behind This Setup:
The Purge (Accumulation): Notice how price dipped to sweep the CRTL (Candle Range Theory Low). This wasn't a random breakdown; it was a Purge Phase designed to grab liquidity and trap retail shorts. By sweeping the low (PL), the market collects the necessary fuel for the reversal.
The Mitigation (The Current Trap): Price has reclaimed the range and is currently mitigating within the FVG (Fair Value Gap). In CRT, this is the Mitigation Phase, where price returns to balance or "Equilibrium" (EQ) to fill imbalances before the real move begins. This phase often confuses traders, but it is simply smart money rebalancing positions.
The Expansion (The Delivery): With the internal liquidity harvested and the imbalance filled, the logic dictates a move toward the CRTH (Candle Range Theory High). This is our Expansion Phase, targeting the "Expansion Level" (EL). The "eye" icon on the chart represents the Draw on Liquidity (DOL)—the magnetic attraction pulling price toward the liquidity pools resting above the highs.
💡 The Lesson: Don't chase the red candles during the purge. Wait for the mitigation. As the theory states:
"The Purge phase creates the opportunity, the Mitigation phase provides the entry, and the Expansion phase delivers the profit".
Are you watching this FVG hold, or are you waiting for a break of structure confirmation? Let me know in the comments! 👇
Greetings,
MrYounity
a Risky QuickScalp on #EURUSD📌 Market Insight: {#EURUSD }
⚠️ Risk Assessment: {High}
🚀 Approach:
Not a Quality setup and market seems need time be sorted out .
We can have it as a Quickscalp by a nice valid momentum Structure .
#Ash_TheTrader #Forex #GBPJPY #MarketAnalysis #TradingSetup #RiskManagement #GOLD #Scalper #NQ #EURUSD

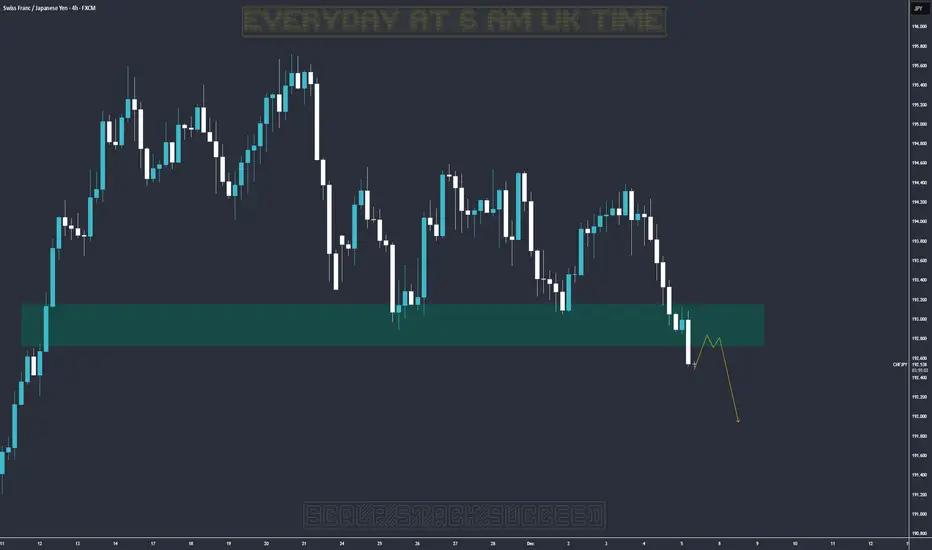
#CHFJPY , Lets give her a chance !!📌 Market Insight: {#CHFJPY }
⚠️ Risk Assessment: {High}
🚀 Approach:
Not a fan of these kinda pair ... but lets see
with a nice momentum structure we can take it as a QuickScalp .
#Ash_TheTrader #Forex #GBPJPY #MarketAnalysis #TradingSetup #RiskManagement #GOLD #Scalper #NQ #EURUSD

Weekly QQQ (NQ-US100) Outlook - Prediction (23 NOV)Weekly QQQ (NQ-US100) Outlook - Prediction
📊 Market Sentiment
Market sentiment is driven by fear at the moment. In my opinion, we are trading inside a bearish zone. Unless we get meaningful data or positive news, I expect the market to continue declining. Core PPI will be released on Tuesday at 08:30, which could create a minor bullish reaction; however, I personally do not think this will shift the overall sentiment. PPI is not a strong catalyst for a major sentiment change, so bearish conditions are likely to remain in play.
📈 Technical Analysis
Price ran the 613 level strongly and reversed aggressively on Thursday after NVDA earnings. This move trapped the bulls and filled institutional put positions. As I mentioned on Thursday evening, a weak bounce was possible and that is exactly what occurred.
📌 Outlook – Prediction
Scenario 1 (Bearish Scenario):
I believe this scenario is more likely to play out. I expect price to retrace toward 559. If we see strong bullish momentum on Monday, I will likely become more cautious with my puts.
Scenario 2 (Bullish Scenario):
If price shows strong momentum on Monday and reprices toward 614, then I will consider buying calls around 606, targeting all-time highs afterward.
Follow me for daily SPY–QQQ updates. I will update the idea based on evolving price action.
💬 For detailed insights and broader market context, please check my Substack link in profile.
⚠️ For educational purposes only. This is not financial advice.

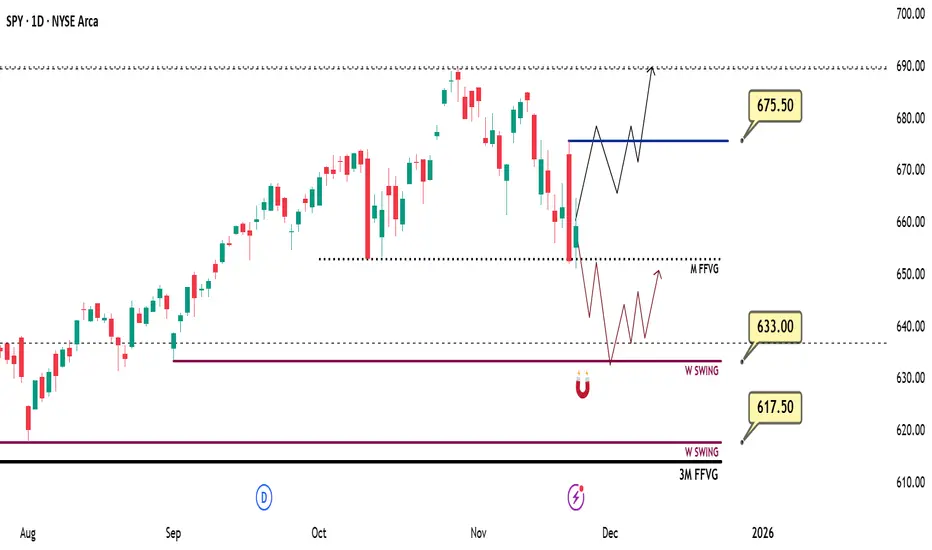
Weekly SPY (ES-US500-SPX) Outlook - Prediction (23 NOV)Weekly SPY (ES-US500-SPX) Outlook - Prediction
📊 Market Sentiment
Market sentiment is driven by fear at the moment. In my opinion, we are trading inside a bearish zone. Unless we get meaningful data or positive news, I expect the market to continue declining. Core PPI will be released on Tuesday at 08:30, which could create a small bullish reaction; however, I personally do not think this will shift overall sentiment. PPI is not a strong catalyst for a major sentiment change, so bearish conditions are likely to remain in play.
📈 Technical Analysis
Price ran 675.5, trapped the bulls, and then reversed sharply to the downside exactly as I anticipated in my previous weekly outlook. Price tapped 653 and bounced from that level, which aligned with Friday’s projection.
📌 Outlook – Prediction
Scenario 1 (Bearish Scenario):
I think this scenario is more likely early in the week. Price may retrace toward 633, which is a significant institutional liquidity pool for me. From there, price could gather energy for a higher expansion or bounce.
Scenario 2 (Bullish Scenario):
If price aggressively reprices back to 675, I will consider the bias short-term bullish. In that case, I will be buying after a retracement to 667.
Follow me for daily SPY–QQQ updates. I will update the idea based on evolving price action.
💬 For detailed insights and broader market context, please check my Substack link in profile.
⚠️ For educational purposes only. This is not financial advice.
Nasdaq Rallies into Thanksgiving, Meta Bounce Kicks InWall Street sentiment has perked up on renewed Fed cut bets, with the Nasdaq leading the way. This has allowed Facebook to finally rally from support levels I highlighted 3 weeks ago.
Matt Simpson, Market Analyst at City Index.

NQ on Major Support Target 36,490Nasdaq 100 index is on major support since September. This is the area you want to buy and as it goes up take some profits if you want for a potential check back into support around early 2027 (green path).
There's the alternative scenario (orange path) that we just trend right up to 36,490 resistance and then have a major pullback to the long term trend. This one is less likely, but possible.
Either way if you sell some of your position (like shorter term options) in the middle of the range you're likely to be in a better position than holding the entire time as eventually that lower trend should get hit and that's a lot of time decay to ruin your positions.
Good luck!

#USDJPY , Second Round ?📌 Market Insight: {#USDJPY }
⚠️ Risk Assessment: {High}
🚀 Approach:
Second Round ? ... Lets see .
Need momentum Structure .... just for QuickScalp
#Ash_TheTrader #Forex #GBPJPY #MarketAnalysis #TradingSetup #RiskManagement #GOLD #Scalper #NQ #EURUSD

XAUUSD Daily – Five-Wave Impulse Toward 4,530On the XAUUSD daily chart I’m tracking a potential five-wave advance within the existing uptrend.
Wave (1)** marks the initial impulsive leg higher from trendline support
Wave (2)** is the corrective pullback that holds above the origin of wave (1) and respects the rising trendline
Wave (3)** extends beyond the wave
(1) high, confirming continuation of the bullish structure and establishing a new swing high.
* Price is now correcting as **wave (4)** back into the area of:
* the rising trendline drawn from prior lows, and
* the former consolidation / breakout zone around the previous highs.
While price holds above the wave (4) low and the trendline, I’m anticipating a continuation leg to the upside as **wave (5)**.
The projected wave (5) objective is around 4,527, where I have a confluence of measured extension and overhead resistance.
A decisive daily close below the wave (4) low and trendline support would invalidate this wave count and delay the bullish scenario.

#EURUSD , BuySide QuickScalp ?📌 Market Insight: {#EURUSD }
⚠️ Risk Assessment: {High}
🚀 Approach:
Same as UJ , Not a perfect setup
We can take it ONLY and ONLY by LTF Entry sign ... No rush on it .
#Ash_TheTrader #Forex #GBPJPY #MarketAnalysis #TradingSetup #RiskManagement #GOLD #Scalper #NQ #EURUSD

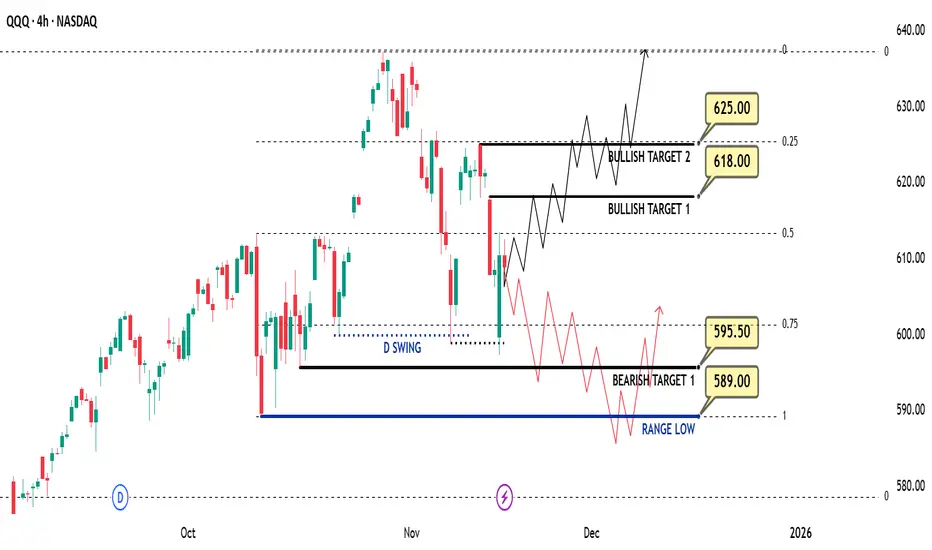
Weekly QQQ (US100-NQ) Outlook - Prediction (16 NOV)Weekly QQQ (US100-NQ) Outlook - Prediction (16 NOV)
📊 Market Sentiment
Market sentiment appears bearish right now, in my opinion. The FED may pause rate cuts in December, which has contributed to recent selling pressure and possible hedging flows. However, with the U.S. government reopening last week, we will start receiving updated economic data again. If employment data weakens and CPI comes in low or stable, it could trigger a renewed bullish momentum.
NVDA will report earnings this Wednesday after market close. I will be watching closely in my view, if NVDA were to miss expectations, QQQ and SPY could see a strong retracement. However, I think this is unlikely. I expect solid earnings growth and believe the AI cycle continues to support upside.
Additionally, U.S. Treasury Secretary Scott Bessent stated that the Trump administration aims to finalize its trade agreement with China by Thanksgiving (November 27). This could add further bullish sentiment to the market.
📈 Technical Analysis
The market showed a strong bounce on Friday after tapping the 599 level. RSI has also reset, meaning price is no longer overbought. We remain inside the weekly range, and price has reached the 0.75 max discount zone for the second time.
📌 Game Plan – Prediction
Bullish Scenario (Black Line):
I think this scenario is more likely. I want to see price close a 4H candle above 613. If that happens, I will be targeting 618 next. Price may run 618, pull back slightly, then eventually push toward 625 and potentially all-time highs around 637.
Bearish Scenario (Red Line):
If we see strong selling on Monday, I will assume price may follow the bearish path. In that case, I expect a move toward 595.5 and then the range low at 589. From there, we could see a bounce and a reclaim of 595.5.
💬For detailed insights and broader market context, please check my Substack link in profile.
⚠️ For educational purposes only. This is not financial advice.
Weekly SPY (US500-ES-SPX) Outlook - Prediction (16 NOV)Weekly SPY (US500-ES-SPX) Outlook - Prediction (16 NOV)
📊 Market Sentiment
Market sentiment appears bearish right now, in my opinion. The FED may pause rate cuts in December, which has contributed to recent selling pressure and potential hedging flows. However, with the U.S. government reopening last week, we will begin receiving updated economic data again. If employment data weakens and CPI comes in low or stable, it could support renewed bullish momentum.
NVDA will report earnings this Wednesday after market close. I will be watching closely in my view, if NVDA were to miss expectations, both QQQ and SPY could see a strong retracement. However, I think this is unlikely. I expect solid earnings growth and believe the ongoing AI cycle will continue to support upside.
Additionally, U.S. Treasury Secretary Scott Bessent stated that the Trump administration aims to finalize its trade agreement with China by Thanksgiving (November 27). This could help bring additional bullish sentiment into the market.
📈 Technical Analysis
Price retraced into the 0.75 max discount zone, ran the mid-term range low, and closed back above it creating another higher expansion bounce. On Friday, we saw a second retest of the range low followed by another strong reaction. In my opinion, price remains strong here.
📌 Game Plan – Prediction
I currently see three scenarios:
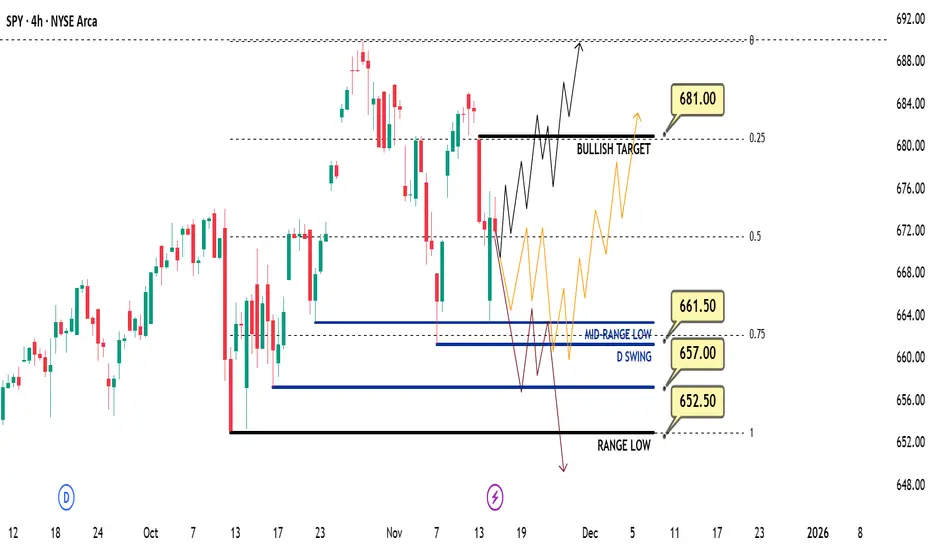
Bullish Scenario (Black Line):
I believe this is the most likely scenario. I want to see price close above 675.5 and continue expanding higher. The first bullish target is 681. After clearing 681, a small retracement may occur, followed by a potential expansion toward all-time highs around 690.
Orange Scenario:
If the market opens less bullish on Sunday night, price may run 661 to gather more liquidity and energy for a move higher. If 661 is swept and a 4H candle closes back above it, I will assume this scenario is playing out.
Bearish Scenario (Red Line):
If price breaks aggressively below 661 and closes underneath it, that would indicate the market may want to move lower. In that case, I will exit my calls and buy puts, targeting a move toward at least 562.5.
💬 For detailed insights and broader market context, please check my Substack link in profile.
⚠️ For educational purposes only. This is not financial advice.