BHARATFORG Breaking Out | Targets 1,400+BUY Setup 🔨
Entry: ₹1,300-1,305 (Current Level)
Target 1: ₹1,330-1,340
Target 2: ₹1,365-1,375
Target 3: ₹1,400+ (Extended)
Stop Loss: ₹1,275
Technical Rationale:
Strong bullish momentum with +4.56% gain today
Breaking above major descending trendline resistance (visible from June highs)
Consolidation breakout from 1,265-1,285 range
Good volume (3.45M) supporting the breakout
RSI around 65, showing strength with room for further upside
Price attempting to cross key resistance at 1,300 psychological level
Falling wedge pattern breakout - typically bullish
Auto sector strength supporting the move
Support established at 1,280 zone
Risk-Reward: Favorable 1:3 ratio
Pattern: Descending wedge breakout - classic bullish reversal pattern
Strategy: Positional trade - Book 40% at T1 (1,335), 30% at T2 (1,370), trail remaining with SL at 1,310 after T1
Key Levels:
Strong Resistance: 1,310, 1,340, 1,365
Support: 1,280, 1,265
Nse

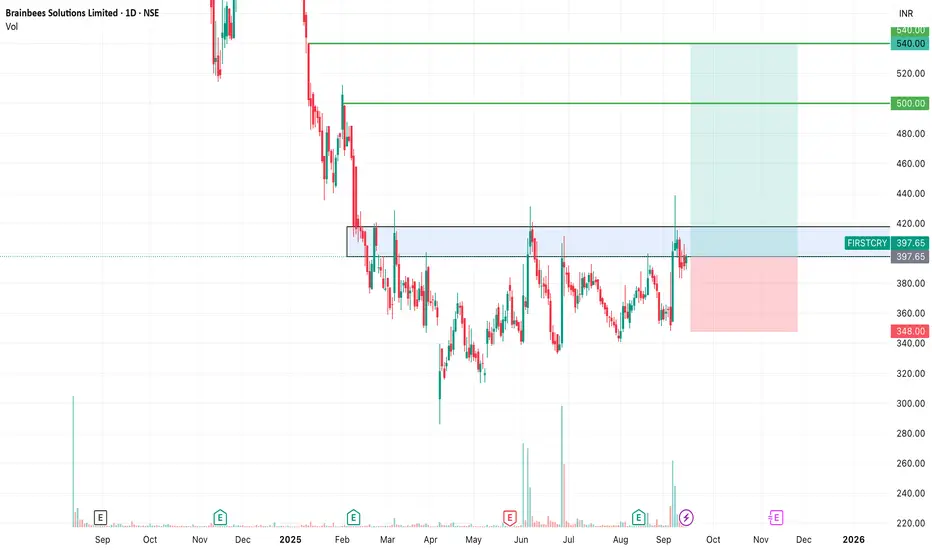
SWING IDEA - FIRSTCRY (BRAINBEES SOLUTIONS LTD)FirstCry (Brainbees Solutions) , a leading omni-channel retailer for baby and kids’ products, is showing signs of a potential breakout, presenting a strong swing trading opportunity.
Reasons are listed below :
400 resistance zone tested multiple times — now looking ready for a breakout
Attempting to break out of a 7+ month consolidation phase
Volume spikes suggest accumulation by smart money
Golden Fibonacci retracement support in play
Price action forming higher highs, confirming bullish structure
Target - 500 // 540
Stoploss - daily close below 348
DISCLAIMER -
Decisions to buy, sell, hold or trade in securities, commodities and other investments involve risk and are best made based on the advice of qualified financial professionals. Any trading in securities or other investments involves a risk of substantial losses. The practice of "Day Trading" involves particularly high risks and can cause you to lose substantial sums of money. Before undertaking any trading program, you should consult a qualified financial professional. Please consider carefully whether such trading is suitable for you in light of your financial condition and ability to bear financial risks. Under no circumstances shall we be liable for any loss or damage you or anyone else incurs as a result of any trading or investment activity that you or anyone else engages in based on any information or material you receive through TradingView or our services.
@visionary.growth.insights
SANGAM (INDIA) LTD – Volume Breakout with Bullish MomentumCMP: ₹466.6
🟢 Buy Zone: ₹460–465 (on minor pullback or consolidation)
🎯 Targets:
Target 1: ₹481
Target 2: ₹490
Target 3: ₹497
🔻 Stop Loss: ₹447 (below recent swing low)
⏳ Duration: 5–10 trading days (short-term swing setup)
SANGAM (India) Ltd has shown a strong bullish breakout above the resistance zone with a surge in volume (see chart). The RSI reversal from mid-levels confirms renewed momentum. Sustaining above ₹457 could push price towards ₹490–₹497 levels in the coming sessions. A healthy retest near ₹460–₹465 offers a low-risk entry opportunity.
Risk–Reward: 1:2.5 (Favorable for short-term swing traders)
⚠️ Disclaimer:
This analysis is for educational purposes only and not financial advice. Always do your own research before investing or trading.

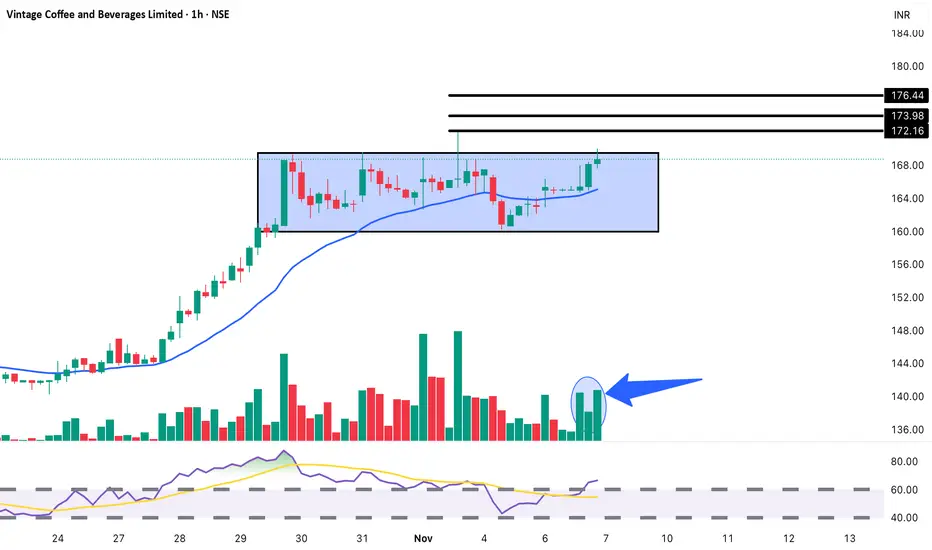
Vintage Coffee & Beverages: Rectangle Pattern Swing Trade SetupBUY Setup ☕
Entry: ₹168-169 (Current Level)
Target 1: ₹172-173
Target 2: ₹174-176
Target 3: ₹180+ (Breakout Extension)
Stop Loss: ₹164
Technical Rationale:
Rectangle consolidation pattern (160-169) visible on 1-hour chart (blue shaded zone)
Holding strong at upper range of consolidation
Volume spike highlighted (blue arrow) - showing buying interest
Strong uptrend from 144 to current levels
Trading above rising EMA - bullish trend intact
RSI trending upward around 70 - strong momentum
Small-cap F&B stock showing resilience
Volume at 1.31M - decent for 1H timeframe
Multiple resistance levels clearly marked: 172, 174, 176
Support well-established at 164-165 zone
Coiling pattern - compression before expansion
Risk-Reward: Good 1:3+ ratio
Pattern: Rectangle consolidation on 1H chart - typically a continuation pattern after strong uptrend
Strategy: Intraday to short-term swing (1-3 days)
Book 40% at T1 (172.50), 30% at T2 (175), trail remaining with SL at 169 after T1
Aggressive traders can add on break above 169.50 with volume
Key Levels:
Breakout Zone: 169-170 (upper rectangle boundary)
Strong Resistance: 172, 174, 176
Critical Support: 164, 162, 160 (rectangle base)
Timeframe: 1-hour chart - suitable for intraday/swing traders
Volume Analysis: Recent volume spike (highlighted) suggests accumulation at upper range - bullish sign
Sector: F&B/FMCG - relatively defensive sector
Note: Currently showing strength with +0.36% gain. Watch for breakout above 169.50 with volume for confirmation.
Disclaimer: For educational purposes only. Not SEBI registered.
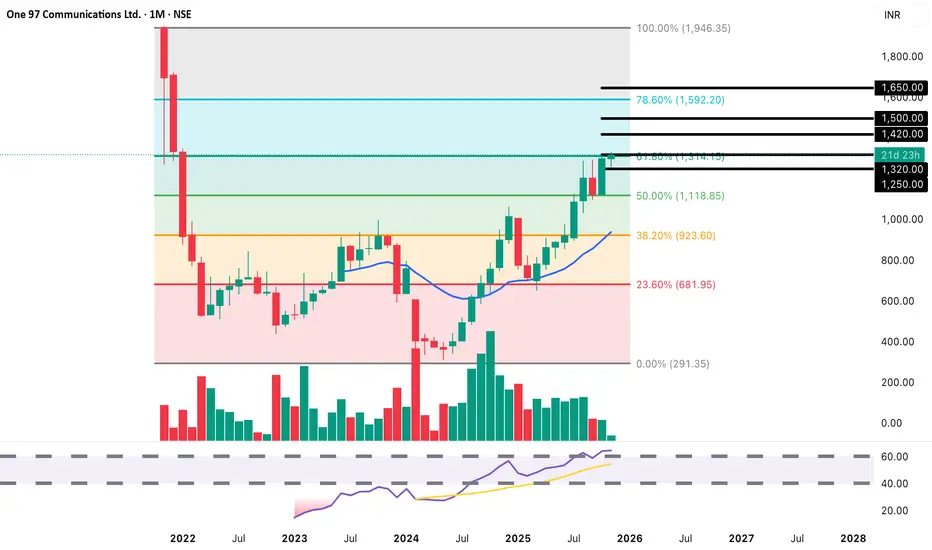
Paytm: 350% Recovery Rally! | Testing Key Fib Level BUY Setup 📱
Entry: ₹1,320-1,330 (Current Level)
Target 1: ₹1,400-1,420 (38.2% Fib)
Target 2: ₹1,500-1,550 (50% Fib)
Target 3: ₹1,650-1,700+ (Extended)
Stop Loss: ₹1,250
Technical Rationale:
MAJOR RECOVERY in progress from all-time lows around 290
Strong +1.34% gain today with exceptional volume (15.19M)
Testing critical 61.8% Fibonacci retracement level at 1,314 (marked "21d 23h")
Massive recovery rally from 290 to 1,320 = 350%+ move
Monthly chart showing strong uptrend with higher lows
RSI trending strongly upward around 60-65 zone
Breaking above multiple Fibonacci levels - bullish momentum
Volume consistently strong during recovery phase
Fintech sector regaining investor confidence
Clear support established at 1,200-1,250 zone
Next major resistance at 1,592 (78.6% Fib level)
Risk-Reward: Excellent 1:5+ ratio for extended targets
Pattern: Major recovery from bottom + Fibonacci retracement breakout on Monthly chart - extremely bullish long-term setup
Strategy: Long-term positional/investment approach
Book 20% at T1 (1,410), 20% at T2 (1,525), hold 60% for extended targets above 1,650+
Trail SL to 1,280 after crossing 1,400
This is a multi-month to year-long setup
Key Levels (Fibonacci):
Current Battle: 61.8% Fib at 1,314 (being tested now)
Next Resistance: 78.6% Fib at 1,592
Extended Targets: 1,946 (100% retracement to ATH from crash low)
Major Support: 1,118 (50% Fib), 1,000 (psychological)
Timeframe: Monthly chart - this is a long-term investment setup, not a quick trade
Historical Context:
Crashed from 1,950 to 290 (85% fall)
Now recovered 350%+ from bottom
Testing critical Fib level that often acts as last resistance before continuation
Volume: 15.19M - extremely strong for monthly timeframe, confirming institutional buying
For educational purposes only. Not SEBI registered.
Buy Cholamandalam Investment & Finance above 1707Buy above 1707.
Stop-loss: 1640.
Targets: 1745 / 1791.

Oberoi Realty Limited chart analysis: BUY SetupEntry: ₹1,687-1,695 (Current Level)
Target 1: ₹1,722-1,725
Target 2: ₹1,754-1,760
Target 3: ₹1,800+ (Extended)
Stop Loss: ₹1,650
Technical Rationale:
Massive bullish momentum with +5.35% surge today
Strong breakout from consolidation zone (1,600-1,690)
Huge volume spike (2.61M) - highest in recent months
RSI spiking above 60, indicating strong bullish momentum
Price breaking above long-term resistance at 1,680
Gap-up opening showing institutional interest
Real estate sector showing strength
Clear resistance levels at 1,722 and 1,754
Risk-Reward: Favorable 1:2.5+ ratio
Strategy: Momentum play - Book partial at Target 1 (1,722), trail SL to 1,670 at Target 2. Hold remaining for extended targets
Caution: Watch for profit booking after such strong rally. Avoid chasing if price goes significantly above 1,700

SWING IDEA - CHAMBAL FERTILIZERSChambal Fertilizers , a leading manufacturer of fertilizers and agri-products in India, is presenting a compelling swing trade setup with strong technical indicators.
Reasons are listed below :
Break of Cup and Handle Pattern : A classic bullish continuation pattern indicating potential for a significant upside.
Bullish Marubozu Candle : A strong bullish marubozu candle on the weekly timeframe highlights sustained buying pressure.
500 Zone Breakout : The price is attempting to break above the 500 resistance zone after consolidating near its all-time high, signaling strength.
Prolonged Consolidation Breakout : The stock is breaking out of a consolidation phase spanning over 3 years, suggesting a fresh trend initiation.
Target - 675
Stoploss - weekly close below 440
DISCLAIMER -
Decisions to buy, sell, hold or trade in securities, commodities and other investments involve risk and are best made based on the advice of qualified financial professionals. Any trading in securities or other investments involves a risk of substantial losses. The practice of "Day Trading" involves particularly high risks and can cause you to lose substantial sums of money. Before undertaking any trading program, you should consult a qualified financial professional. Please consider carefully whether such trading is suitable for you in light of your financial condition and ability to bear financial risks. Under no circumstances shall we be liable for any loss or damage you or anyone else incurs as a result of any trading or investment activity that you or anyone else engages in based on any information or material you receive through TradingView or our services.
@visionary.growth.insights

SWING IDEA - NEULAND LABNeuland Lab , a niche API manufacturer with strong export presence and leadership in complex molecules, is offering a technically strong swing trade opportunity from key support levels.
Reasons are listed below :
11,500 zone acting as a crucial support area
Formation of a hammer candle on the weekly timeframe, signaling potential reversal
Reversing from the 0.618 Fibonacci retracement zone – the golden pocket
Taking support at the 50-week EMA , holding long-term trend structure
Target - 14900 // 17600
Stoploss - weekly close below 10215
DISCLAIMER -
Decisions to buy, sell, hold or trade in securities, commodities and other investments involve risk and are best made based on the advice of qualified financial professionals. Any trading in securities or other investments involves a risk of substantial losses. The practice of "Day Trading" involves particularly high risks and can cause you to lose substantial sums of money. Before undertaking any trading program, you should consult a qualified financial professional. Please consider carefully whether such trading is suitable for you in light of your financial condition and ability to bear financial risks. Under no circumstances shall we be liable for any loss or damage you or anyone else incurs as a result of any trading or investment activity that you or anyone else engages in based on any information or material you receive through TradingView or our services.
@visionary.growth.insights

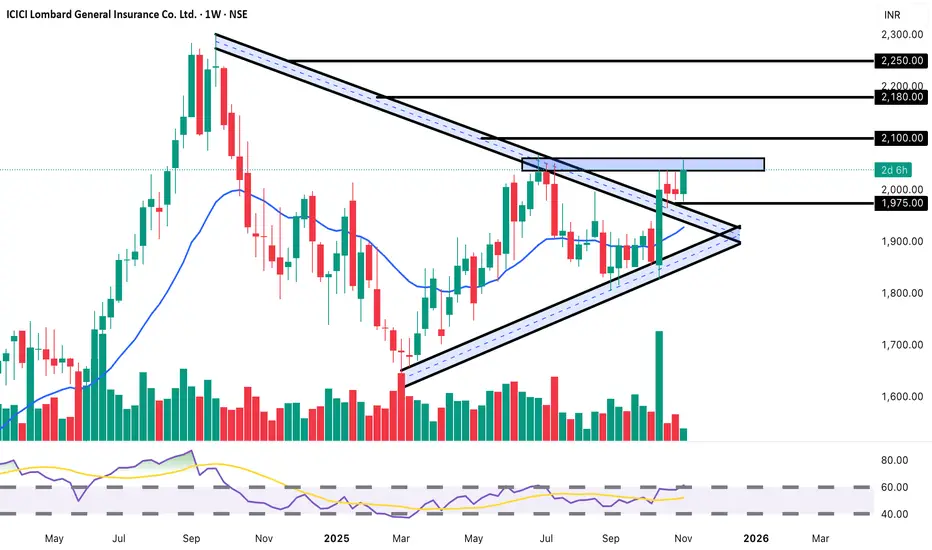
ICICIGI: Weekly Triangle Squeeze | Explosive Move Expected Soon BUY Setup 🛡️
Entry: ₹2,040-2,050 (Current Level)
Target 1: ₹2,080-2,100
Target 2: ₹2,150-2,180
Target 3: ₹2,250+ (Extended - Post Breakout)
Stop Loss: ₹1,975
Technical Rationale:
MAJOR PATTERN: Symmetrical Triangle forming on Weekly chart - apex approaching
Trading at upper boundary of triangle - breakout imminent (marked "2d 6h")
Strong +2.32% gain today showing bullish momentum
Volume at 11M - showing increased participation
Price testing critical resistance at 2,000-2,050 zone
Multiple convergence of trendlines creating decision point
RSI around 60 - neutral to bullish zone with room for upside
Trading above EMA on higher timeframes
Insurance sector showing relative strength
Triangle pattern spanning 6+ months - significant breakout potential
Support at ascending trendline around 1,975
Risk-Reward: Excellent 1:3+ ratio (much higher if triangle breaks out)
Pattern: Symmetrical Triangle on Weekly Chart - one of the most powerful continuation patterns. Breakout from 6-month consolidation could trigger massive move.
Strategy:
Conservative: Wait for weekly close above 2,060 with volume for confirmation
Aggressive: Enter now with SL below triangle support at 1,975
Book 25% at T1 (2,090), 25% at T2 (2,165), hold 50% for major breakout target 2,250-2,300
Key Levels:
CRITICAL Breakout Zone: 2,050-2,060 (triangle apex)
Strong Resistance: 2,000-2,050 (current battle zone)
Extended Targets: 2,250, 2,300+ (measured move from triangle)
Major Support: 1,975 (triangle support), 1,900
Timeframe: Weekly chart - suitable for positional/swing trading (weeks to months)
Triangle Measured Move: If breaks above 2,060, target = 2,300+ (height of triangle added to breakout point)
Volume Watch: Need strong volume on breakout for confirmation
Disclaimer: For educational purposes only. Not SEBI registered.
India Index Triad. Nifty, Bank Nifty and SensexNSE:NIFTY
NSE:BANKNIFTY
BSE:SENSEX
Covering the Draw on Nifty and the thought process behind that draw. Go ahead check it out and let me know

Gap-Up Alert: Hind Rectifiers | Rectangle Breakout ConfirmedBUY Setup ⚡
Entry: ₹1,803-1,810 (Current Level)
Target 1: ₹1,832-1,840
Target 2: ₹1,851-1,860
Target 3: ₹1,875-1,890 (Extended)
Stop Loss: ₹1,775
Technical Rationale:
Massive breakout from rectangle consolidation (1,600-1,800 range)
Explosive +5.00% surge with exceptional volume (84.66K)
Breaking above long-term resistance at 1,800 with strong conviction
RSI spiking to 69.43 - strong bullish momentum
Gap-up opening showing institutional buying interest
Trading well above EMA (1,663.41) confirming uptrend
V-shaped recovery from October lows
Power electronics/rectifier sector gaining traction
Multiple resistance levels mapped: 1,832, 1,851, 1,875
Clear support established at 1,747-1,775 zone
Volume significantly above average confirming breakout
Risk-Reward: Good 1:2.5+ ratio
Pattern: Rectangle breakout + Gap-up - powerful combination for continuation
Strategy: Short to medium-term swing - Book 35% at T1 (1,835), 35% at T2 (1,855), trail remaining with SL at 1,810 after T1
Key Levels:
Breakout Zone: 1,800 (critical level crossed)
Strong Resistance: 1,832, 1,851, 1,875
Major Support: 1,775, 1,747, 1,720
Sector Catalyst:
Power sector demand increasing
Electronics manufacturing push
Infrastructure spending
Caution: Already up 5% today - consider waiting for minor pullback to 1,790-1,795 for better entry, or enter in tranches
Disclaimer: For educational purposes only. Not SEBI registered.

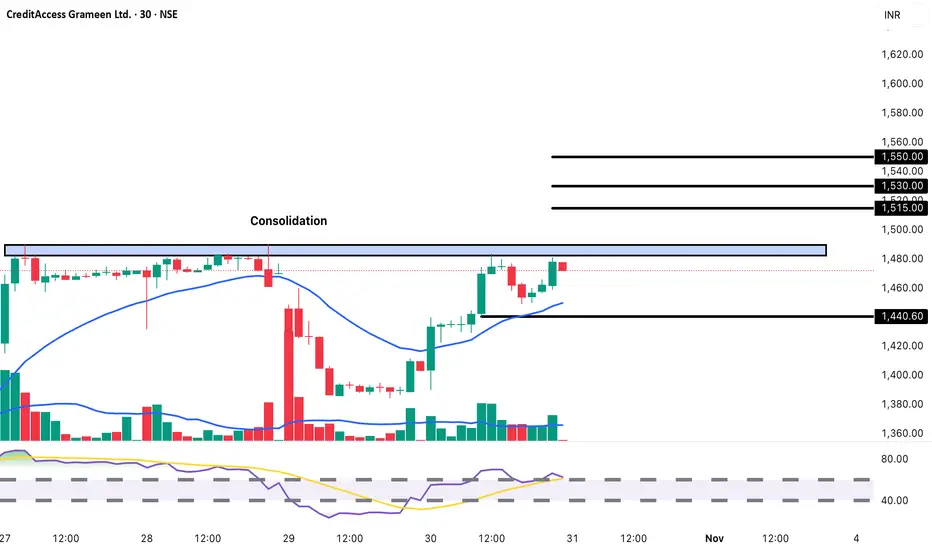
CreditAccess Grameen: Rectangle Breakout Setup BUY Setup 🏦
Entry: ₹1,472-1,478 (Current Level)
Target 1: ₹1,515-1,520
Target 2: ₹1,530-1,540
Target 3: ₹1,550-1,560 (Extended)
Stop Loss: ₹1,440
Technical Rationale:
Consolidating within tight range (1,440-1,495) on 30-min chart
Trading near support at 1,470 level - good risk-reward entry
Price holding above key support at 1,440 zone (black line)
RSI at 62.37 - neutral to bullish, room for upside
Volume showing accumulation pattern (89.09K)
Microfinance/NBFC sector showing resilience
Trading well above EMA (1,449.94) on larger timeframe
Rectangle consolidation pattern - breakout imminent
Multiple resistance levels clearly marked: 1,515, 1,530, 1,550
Support zone well-established at 1,440-1,450
Risk-Reward: Good 1:2.5+ ratio
Pattern: Rectangle consolidation on 30-min chart - typically precedes directional move
Strategy: Intraday to short-term swing - Book 40% at T1 (1,517), 30% at T2 (1,535), trail remaining with SL at 1,480 after T1
Key Levels:
Resistance Zone: 1,480-1,495 (upper rectangle)
Strong Resistance: 1,515, 1,530, 1,550
Critical Support: 1,440, 1,420
Timeframe: 30-minute chart for short-term traders/scalpers
Note: Currently showing minor weakness (-0.42%) but holding support well. Wait for break above 1,480 for confirmation or enter at current support levels with tight SL.
Disclaimer: For educational purposes only. Not SEBI registered.
MADHUCON PROJECTS LTD FOR 2000% - LONG TERM BUYBUY FOR LONG TERM 5-7 YEARS FOR 2000% RETURN EXPECTED
MADHUCON PROJECTS - CMP = 7.50, TGT = 180
THIS IS LOSS MAKING COMING BUT I FEEL FUNDAMENTAL WILL SHIFT TOWARDS PROFIT MAKING IN COMING YEARS. SO I BELIEVE THIS WILL GIVE BEST RIDE AFTER MY TANLA PLATFORMS LTD ( before it was Tanla Solutions Ltd when i entered) ANALYSIS WHICH I SHARED IN MY CLOSED GROUP FOR 70 RS TO 1600 RS.
** This Post Is For Educational Purpose Only, Please Concern Your Advisor Before Investing In Market Related Instruments**
- AB_INV

United Spirits Limited chart analysis: BUY Setup Entry: ₹1,359-1,365 (Current Level)
Target 1: ₹1,393-1,400
Target 2: ₹1,420-1,425
Target 3: ₹1,450+ (Extended)
Stop Loss: ₹1,338

IFL Finance Limited BUY Setup Entry: ₹506-508 (Current Level)
Target 1: ₹516-520
Target 2: ₹525-530
Stop Loss: ₹495
Technical Rationale:
Stock trading above EMA (469.90), showing bullish momentum
RSI at 68.69 indicating strength but not yet overbought
Price consolidating in a rectangular pattern between 490-507
Recent breakout with strong volume (2.38M)
Support from rising trendline visible
+4.43% gain today shows buying interest
Risk-Reward: Favorable 1:2+ ratio

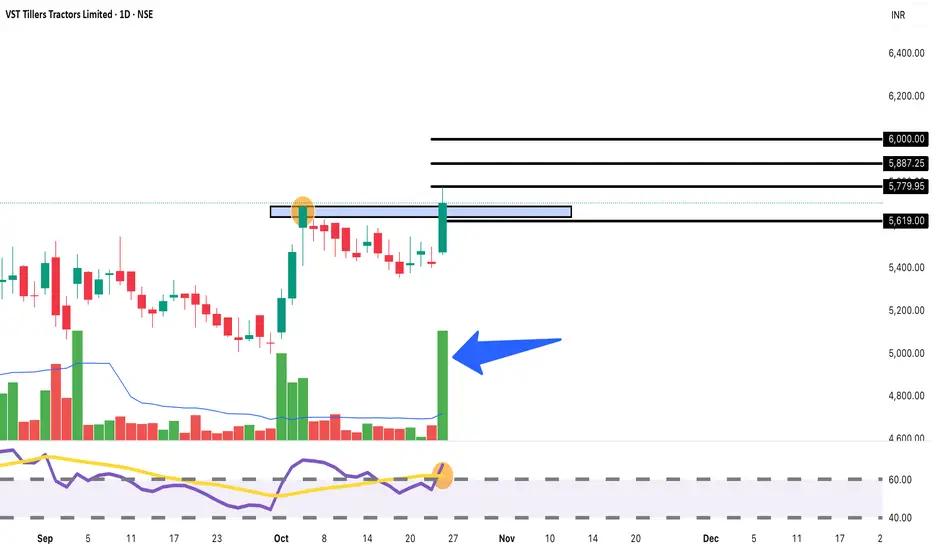
VST Tillers: Explosive Volume Breakout! Target 5,900+BUY Setup 🚜
Entry: ₹5,703-5,720 (Current Level)
Target 1: ₹5,779-5,800
Target 2: ₹5,887-5,900
Target 3: ₹6,000+ (Extended)
Stop Loss: ₹5,620
Technical Rationale:
Massive volume spike (8.71K) - highest in recent period, highlighted with blue arrow
Strong bullish momentum with +5.23% surge today
Breaking out from consolidation range (5,460-5,700)
Price moving above resistance zone marked at 5,700
Rounding bottom formation visible - classic bullish reversal
RSI around 65, showing strength with room for upside
Volume confirmation is exceptional - institutional buying evident
Agricultural/tractor sector showing renewed interest
Two major resistance levels clearly marked at 5,779 and 5,887
Support established at breakout zone (5,650-5,680)
Risk-Reward: Strong 1:3+ ratio
Pattern: Rounding bottom breakout with exceptional volume - highly reliable bullish signal
Strategy: Short to medium-term swing - Book 30% at T1 (5,790), 30% at T2 (5,890), trail remaining with SL at 5,720 after T1
Key Catalysts:
Volume explosion indicating smart money accumulation
Agricultural sector tailwinds
Festive season demand
Key Levels:
Strong Resistance: 5,779, 5,887
Support: 5,650, 5,620, 5,600
education purpose only
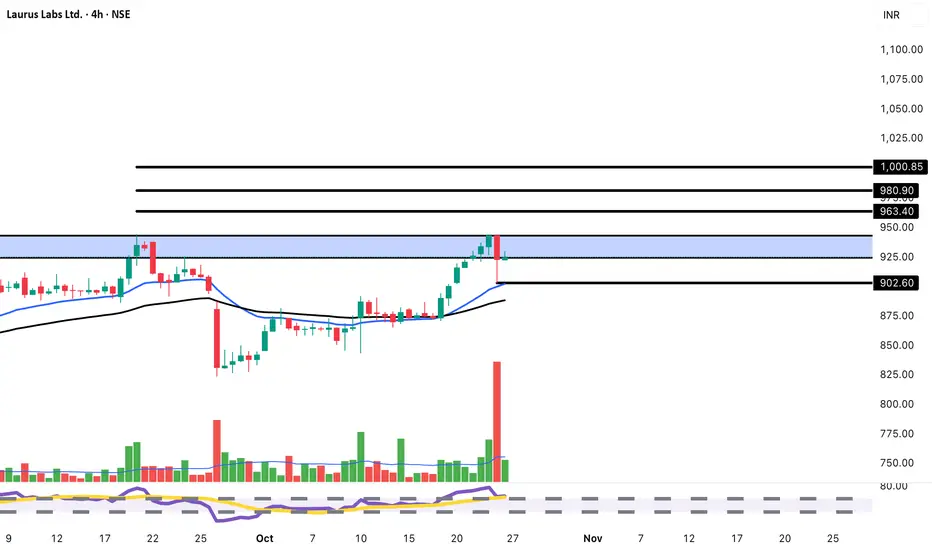
LAURUSLABS: 4H Chart Reversal | Target 980-1,000BUY Setup 💊
Entry: ₹924-930 (Current Level)
Target 1: ₹963-970
Target 2: ₹980-990
Target 3: ₹1,000+ (Extended)
Stop Loss: ₹902
Technical Rationale:
Breaking above key resistance at 925 level with momentum
Strong recovery from recent dip with +0.24% gain
4-hour chart showing bullish reversal pattern
Price reclaiming position above both EMAs
W-pattern (double bottom) formation visible - bullish reversal
RSI trending upward around 70, showing momentum
Volume at 1.35M supporting the breakout
Clear support established at 902 level
Multiple resistance levels: 950, 963, 980, 1,000
Pharma sector showing resilience
Breaking above previous high at 950 zone
Risk-Reward: Good 1:3+ ratio
Pattern: Double bottom/W-pattern breakout - classic bullish reversal on 4H timeframe
Strategy: Intraday to short-term swing - Book 35% at T1 (965), 35% at T2 (985), trail remaining with SL at 930 after T1
Key Levels:
Breakout Zone: 925 (now support)
Strong Resistance: 950, 963, 980, 1,000
Critical Support: 902, 875
For educational purposes only. Not SEBI registered. 4H chart analysis for short-term trades. Watch 902 support closely. Conduct your own research before investing.
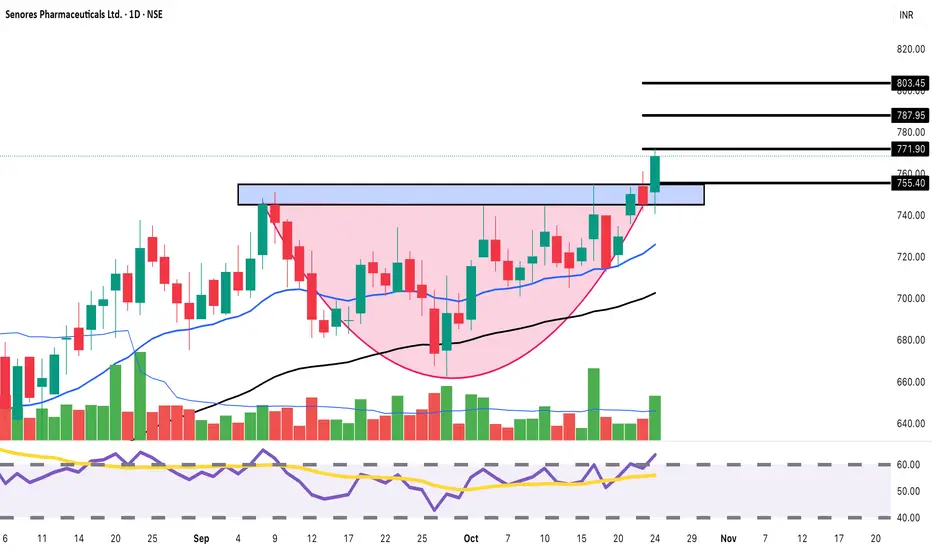
Senores Pharma: Cup & Handle Breakout! Target 803+BUY Setup 💊
Entry: ₹768-775 (Current Level)
Target 1: ₹787-795
Target 2: ₹803-810
Target 3: ₹830+ (Extended)
Stop Loss: ₹752
Technical Rationale:
Powerful breakout from rectangular consolidation (740-770)
Strong bullish momentum with +3.10% surge today
Breaking above resistance zone with conviction
Cup and Handle pattern visible - classic bullish continuation
Price breaking above descending trendline (pink shaded area)
Rising above both EMAs indicating trend reversal
High volume (378.97K) confirming breakout strength
RSI spiking above 60, showing momentum building
Clear support established at 755-760 level
Multiple resistance levels marked: 771, 787, 803
Ascending triangle formation breakout
Risk-Reward: Excellent 1:3+ ratio
Pattern: Cup & Handle + Ascending Triangle breakout - highly reliable bullish signals combined
Strategy: Short to medium-term swing - Book 30% at T1 (790), 35% at T2 (805), trail remaining with SL at 770 after T1
Key Levels:
Breakout Zone: 771 (now support)
Strong Resistance: 787, 803
Support: 755, 752, 740
Sector: Pharma sector showing strength amid market volatility
For educational purposes only. Not SEBI registered. Multiple bullish patterns converging - strong setup but manage risk. Conduct your own research before investing.Retry
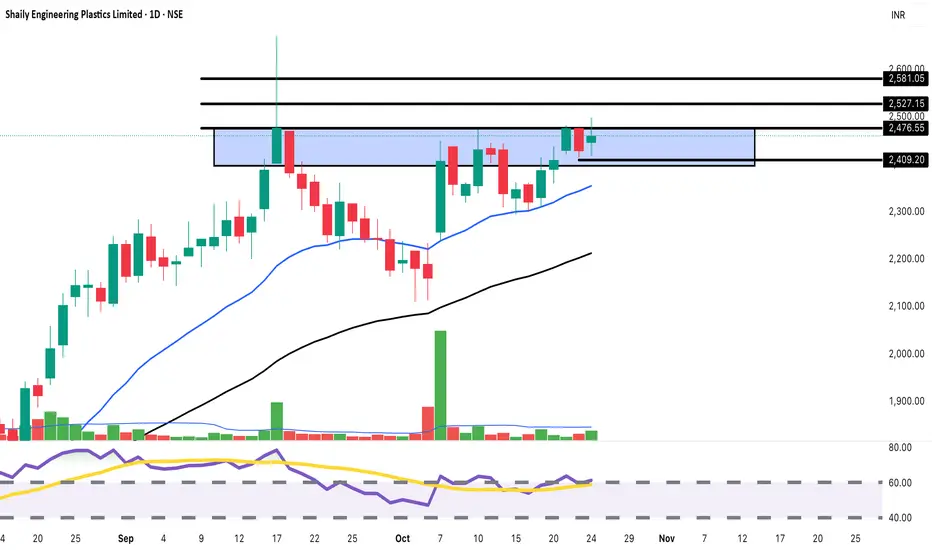
SHAILY: Rectangle Consolidation Breakout | Target 2,650BUY Setup 🔩
Entry: ₹2,460-2,475 (Current Level)
Target 1: ₹2,527-2,540
Target 2: ₹2,581-2,600
Target 3: ₹2,650+ (Extended)
Stop Loss: ₹2,409
Technical Rationale:
Strong consolidation within rectangular range (2,409-2,527) for extended period
Breaking above mid-range with +1.31% gain today
Trading above both EMAs showing bullish trend strength
High volume (188.88K) indicating institutional interest
RSI around 65, healthy momentum with upside potential
Price respecting rising trendline support (black line)
Clear support established at 2,409 level
Multiple resistance levels mapped: 2,476, 2,527, 2,581
Engineering plastics sector showing resilience
Flat base consolidation - sign of strength before breakout
Risk-Reward: Strong 1:3.5+ ratio
Pattern: Flat base consolidation breakout - bullish continuation pattern indicating strength
Strategy: Medium-term swing - Book 30% at T1 (2,530), 30% at T2 (2,590), trail remaining with SL at 2,480 after T1
For educational purposes only. Not SEBI registered. Strong consolidation base suggests accumulation - manage position size appropriately. Conduct thorough research before investing.
RELIANCE — The MONSTER WAVE 3 Isn’t Over Yet!📈 Summary:
Reliance isn’t done yet — the structure shows a powerful Wave 3 still unfolding with institutional strength behind it.
Expect a controlled Wave 4 retracement (₹800–₹500) before the next super rally — Wave 5 toward ₹10,000 (3.618%) .
📈 Elliott Wave count + SMC + Fundamentals all scream continuation!
Smart money is accumulating , not distributing — this is the calm before the storm.
🔥 Wave 3 builds wealth. Wave 5 creates history.
📊 Elliott Wave Confluence:
The stock remains within Wave 3 , unfolding with strong impulsive momentum and clean internal sub-waves.
Wave 3 is expected to mature around the 2.618 extension (~₹2,875) , but structure still supports further upside before exhaustion.
A Wave 4 correction will likely retrace toward the 0.382–0.5 Fib zone (₹800–₹500) , forming a deep yet healthy reset.
The grand finale — Wave 5 — targets the 3.618 Fibonacci extension (~₹10,000) , aligning with long-term macro growth and structural expansion. 🚀
💰 Smart Money Concept (SMC) Insight:
Institutional order flow remains bullishly displaced — no evidence of full distribution yet.
Expect Wave 4 to be the “smart money re-entry zone,” with liquidity sweeps and accumulation before the final push.
Wave 5 could trigger the euphoric phase where late retail chases and institutions start scaling out at premium valuations. 🧠💵
📈 Price Action Perspective:
Trend remains structurally bullish — higher highs and higher lows dominate.
A break above ₹1,600–₹1,700 confirms Wave 3 continuation.
Once the market consolidates into Wave 4, watch for equal lows, demand absorption, and BOS confirmations to catch early Wave 5 entries.
Wave 5 is expected to be sharp, emotional, and momentum-driven — classic of late-cycle impulsive waves. ⚙️📊
🌍 Fundamental Confluence:
Reliance’s expansion across energy, telecom, AI, green tech, and retail supports this wave count perfectly.
The next decade’s growth catalysts — digital ecosystem scale-up, Jio financial inclusion, and renewables — align with Wave 5’s “valuation explosion” narrative.
Fundamentals mirror Elliott psychology: Wave 3 = justified growth, Wave 4 = consolidation, Wave 5 = euphoria-driven expansion . 💹🌏
🔮 Expectations Ahead:
📍 Wave 3 Target: ₹2,800–₹3,000 range (2.618 fib).
⚠️ Wave 4 Retracement: ₹800–₹500 (accumulation & re-entry zone).
🚀 Wave 5 Target: ₹10,000 (3.618 extension — the ultimate cycle peak).
💎 Final Thought:
Reliance is still in the driver’s seat of its Wave 3.
Wave 4 will give patient bulls one final golden entry before Wave 5 — the ₹10,000 super cycle — rewrites market history.
Traders & Analysts
"This might be the mega move of the decade — and it’s happening right in front of us. 🔥
Reliance (RELIANCEIND) is still charging through a powerful Wave 3, and there’s plenty of air above before any major correction even begins. 🚀
Our Elliott Wave models show Wave 3 has not peaked yet — momentum, structure, and institutional flow all confirm that the current rally could still extend toward the ₹2,800–₹3,000 zone before any Wave 4 cooldown.
But here’s the big picture: after Wave 4’s healthy reset, the final Wave 5 explosion could drive prices to a massive ₹10,000 target (3.618 extension) — a potential super-cycle top years in the making. 💎
📈 Smart money isn’t exiting — it’s riding Wave 3 and preparing for the ultimate Wave 5 payoff.
Timing this phase could define your decade in trading. ⚡
So, traders — how far do you think Wave 3 can run before the big reset?
Drop your targets below 👇 and let’s see who rides this wave all the way to ₹10,000! 💰🌊”
— Team FIBCOS
#Reliance #ElliottWave #NSE #SmartMoney #PriceAction #WaveTheory #TechnicalAnalysis #TradingView #Investing #StockMarketIndia #RelianceIndustries #SwingTrading #LongTermInvesting #Wave3 #Wave5 #BullishIndia #ChartAnalysis #WealthBuilding #MarketStructure #Fibonacci #Wave4Accumulation

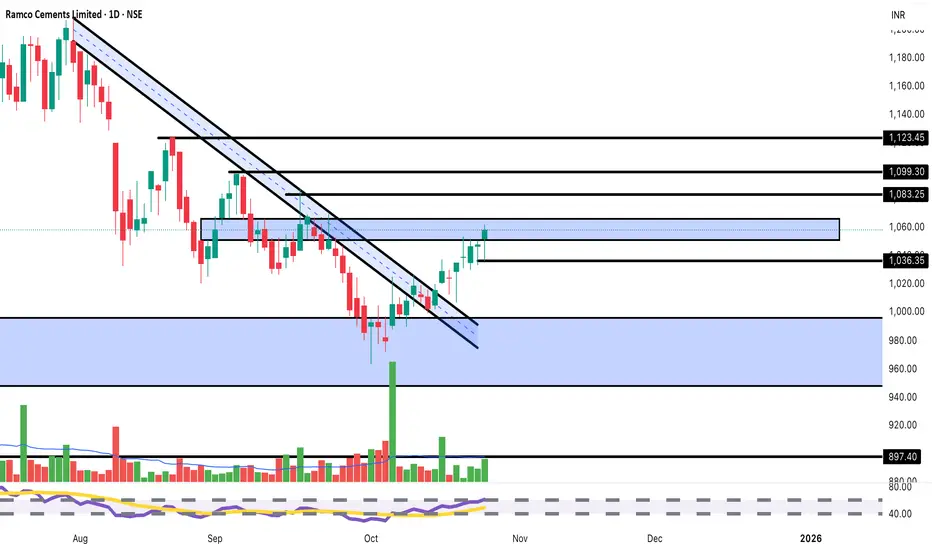
Ramco Cements Breaking Key Resistance | Target 1,100+BUY Setup 🏗️
Entry: ₹1,058-1,065 (Current Level)
Target 1: ₹1,083-1,090
Target 2: ₹1,099-1,110
Target 3: ₹1,123-1,135 (Extended)
Stop Loss: ₹1,036
Technical Rationale:
Breaking above descending channel (blue shaded area) - major bullish reversal
Strong momentum with +1.11% gain today
Price reclaiming 1,060 resistance zone
Breaking above both declining trendlines convincingly
High volume (343.03K) supporting the breakout
Consolidation zone (1,000-1,060) now acting as support
RSI trending upward, showing momentum building
Cement sector showing strength on infrastructure demand
Multiple resistance levels mapped: 1,036, 1,083, 1,099, 1,123
Clear support at 1,000 psychological level
V-shaped recovery from October lows
Risk-Reward: Strong 1:3+ ratio
Pattern: Falling wedge/descending channel breakout - highly reliable bullish reversal pattern
Strategy: Medium-term swing trade - Book 30% at T1 (1,085), 30% at T2 (1,105), trail remaining with SL at 1,065 after T1
Key Levels:
Breakout Zone: 1,060 (critical level crossed)
Strong Resistance: 1,083, 1,099, 1,123
Major Support: 1,036, 1,000, 980
Sector Catalyst:
Infrastructure spending boost expected
Cement demand picking up seasonally
For educational purposes only. Not SEBI registered. Major pattern breakout - manage position sizing appropriately. Cement stocks can be volatile. Conduct thorough research before investing.
Shipping Corporation of India Limited chart analysisBUY Setup ⚓
Entry: ₹250-252 (Current Level)
Target 1: ₹260-265
Target 2: ₹275-280
Target 3: ₹290+ (Extended)
Stop Loss: ₹242
Technical Rationale:
Explosive breakout with +7.93% surge on massive volume
Exceptional volume spike (38M) - highest in the chart period
Breaking out from consolidation range (225-240)
RSI spiking above 60, indicating strong bullish momentum
Price crossing above key resistance at 245-246 level
Gap-up opening showing strong institutional buying
Shipping sector momentum with global trade trends
Support established at breakout zone (245)
Risk-Reward: Strong 1:4+ ratio
Sector Catalyst: PSU shipping stocks showing strength, potential government policy support
Strategy: Momentum trade - Book 30% at T1 (260), 30% at T2 (275), trail SL to 255 after T1 achieved
Caution: High volatility expected - avoid overexposure. Watch for profit booking after sharp rally
