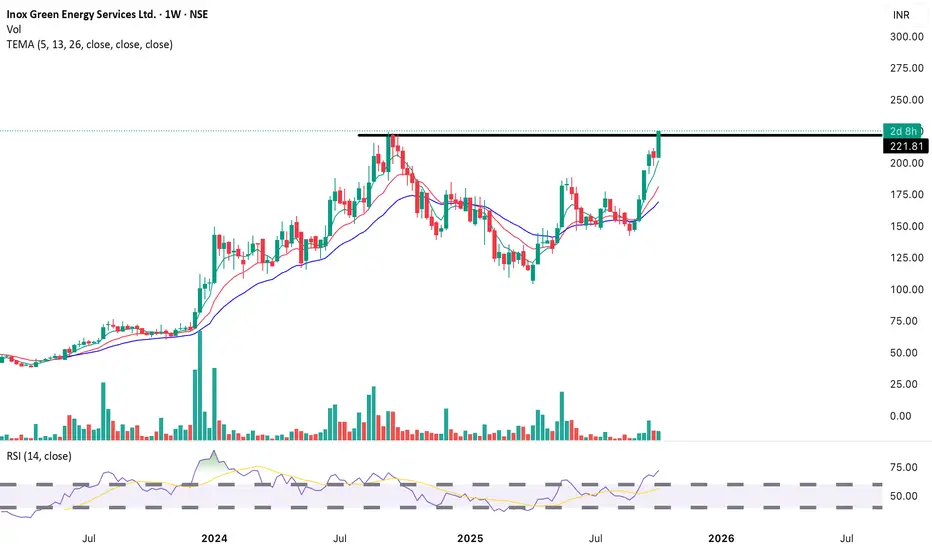
Long (Bullish) – Continuation expected if price sustains Resistance Turned Support: ₹221
Next Target Zone: ₹250–₹275
Stop-loss: Below ₹201 (recent swing low and major moving average)
Nse
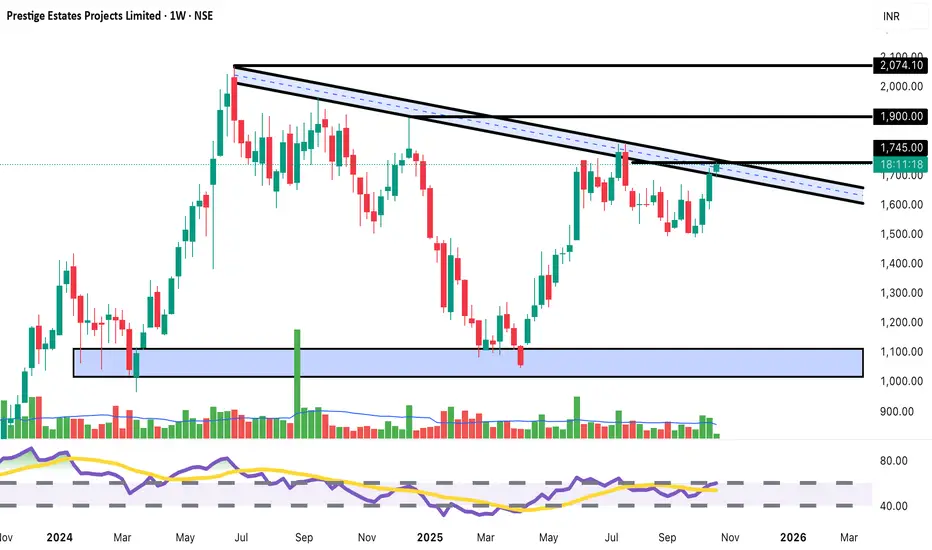
Prestige Estates: Weekly Trendline Breakout | Buy Setup 1,745BUY Setup 🏢
Entry: ₹1,737-1,745 (Current Level)
Target 1: ₹1,800-1,820
Target 2: ₹1,880-1,900
Target 3: ₹1,950-2,000 (Extended)
Stop Loss: ₹1,680
Technical Rationale:
Breaking above long-term descending trendline (from 2024 highs)
Price at critical resistance zone - potential breakout imminent
Weekly chart showing bullish momentum with +1.81% gain
Testing 1,745 resistance level - last major hurdle before rally
Strong support base at 1,000-1,200 zone visible
RSI around 65 on weekly - healthy momentum
Volume at 1.21M showing institutional interest
Real estate sector showing renewed strength
Multiple touches on trendline indicating strong resistance turned support
Risk-Reward: Strong 1:4+ ratio
Pattern: Descending channel breakout on weekly timeframe - highly reliable bullish signal
Strategy: Positional/swing trade - Book 30% at T1 (1,810), 30% at T2 (1,890), trail remaining with SL at 1,750 after T1 achieved
Key Levels:
Critical Resistance: 1,745-1,750 (breakout zone)
Support: 1,680, 1,620, 1,550
Timeframe: Weekly chart suggests this is a medium-term positional opportunity
SKYGOLDLooks good on Chart.
Breakout Visible.
Above all key EMA.
Good for Short Term.
Target 410,500.
Do Like ,Comment , Follow for regular Updates...
Keep Learning ,Keep Earning...
Disclaimer : This is not a Buy or Sell recommendation. I am not SEBI Registered. Please consult your financial advisor before making any investments . This is for Educational purpose only.

TCS - H1 - Triangle Breakout (19.10.2025)📊 Setup Overview:
TCS is showing a Triangle Breakout formation on the H1 chart. Price has been consolidating within converging trendlines, and a cloud crossover hints at a possible momentum shift. This setup could lead to a directional breakout opportunity for short-term traders.
📈 Trade Plan:
Bias: Bearish below the breakout zone
Sell Entry Zone: Below 2950 (after candle close confirmation)
1st Target: 2877 ✅
2nd Target: 2814 🎯
Resistance Zone: 3010 – 3030
🧩 Technical Confluence:
1.Price rejected from upper trendline multiple times
2.Ichimoku Cloud crossover signals short-term weakness
3.Lower highs formation confirms loss of bullish momentum
4.Volume profile shows high interest near 2900, indicating potential liquidity zone
#TCS #NSE #StockMarketIndia #TechnicalAnalysis #TriangleBreakout #Ichimoku #PriceAction #SwingTrading #StocksToWatch #IndianStocks #Nifty50 #TradingView #ChartsDontLie #Kabhi_Ta_Trading #BearishSetup
💡 Fundamental View:
TCS, India’s leading IT services giant, remains fundamentally strong with consistent revenue from global clients and robust digital transformation projects.
However, recent IT sector consolidation and global tech budget tightening could create short-term selling pressure. The stock’s medium-term outlook remains positive, but near-term corrections may occur before a fresh rally.
⚠️ Disclaimer:
This analysis is for educational and informational purposes only and should not be considered as financial advice. Always use proper risk management and confirm setups with your own analysis before trading or investing.
💬 Support the Analysis:
If this chart helped you — LIKE 👍, COMMENT 💬 your views, and FOLLOW ✅ for daily market insights, chart patterns, and trade setups!

Asahi India Glass Limited chart analysisEntry: ₹941-945 (Current Level)
Target 1: ₹971-975
Target 2: ₹988-995
Target 3: ₹1,020+ (Extended)
Stop Loss: ₹925
Technical Rationale:
Powerful breakout from prolonged consolidation (870-940)
Strong bullish momentum with +3.02% gain today
Massive volume spike (441.46K) - significantly above average
RSI trending upward near 60, showing strong momentum
Price breaking above key resistance at 931-940 zone
Fresh 52-week high territory - no overhead resistance
Auto sector tailwinds supporting glass demand
Clear support established at breakout level (931)
Risk-Reward: Excellent 1:3+ ratio
Strategy: Momentum breakout play - Book 30% at Target 1, 30% at Target 2, trail remaining with SL at 960 after T1
Key Levels to Watch:
Support: 931, 920
Resistance: 971, 988, 1,000 (psychological)

Cybertech - long term investment idea - latest update Cybertech - long term investment idea - latest update. More details on the chart.

HealthCare Global Enterprises Ltd. BUY SetupEntry: ₹709-712 (Current Level)
Target 1: ₹723-725
Target 2: ₹737-740
Target 3: ₹755-760 (Extended)
Stop Loss: ₹690


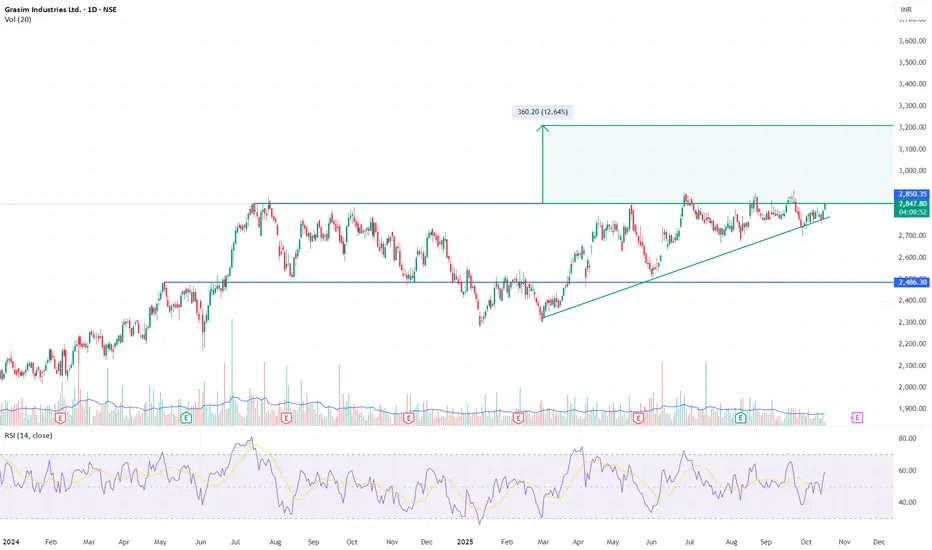
GRASIM – Base Pressure Building for Breakout Above ₹2,850Price has spent almost a year trapped between ₹2,480 and ₹2,850. Each dip since mid-2025 has formed higher lows, compressing against the same horizontal ceiling. Today’s candle closes right at ₹2,850 with RSI rising toward 60 — the structure is tightening for resolution.
A decisive close above ₹2,900 with strong volume will confirm breakout and open the path toward ₹3,200–₹3,250 (~12–13% measured move).
Setup: Ascending Triangle re-attempt
Entry Trigger: ₹2,900+ close with volume confirmation
Target Zone: ₹3,200–₹3,250
Support: ₹2,700
Invalidation: ₹2,680
Price has respected this structure for nearly a year; compression is mature, volatility contraction visible, and the next move should define direction.
Disclaimer: Not a recommendation. For educational purposes only.

Buy Kfin Technologies above 1,145 INR Buy Kfin Technologies above 1,145 INR.
Target: 1,180 / 1,220 INR.
Stoploss: 1,078 INR.

NIFTY 13th Oct'2025 | LONG | BULLISH Nifty : Bullish Trend
Long Entry
15m after sell-side lq sweep market likely move to bullish trend until above zone.

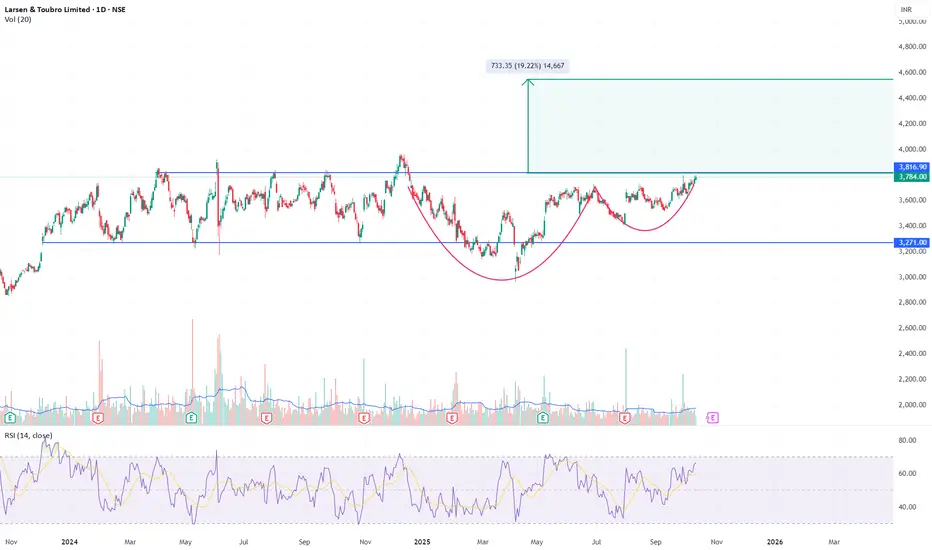
L&T - Cup and Handle Formation Near Breakout ZoneChart Structure:
Larsen & Toubro is forming a textbook Cup and Handle pattern that’s now testing its neckline around ₹3,780–₹3,800. The base extends nearly 10 months, creating a strong accumulation structure with a shallow handle - ideal for a breakout continuation.
Technical Highlights:
Cup Base: ₹2,950–₹3,000
Neckline: ₹3,780–₹3,800 (currently being tested)
Handle: Tight consolidation with declining volume, now showing early expansion
RSI: Rising towards 70, confirming strengthening momentum
Volume: Reaccumulation behavior - lighter on corrections, heavier on upswings
Trade Setup:
Breakout Confirmation: Close above ₹3,820 with strong volume
Target: ₹4,500–₹4,550 (≈19% upside from breakout)
Stop-Loss: ₹3,600 (below handle low)
Technical Verdict:
A sustained move above ₹3,820 would mark a major bullish continuation, potentially initiating a new leg in L&T’s long-term uptrend. Pattern reliability is high given the depth, duration, and structure of the base.
Disclaimer:
This analysis is for educational and informational purposes only and does not constitute investment advice or a recommendation to buy or sell any security. Markets involve risk, and past performance does not guarantee future results. Conduct your own due diligence or consult a qualified financial advisor before making investment decisions.
Trade Setup: Kingfa Science & Technology (India) LtdAction: Buy
Entry Level: 4,670–4,690 (breakout candle level)
Target 1: 4,764
Target 2: 4,962
Stoploss: 4,400 (below triangle support)

GMDC Breakout Setup: Buy Above 637Entry: Buy above 637 (recent resistance and Fibonacci breakout spot).
Target 1: 673 (Fibonacci 0.382 retracement).
Target 2: 703 (Fibonacci 0.5 retracement).
Target 3: 733 (Fibonacci 0.618 retracement).
Stoploss: 615 (below recent support and trendline).
Volume spike and RSI uptick signal momentum

Bullish Breakout – Monitor for follow-through Support: ₹500–₹570 (previous resistance)
Upside Targets: ₹650, ₹750
Stop-loss: Below ₹499

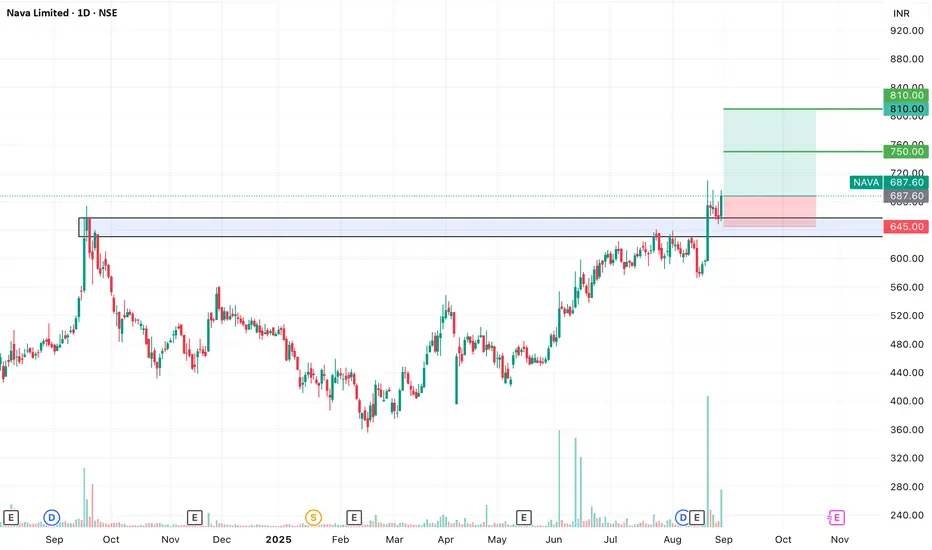
SWING IDEA - NAVA Nava Ltd , a diversified natural resources and energy company, is showing a promising swing opportunity with a breakout backed by strong technical signals.
Reasons are listed below :
Cup and Handle breakout, a strong bullish continuation pattern
Confirmed bullish price action post breakout
Bullish engulfing candle on the daily timeframe
Volume spike, confirming breakout strength
Trading near its 52-week high, showing momentum
Sustaining above 50 & 200 EMA on the daily chart
Target - 750 // 810
Stop loss - daily close below 645
DISCLAIMER -
Decisions to buy, sell, hold or trade in securities, commodities and other investments involve risk and are best made based on the advice of qualified financial professionals. Any trading in securities or other investments involves a risk of substantial losses. The practice of "Day Trading" involves particularly high risks and can cause you to lose substantial sums of money. Before undertaking any trading program, you should consult a qualified financial professional. Please consider carefully whether such trading is suitable for you in light of your financial condition and ability to bear financial risks. Under no circumstances shall we be liable for any loss or damage you or anyone else incurs as a result of any trading or investment activity that you or anyone else engages in based on any information or material you receive through TradingView or our services.
@visionary.growth.insights
AJMERAThis stock has breakout small resistance level so further up move will come up to all time high
and this is just for educational purpose

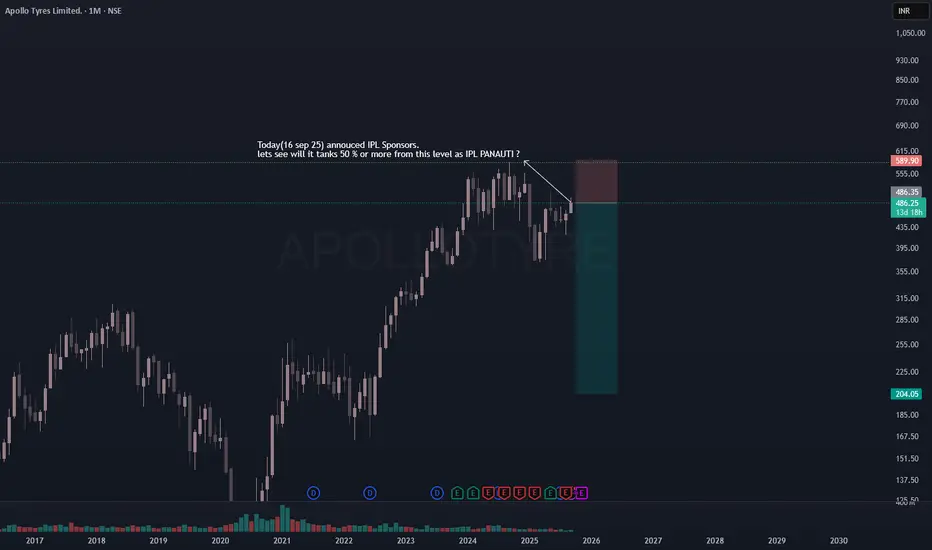
IPL Sposnors Apollo Tyres - SELL VIEWLets see how it rolls out,
Expecting 50 % drop in this stock as it enters the IPL Sponsors ship.
CMP - 486,
Expected price - 250
Investment horizon - 2-3 years.
A lot of thesis to write but lets play this normal chart.
** This post is for education and entertainment purpose only, Please concern your advisor before investing in market related instruments.**
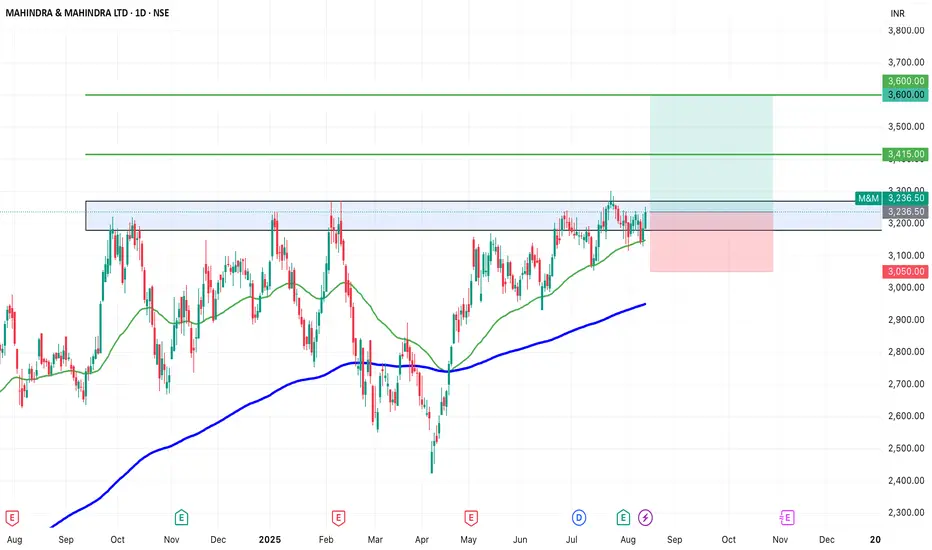
SWING IDEA - M&MM&M , a leading Indian automotive and farm equipment manufacturer, is showing signs of a potential breakout, making it a strong swing trading candidate.
Reasons are listed below :
3,200 resistance tested multiple times — now weakened and primed for a breakout
VCP (Volatility Contraction Pattern) forming, indicating accumulation
Trading above 50 & 200 EMA, confirming long-term trend strength
Inverse Head & Shoulders pattern forming, a bullish reversal setup
Target : 3415 // 3600
Stoploss : daily close below 3050
DISCLAIMER -
Decisions to buy, sell, hold or trade in securities, commodities and other investments involve risk and are best made based on the advice of qualified financial professionals. Any trading in securities or other investments involves a risk of substantial losses. The practice of "Day Trading" involves particularly high risks and can cause you to lose substantial sums of money. Before undertaking any trading program, you should consult a qualified financial professional. Please consider carefully whether such trading is suitable for you in light of your financial condition and ability to bear financial risks. Under no circumstances shall we be liable for any loss or damage you or anyone else incurs as a result of any trading or investment activity that you or anyone else engages in based on any information or material you receive through TradingView or our services.
@visionary.growth.insights
BANKNIFTY 25 SEP 2025 53600 CE (15-min timeframe)CMP: ~₹960
RSI: ~41 (trying to recover from oversold zone)
Price is bouncing from support (~₹890–900) with strong volume.
Resistance is near ₹1,020–1,050 (EMA cluster).
📌 TradingView Post (short & crisp):
Buy above ₹965
🎯 Target: ₹1,020 / ₹1,080
⛔ Stop-loss: ₹890

Looking for Zuari's Golden Zone - Fib RetracementZuari's fib retracement on the daily chart on the run up from 200 to 390 shows a clear pullback to 38.2% followed by a failed attempt to break 100% in a seeming double top formation around 390, invalidating immediate bullish momentum.
Daily Macd and RSI look weak with bearish divergences forming against PA, denoted with green brush lines showing both indicators with lower highs against price's equal high.
A retest of the golden zone (61.8% to 78.6%) puts us between roughly 240 and 275, which should offer a high probability zone for accumulation and eventually a bounce.
Look out for confluences of major fib levels with 1d 50ma, 99ma and 200ma. 61.8% also has a horizontal confluence with the Dec 3rd peak, and 78.6% has horizontal confluence with April 24th peak, also potentially infleuntial to support levels.

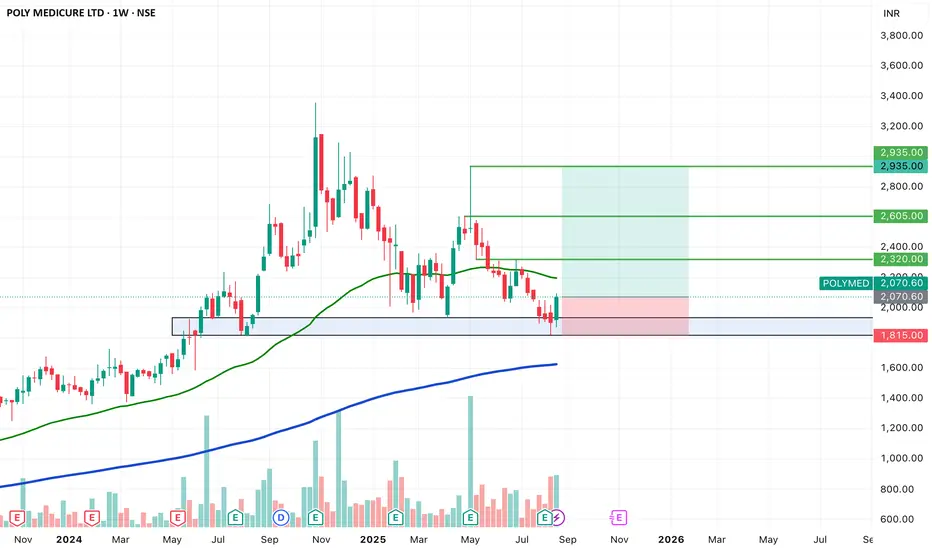
SWING IDEA - POLY MEDICUREPoly Medicure , a leading Indian medical devices manufacturer with a strong global footprint, is currently offering a favorable swing trading setup backed by strong technical confluence.
Reasons are listed below :
1,950 zone acting as a strong support base
Bullish engulfing candle on the weekly timeframe, signaling reversal strength
Marubozu candle on the daily chart, supported by strong volumes
Golden Fibonacci retracement zone providing support in the larger trend
Price comfortably above the 200 EMA, showing long-term trend strength
Target - 2320 // 2605 // 2935
Stoploss - weekly close below 1815
DISCLAIMER -
Decisions to buy, sell, hold or trade in securities, commodities and other investments involve risk and are best made based on the advice of qualified financial professionals. Any trading in securities or other investments involves a risk of substantial losses. The practice of "Day Trading" involves particularly high risks and can cause you to lose substantial sums of money. Before undertaking any trading program, you should consult a qualified financial professional. Please consider carefully whether such trading is suitable for you in light of your financial condition and ability to bear financial risks. Under no circumstances shall we be liable for any loss or damage you or anyone else incurs as a result of any trading or investment activity that you or anyone else engages in based on any information or material you receive through TradingView or our services.
@visionary.growth.insights