JSW Cement: Company Profile & Sector Analysis
🙀🧐Conclusion 🧐🙀
🤔While JSW Cement demonstrates ambition and operational scale in India’s vibrant cement sector, its financial health is tempered by high leverage and modest returns. Strong governance, strategic debt management, and transparent reporting will be critical as the company seeks market leadership among robust peers. Long-term investors should closely monitor improvements in cash flows and efficiency, given sector opportunities and competitive dynamics.
🧐The cement sector shows strong growth led by robust leaders; JSW Cement is a promising but highly leveraged mid-cap facing profitability and liquidity challenges. Sector fundamentals remain resilient, but JSW’s turnaround depends on prudent financial and governance reforms
🌺🌺About JSW Cement🌺🌺
JSW Cement is a prominent Indian cement manufacturer, recently listed on BSE and NSE in August 2025. The company aims to rapidly expand its production capacity and footprint across key markets with a focus on sustainable manufacturing and innovative processes.
🤯Cement Sector Growth & Future Potential🤯
- India’s cement demand driven by government infrastructure push and urbanization.
- Sector CAGR expected at 7-9% over the next five years with rapid capacity additions.
- Companies investing in green cement, alternative fuels, and digital operations.
- Consolidation and entry of large players signal a highly competitive future market landscape.
🧐Financials Snapshot (FY25)🧐
- Revenue: ₹6,028 crore
- Operating Margin: 15.3%
- EBITDA Margin: 16%
- Net Margin: 1%
- Market Cap: ₹7,400 crore
- Free Cash Flow: Negative
😶🌫️Key Ratios😶🌫️
- Debt/Equity Ratio: 2.6 (sector high)
- Return on Equity (ROE): 0.6% (below industry average)
- Return on Capital Employed (ROCE): 8%
- Current Ratio: 0.65
- Dividend Payout: 0%
👷🏻 Peer Analysis👷🏻
- UltraTech Cement, Shree Cement, and Ambuja Cement lead with stronger margins and lower debt.
- JSW Cement’s leverage (high debt) impacts profitability and shareholder returns.
- Sector leaders maintain ROE and ROCE above 10-13%; JSW lags in these metrics.
- Free cash flow in JSW Cement lags behind top peers due to high investment and operational pressures.
- Margins are competitive but net profitability is limited compared to industry best.
- JSW Cement is positioned as a mid-cap, growth-oriented player with room for efficiency improvement.
- Company’s focus on expansion adds long-term growth potential.
- Peer companies show higher liquidity and sustainable dividend payout records.
Nse
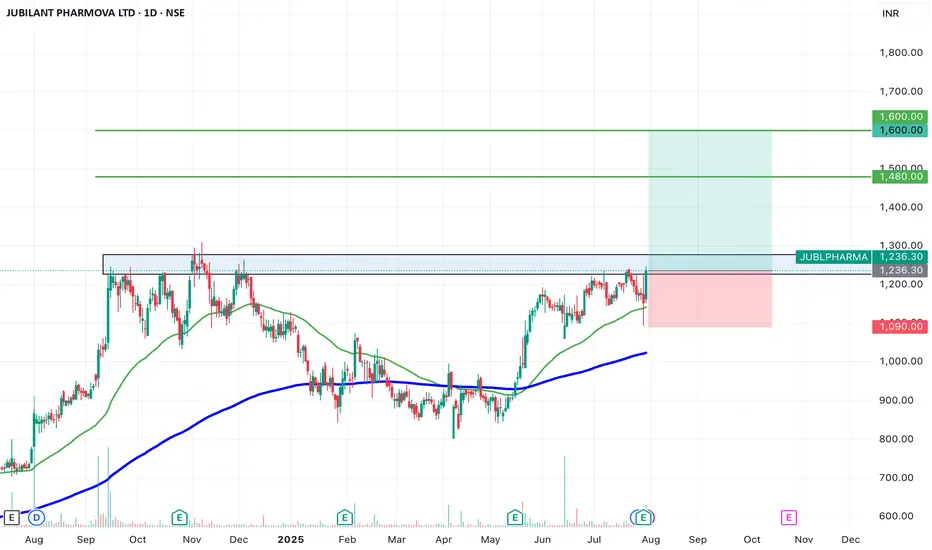
SWING IDEA - JUBILANT PHARMOVAJubilant Pharmova , a diversified pharmaceutical company focused on CRAMS and specialty pharma, is presenting a strong swing opportunity backed by a major pattern breakout and volume confirmation.
Reasons are listed below :
Breakout from an Inverted Head & Shoulders pattern after over a year of consolidation
Attempting breakout above 1250, a key resistance zone with multiple rejections in the past
Strong marubozu candle on the daily chart with a notable volume spike, signaling conviction
Trading near all-time highs, and comfortably above key EMAs, reinforcing trend strength
Target : 1480 // 1600
Stoploss : weekly close below 1090
DISCLAIMER -
Decisions to buy, sell, hold or trade in securities, commodities and other investments involve risk and are best made based on the advice of qualified financial professionals. Any trading in securities or other investments involves a risk of substantial losses. The practice of "Day Trading" involves particularly high risks and can cause you to lose substantial sums of money. Before undertaking any trading program, you should consult a qualified financial professional. Please consider carefully whether such trading is suitable for you in light of your financial condition and ability to bear financial risks. Under no circumstances shall we be liable for any loss or damage you or anyone else incurs as a result of any trading or investment activity that you or anyone else engages in based on any information or material you receive through TradingView or our services.
@visionary.growth.insights
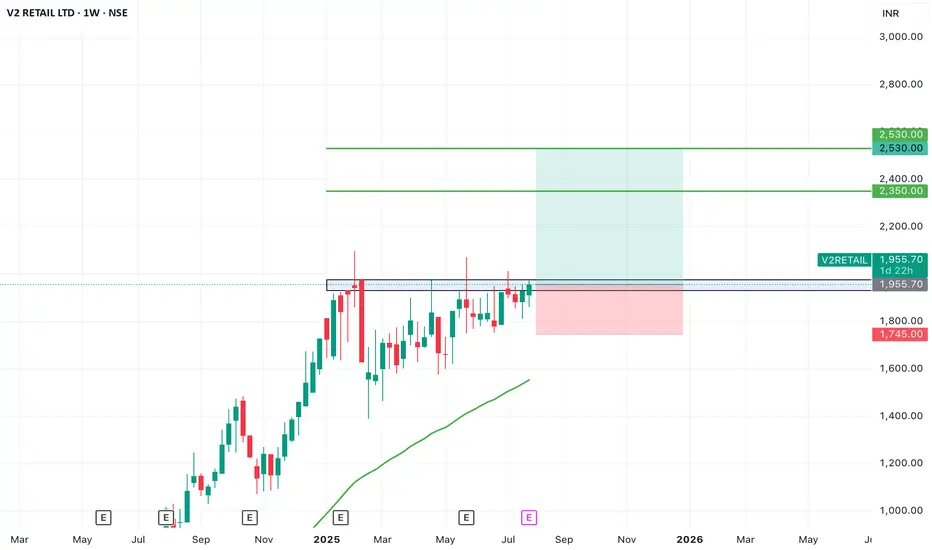
SWING IDEA - V2 RETAILV2 Retail , a small-cap value fashion retailer with a pan-India presence, is showing strong bullish momentum and a textbook swing trade setup backed by multiple breakout signals.
Reasons are listed below :
Breakout from a VCP (Volatility Contraction Pattern) – indicating accumulation and strength
Ascending triangle breakout – classic continuation pattern
Cleared major resistance zone, confirming bullish intent
Maintains a clear uptrend with higher highs and higher lows
Target - 2350 // 2530
Stoploss - weekly close below 1745
DISCLAIMER -
Decisions to buy, sell, hold or trade in securities, commodities and other investments involve risk and are best made based on the advice of qualified financial professionals. Any trading in securities or other investments involves a risk of substantial losses. The practice of "Day Trading" involves particularly high risks and can cause you to lose substantial sums of money. Before undertaking any trading program, you should consult a qualified financial professional. Please consider carefully whether such trading is suitable for you in light of your financial condition and ability to bear financial risks. Under no circumstances shall we be liable for any loss or damage you or anyone else incurs as a result of any trading or investment activity that you or anyone else engages in based on any information or material you receive through TradingView or our services.
@visionary.growth.insights
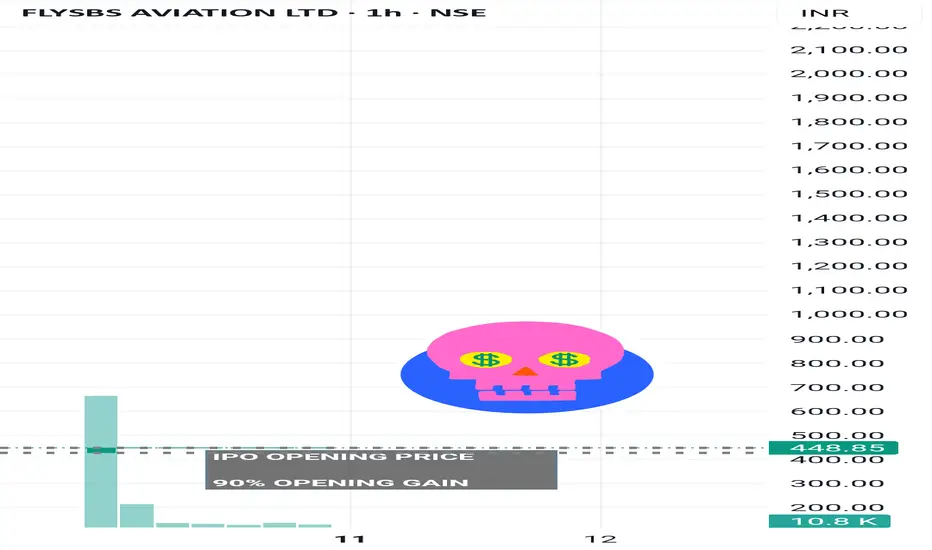
FlySBS Aviations –" Next decade "NSE:FLYSBS 🫰🏻 CONCLUSION 🫰🏻
With strong sector tailwinds, rapid fleet expansion, and clear operational scale-up plans, FlySBS Aviation is well positioned to deliver sustainable positive cash flows and attractive long-term returns, offering meaningful upside for investors as industry demand accelerates
🌸 Company Overview & Industry 🌸
-FlySBS Aviation is a private non-scheduled air charter operator serving B2B & B2C clients including corporates, HNIs, celebrities, and diplomats.
-Operates a fleet of 3 owned private jets plus dry/wet lease options to meet demand surges.
-The Indian private aviation market is growing rapidly, with an expected CAGR of 8–15% over the next decade
🌸FY2025 Sales (Total Revenue: ₹193.9 Cr)🌸
Private Jet Charters: 94% (₹182 Cr)
International Missions: 77% (₹149 Cr)
Domestic Charters: 23% (₹44.7 Cr)
Medical/Security Operations: 4% (₹8 Cr)
Subscription/Leasing: 2% (₹3 Cr)
🌸Financial Highlights (FY21–25)🌸
Revenue CAGR: ~63%
Net Profit CAGR: ~70%
Operating Margin: 21%
Net Profit Margin: 14.7%
ROE: 18.9%
EPS (FY25): ₹25.47
🌸DCF Valuation Insight🌸🫰🏻
Intrinsic Value: ~₹220 per share
Justification:
The valuation captures the expected transition from a heavy investment phase with negative free cash flow toward stable and positive cash flow generation.
The reliability is moderate, contingent on effective execution of growth plans and capital management aligned with market trends
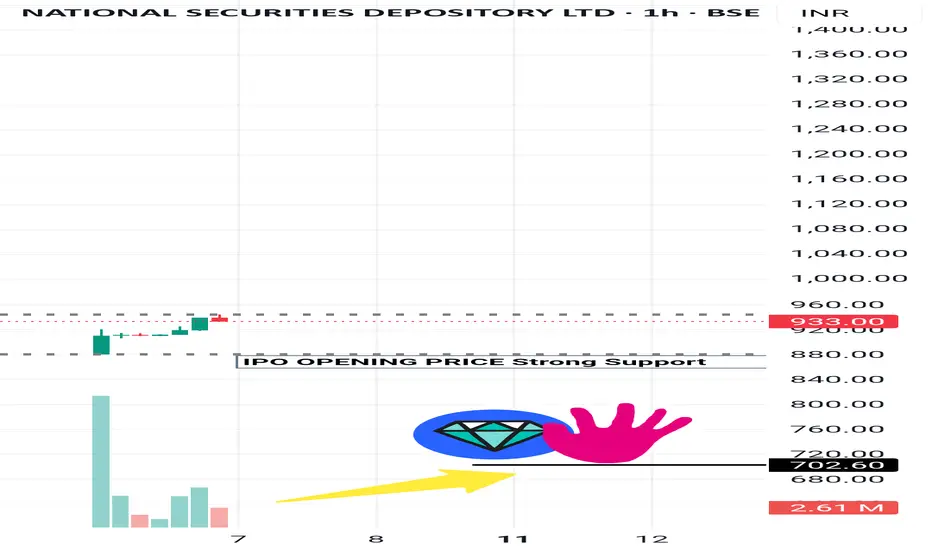
NSDL (INTRESTING STOCK )👉🏻 NSDL – Equity Snapshot 👈🏻
🕛 Conclusion ⏱️
NSDL stands at a strategic inflection point — evolving from an institutionally heavy, legacy infrastructure provider to a retail and digitally agile depository. With a zero-debt model, strong cash flows, and clear retail growth plans underway, NSDL shows potential for steady earnings expansion and margin improvement over the next few years. The foundation is strong; execution will now drive the delta.
🙋🏻 Introduction
India’s largest depository by value, with over ₹450 lakh crore in Assets Under Custody (AUC).
Founded in 1996, primarily serving institutional and corporate clients.
Known for stability, trust, and core infrastructure services in the capital market.
🌸 Financial Performance (FY25)🌸
Total Revenue: ₹1,535 crore.
Depository Business Revenue: ₹660 crore (Approx. 43% share).
Operating Margin (Core Business): ~50%.
Net Margin: 22% – 24%.
Net Profit: ₹330+ crore.
Free Cash Flow: ₹558 crore+.
Debt: Zero (Fully debt-free).
Capital Expenditure: ~₹74 crore only (Low capex model).
🌸 Market Position🌸
Dominates in value terms (highest AUC in India).
Client base includes mutual funds, banks, insurers, and corporates.
Retail demat accounts: ~4 crore (behind CDSL’s 15+ crore).
High average demat account size (~₹1,100 crore) vs CDSL’s retail-heavy base.
Gaining ground in retail via partnerships with Zerodha, Groww, Angel One, etc.
🌸 Future Growth Focus🌸
Aggressively entering retail segment through schemes like ‘YUVA Plan’.
Enabling paperless, digital onboarding for faster account growth.
Investing in blockchain, T+1 settlements, and smart compliance tools.
Actively participating in SEBI & RBI-led digitization (e-KYC, e-insurance, GIFT city).
Expanding subsidiaries (NDML, NPBL) to boost recurring income beyond core biz.
🌸 Key Positives🌸
Strong free cash flow, high annuity-based revenue visibility.
Lean, tech-driven operations with low employee cost base.
Well-positioned to benefit from India’s growing retail investor base.
Diversified, recurring revenue streams through subsidiaries.
Digital-first strategy ensures scalable, low-cost growth ahead.
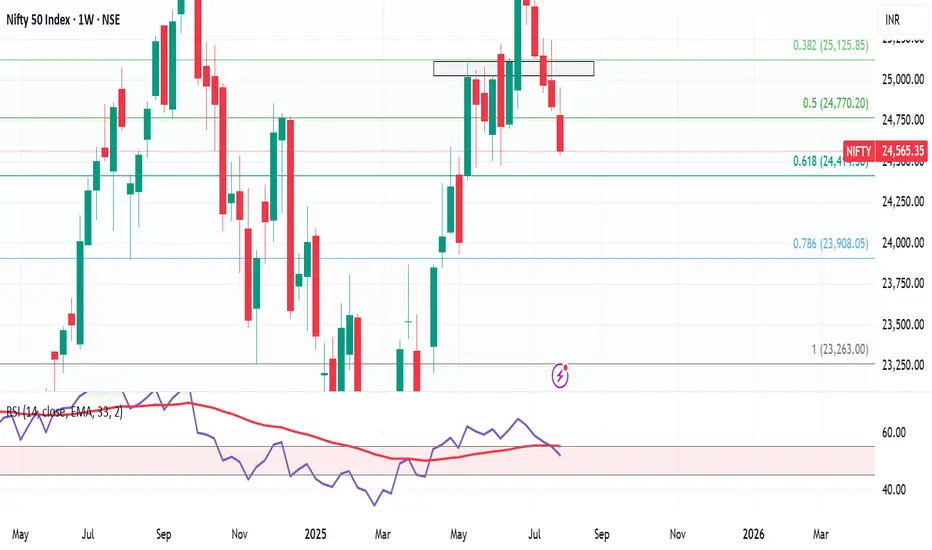
Weekly Market Wrap – Nifty Slides, Global Sentiment WeakensNifty ended the week on a bearish note, closing at 24,565, down 270 points or nearly 1.1% from last week's close. It touched a high of 24,956 and a low of 24,535, perfectly respecting the range I shared last week: 25,300–24,400.
As I highlighted earlier, the inverted hammer formation gave the bears an upper hand—and the index corrected 1.74% from the recent highs. My view continues to favor caution, with the expected trading range for the upcoming week at 25,000–24,100.
Key Levels to Watch:
Support Zone: 24,400 (key bounce area), followed by 24,100 / 23,900 in case of further breakdown.
Resistance Zone: Upside capped near 25,000.
If the market holds 24,400 around 6th–7th August, expect a short-term bounce. However, if this level is breached, expect dips to 24,100 or 23,900, which could offer short-covering opportunities.
Global Cues:
The S&P 500 also had a rough week, closing at 6,238, down 2.5% week-on-week. This decline sparked a wave of selling across global markets. The 6,200 level is crucial—if it holds, we might see a rebound globally, including in Indian equities. Below that, 6,100 remains the breakout retest zone, which I believe should provide some cushion.
💡 Strategy Going Forward:
Focus on stocks showing relative strength in this falling market—they’ll likely lead the rally once sentiment turns.
Avoid chasing rallies, and watch for signs of bottoming out near key support zones.
Keep an eye on global indices like the S&P 500 and Dow Jones, as their stability will dictate near-term direction for Indian markets.
Stay sharp, stay prepared. Let the bears have their moment, but be ready to pounce when the tide turns.
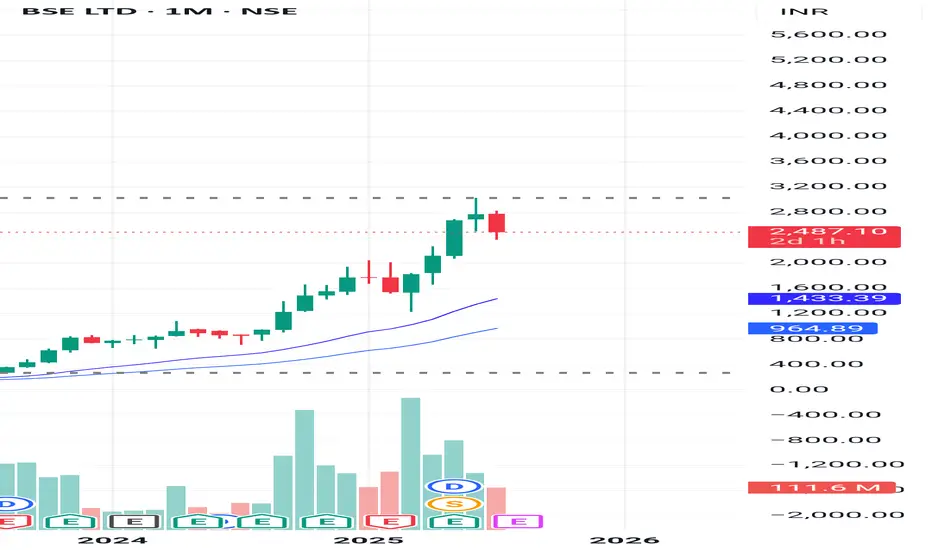
DCF VALUATION ANALYSIS OF BSEConclusion: OVERVALUED
:-OVERVIEW
BSE Limited has shown strong financial growth in recent years. Its revenue jumped from ₹924.84 crore in FY23 to ₹1,592.50 crore in FY24 (a 72% increase), and further surged to ₹3,212 crore in FY25, doubling year-on-year. EBITDA grew impressively to ₹1,779 crore in FY25 with a 60% increase, and EBIT reached ₹1,670 crore, up 56%. Net profit also rose significantly to ₹1,112 crore, with earnings per share increasing to ₹81. Dividend per share improved to ₹23, reflecting healthy returns
DCF:
-The valuation was performed using a Discounted Cash Flow (DCF) approach based purely on verified financial data and market risk parameters without relying on user-specific growth assumptions.
-The cost of equity was calculated using an adjusted risk-free rate plus equity risk premium multiplied by beta, resulting in a discount rate of approximately 13.58%. The terminal growth rate was conservatively taken as 4%. Using these reliable inputs and actual EBIT cash flows, the intrinsic enterprise value was estimated at around ₹36,839 crore, translating to an intrinsic value per share of approximately ₹1,364.
-Currently, BSE’s market price is around ₹2,480 per share, which is substantially higher than the intrinsic value derived from fundamentals, indicating the stock is trading at a significant premium. This valuation is grounded in audited company financials and globally accepted valuation methodologies, providing a trustworthy reference point for investors.
NYKAA<>BreakoutA breakout is occurring with increasing volume. A high-volume close above the 221-222 level would confirm the breakout, potentially from a Cup & Handle pattern.
Keeping on radar.

BAJAJFINSV BUY PROJECTION Bajajfinsv - Buy View
Trade Setup :
Monthly - Strong Support and FIB 0.786
Weekly - Symmetric Triangle Breakout
Day - Higher High Formed (Uptrend)
Entry - Aggressive Trader(Entry Now)
Conservative Trader - 1588 Rs
Target 1 - 1925 Rs
Target 2 - 1971 Rs
Stoploss - 1514 Rs
Expected Return - 20 %

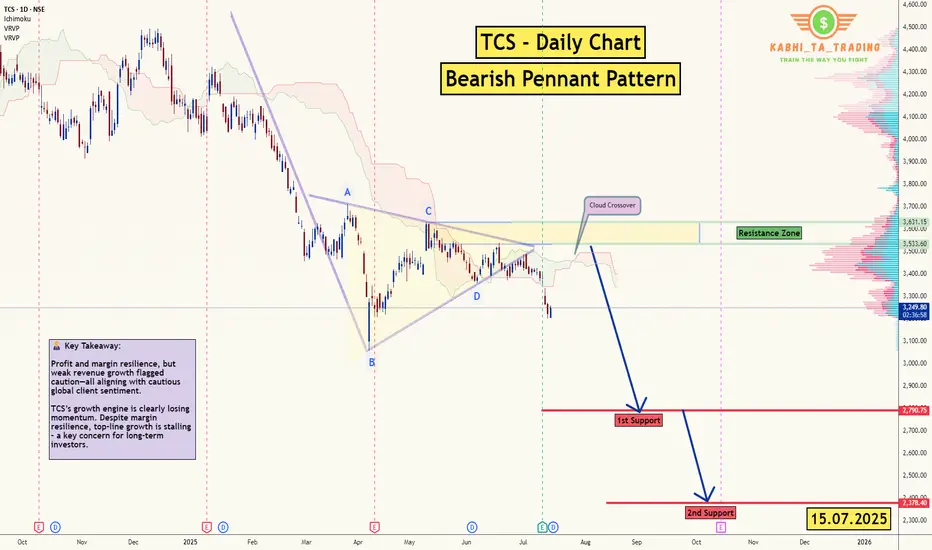
TCS - D1 - Bearish Pennant 🧾 1. 📊 Q1 FY26 Earnings Summary
i. Revenue: ₹63,437 cr (~US $7.4 bn), up just 1.3% YoY, missing expectations of ~₹64,667 cr
ii. Profit/margin held up; revenue disappointed.
📌 Key Takeaway: Profit and margin resilience, but weak revenue growth flagged caution—all aligning with cautious global client sentiment.
🔮 2. Upcoming Events & Catalysts :
Ex‑Dividend Date: Record date July 16, for interim dividend of ₹11/share.
Macro Cues: U.S. tariff developments, global IT spend trends, and sector peers (HCL, Infosys) Q2 reports. Reflation in IT services could shift sentiment.
TCS Investor Engagements: Gen‑AI STEM program (Jul 9); presence at global fintech & life‑sciences events through Sep (SIBOS, COBA) .
📆 3. Catalysts Ahead :
Global IT Budget Trends (esp. U.S. and Europe) → direction for next‑quarter bookings.
Peer Q2 Results (HCL, Infosys) → could provide broader sector cues.
New Deal Wins from BFSI/USD clients → margin & growth potential.
Macro Developments: Trade policies, Fed signals, and inflation data.
Thank you.
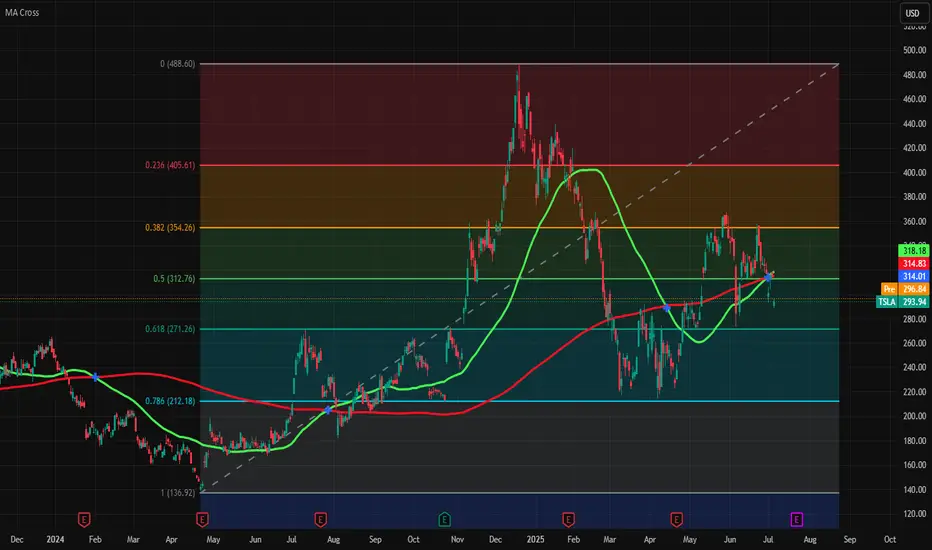
Tesla is on edge of Golden crossTesla is on edge of golden cross (50 and 200 days moving average crossover) and fresh entry is possible above green line of 50 days MA (318.18) and SL is 271 and TP is 354.
If it fall then wait for 271 level or again cross above green line.
Adani Enterprises Weekly Chart Analysis: Bullish ScenarioAdani Enterprises Weekly Chart Analysis: Bullish Scenario
-June 23 Weekly candle close above 200EMA(Bullish)
-EMA 9/21 Bullish cross on May 26
-MACD signal line crossing above zero line -Bullish
-If next couple weeks candles close above Support level i am expecting 3070 as next Buyside target(Long)

SWING IDEA - AJANTA PHARMAAjanta Pharma , a mid-cap pharma player with strong branded generics in ophthalmology, dermatology, and cardiology, is showing a compelling swing trade setup backed by a high-probability technical breakout.
Reasons are listed below :
Bullish engulfing candle on the weekly timeframe, indicating reversal strength
2,500 zone acting as a crucial support
Holding above 0.382 Fibonacci retracement level , suggesting healthy correction
Price trading above 50 & 200 EMA on the weekly chart – long-term strength intact
Breakout from narrow consolidation near the 50-week EMA
Target - 3080 // 3400
Stoploss - weekly close below 2415
DISCLAIMER -
Decisions to buy, sell, hold or trade in securities, commodities and other investments involve risk and are best made based on the advice of qualified financial professionals. Any trading in securities or other investments involves a risk of substantial losses. The practice of "Day Trading" involves particularly high risks and can cause you to lose substantial sums of money. Before undertaking any trading program, you should consult a qualified financial professional. Please consider carefully whether such trading is suitable for you in light of your financial condition and ability to bear financial risks. Under no circumstances shall we be liable for any loss or damage you or anyone else incurs as a result of any trading or investment activity that you or anyone else engages in based on any information or material you receive through TradingView or our services.
@visionary.growth.insights

$NSE:NIFTY is Going to Burst Up Side ! SkyRocketing TIme is NearNSE:NIFTY is Going to Burst Up Side ! SkyRocketing TIme is Near
NIFTY 50 BULLISH REVIEW (My View) 💥
📈 Current Bias: BULLISH
✅ Nifty 50 showing strong resilience above key support levels.
✅ The index is holding well above recent consolidation zones and looks ready for further upside.
✅ Momentum indicators (like RSI) are staying in positive territory, showing sustained strength.
✅ Higher highs & higher lows structure intact on daily chart — bulls in control!
🔑 Key Levels:
👉 Immediate support: 23,333 - (watch for buying interest here)
👉 Resistance ahead: 23,850 - 23,900 (break above = fresh rally potential)
🌟 What I’m Watching:
🚀 Breakout above 23,900 could open doors towards 24,200+ levels in the coming sessions.
🚀 Strong sector participation from banks, IT, and autos — a broad-based rally is a positive sign.
🚀 Keep an eye on global cues + FII activity — may add fuel to the trend.
NSE:NIFTY is Going to Burst Up Side ! SkyRocketing TIme is Near

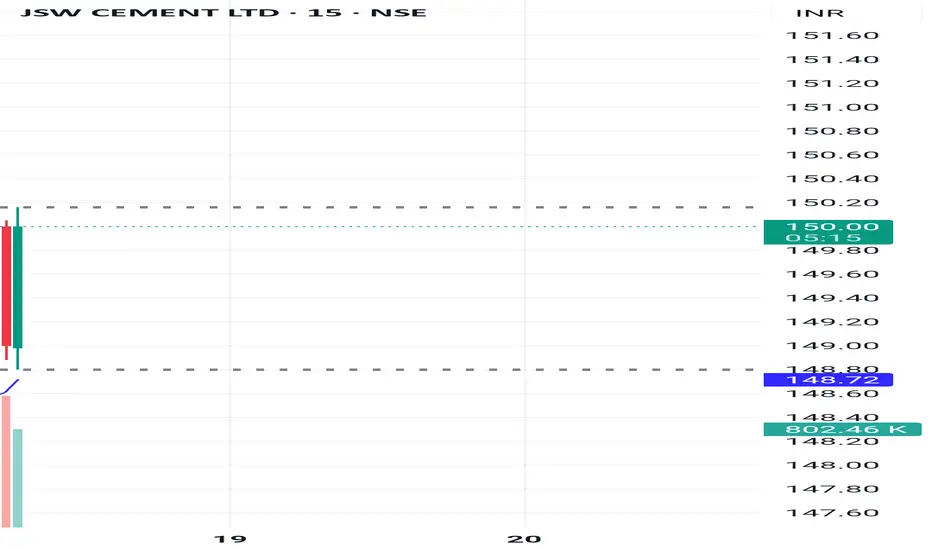
MUKANDLTDMUKAND Daily Chart | CMP ₹152.78
Massive breakout with volume. Price holding above previous resistance ₹150.5.
Structure bullish
TP1 near ₹176.
SL below ₹137.
Trend: Strong Bullish

SWING IDEA - JK LAKSHMI CEMENT JK Lakshmi Cement , a key player in India’s cement sector under the JK Group showing strong technical confluence making this a swing-worthy setup.
Reasons are listed below :
Formation of a bullish engulfing candle on the weekly chart, indicating a potential trend reversal
Strong support from the 50-week EMA , reinforcing medium-term trend strength
Breakout from a consolidation range that lasted over a year, suggesting renewed momentum
Inverse Head & Shoulders breakout , a classic bullish pattern
Target - 1000
Stoploss - weekly close below 795
DISCLAIMER -
Decisions to buy, sell, hold or trade in securities, commodities and other investments involve risk and are best made based on the advice of qualified financial professionals. Any trading in securities or other investments involves a risk of substantial losses. The practice of "Day Trading" involves particularly high risks and can cause you to lose substantial sums of money. Before undertaking any trading program, you should consult a qualified financial professional. Please consider carefully whether such trading is suitable for you in light of your financial condition and ability to bear financial risks. Under no circumstances shall we be liable for any loss or damage you or anyone else incurs as a result of any trading or investment activity that you or anyone else engages in based on any information or material you receive through TradingView or our services.
@visionary.growth.insights

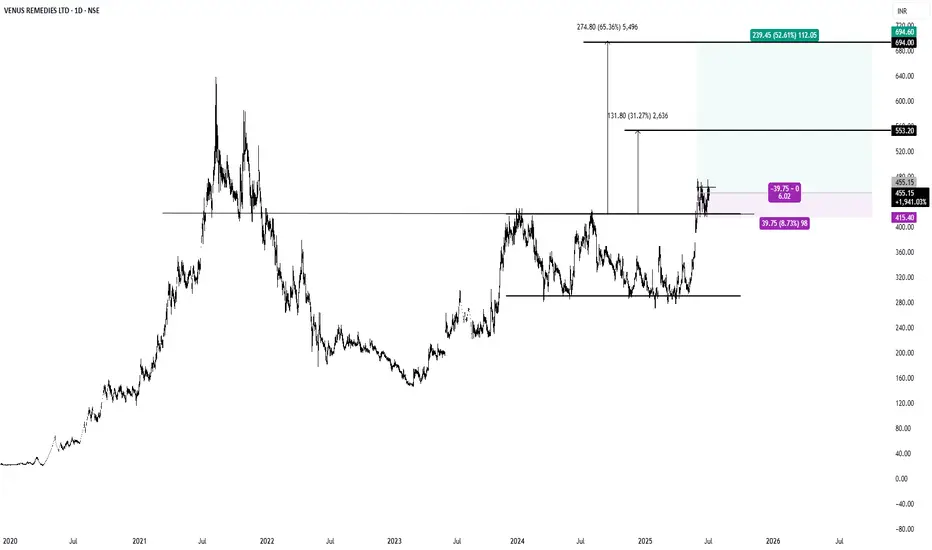
$VENUSREM #INDIA #NSE1. Cup and Handle Break Out.
2. Parallel Channel Break Out.
3.R:R >6 , Tight Stop Loss.

NIFTY is Testing its long term Trend Line.I’ve been keeping an eye on the ‘Watch Out’ area and the trend line that’s being tested. I’ve been following this trend line for a while now, and I’m excited to share some potential scenarios that could unfold in July.
Here are a few things to keep in mind:
1. The 25450 - 25550 range could become a key resistance and support area.
2. If NIFTY successfully retests this trend line and shows some upward movement, the next target could be 26000. In this case, I would recommend buying July 26000 Call options.
3. If NIFTY can’t hold this retest (which is less likely given NSE:NIFTY the current bullish market sentiment), our next watchout zone could be 25000 - 24800.
4. We might even be seeing an all-time high NIFTY soon!
Disclaimer: Please do your own research before investing. This is just my personal opinion, and I don’t force anyone to invest based on my ideas.


NRB Bearing Limited - 290 CMP Short-term Looking good for 100%+Good Buy For Short- Term 1 Year Investment Horizon.
NRB Bearing Limited - 290 CMP
Expected Return - 580 (100)%
Drawdown - 205 (35%)
*This POST for educational purpose only. Concern your advisor before investing in market related instrument...*
- AB_INV_7

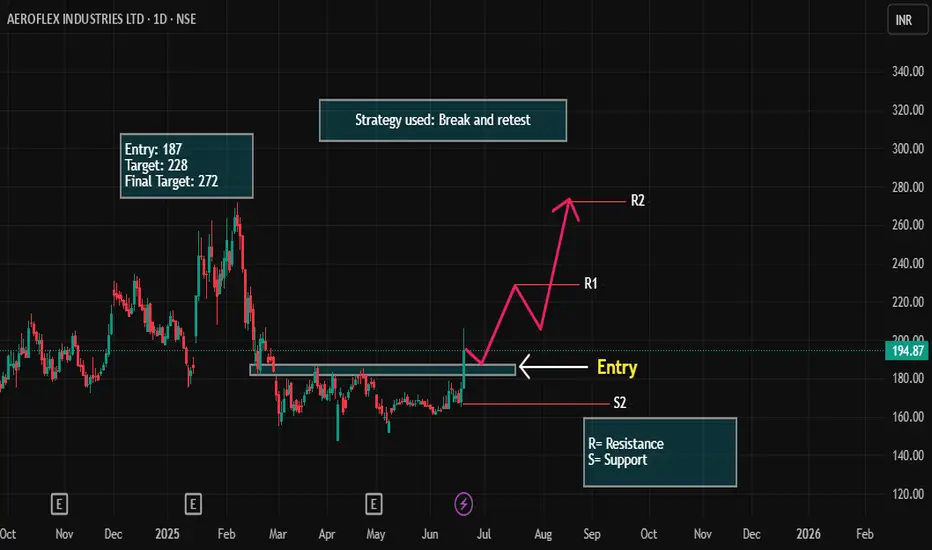
AEROFLEX LONG Setup!Stock: Aerofle (AERF)
Current Market Price (CMP): ₹194
Entry Point: ₹187
Target: ₹228
Final Target: ₹272
Stop Loss (SL): Below Support 2
Trade Setup with Stop Loss:
Entry at ₹187: As mentioned earlier, you plan to enter at ₹187, which is lower than the current market price of ₹194. You're waiting for a pullback to this level, anticipating the stock will rebound from this price and head higher.
Target at ₹228: This is your first price target, where the stock is expected to face resistance. Once the stock hits ₹228, it might experience some pullback or consolidation.
Final Target at ₹272: This is the key level where you're aiming for the stock to reach, assuming the trend continues. ₹272 is your ultimate exit target.
Stop Loss (SL) Below Support 2:
The stop loss is placed below Support 2, which is a lower level of support. By positioning the stop loss here, you're allowing for some price fluctuation, but you’re limiting your downside risk in case the trade doesn’t play out as expected. Support 2 serves as a critical level, and if the price falls below this, it could indicate a reversal or breakdown of the trend.
Why This Setup Works:
Support 2 is your safety net. If the stock breaks below this level, it suggests that the uptrend is invalidating, so exiting with minimal loss is a good risk management strategy.
You're using the break and retest strategy with Support 2 as a critical level to protect against a major downtrend. If the stock holds above ₹187 and moves up to ₹228 and beyond, your risk-to-reward setup is favorable.
KBCGLOBAL Looks bullish!A potential entry is identified at 0.46. The first target is 0.62, representing a +34.78% gain from the entry point. If the upward momentum continues, the long-term target is set at 0.87, offering a total potential gain of +89.13% from the initial entry. This trade presents a strong risk-to-reward profile for both short-term traders and long-term investors. Proper risk management is essential, especially if price action weakens below the entry level.
