NVIDIA – Best Buy of the Decade (4T Record but now resistance)🚀🔥 NVIDIA – Best Buy of the Decade Post #6
💡📉 Great but why am I taking half profits Today?
Back in July 2021, I named NVIDIA "The Best Buy of the Decade. " Today, it just hit a mind-blowing milestone — becoming the first company to reach a $4 trillion market cap. But here's the thing... that happened right at major resistance.
From our initial call in 2021 , to the target at $143.85 drawn via parabola in 2023, to the April 2025 re-entry at $95, it’s all on the chart — and it's been a textbook ride so far.
At the current level of $163.89, we’re pressing into serious overhead resistance. This doesn’t mean the story is over — not even close. But it could mean we take a breather before the next leg higher.
🧭 Targets ahead remain unchanged:
🔹 First stop: $182.85
🔹 Long-term vision: $227.41
What started as a bold macro call in 2021 has now become a multi-year thesis with precision updates along the way. This is post #6 in the NVIDIA journey — and if you scroll back through the chart, each piece has built on the last with clarity and conviction.
🎯 NVIDIA is not just a tech stock — it’s the AI backbone. But every cycle has pauses, and this one looks ready for a short rest before we see the next breakout.
Stay sharp, follow the structure, and honor the parabola.
One Love,
The FX PROFESSOR 💙
Additional info, for those who like to dive deeper into NVDA:
🔍 Technical Breakdown Version
For the chartists and structure followers, here’s the breakdown:
📌 2021: Original call — "Best Buy of the Decade"
📌 2023: First parabola plotted, projecting toward $143.85 — target hit precisely
📌 April 2025: Market offered $95 re-entry — second parabola begins
📌 Now: Price sits at $163.89, testing resistance from both structure and Fibonacci
📌 Next levels:
- $182.85 → Key extension level
- $227.41 → Long-term target based on full parabolic arc
Current structure suggests a possible pause before continuation. No need for panic — parabola remains valid unless structure is broken. Volume still supportive, and price action is following projection beautifully.
🧠 AI Macro Narrative Version
The big picture? NVIDIA isn't just another semi stock — it’s the nervous system of the AI revolution.
From gaming → crypto → AI, NVIDIA has consistently been first to adapt, and now it’s the leader in AI hardware infrastructure. The $4 trillion milestone is more than symbolic — it represents capital reallocation toward AI as the next dominant sector.
🧠 Key macro takeaways:
AI demand is insatiable
Data centers need NVIDIA
Generative AI isn't slowing down
Institutions are still buying — not selling
The resistance we see now isn’t weakness — it’s the market pausing to digest before another acceleration. Just like every past cycle... we ride, retrace, reload, and resume.
Disclosure: I am happy to be part of the Trade Nation's Influencer program and receive a monthly fee for using their TradingView charts in my analysis. Awesome broker, where the trader really comes first! 🌟🤝📈
NVDA

Nvidia Stock Fails to Return to the $200 LevelAlthough Nvidia seemed poised to start the week with an optimistic bias, partly driven by the end of the U.S. government shutdown, which has generated a short-term confidence boost, the stock has begun to show a bearish tone in the current session, posting a decline of more than 2%. This weakness is mainly due to recent comments from the SoftBank Group, which sold its entire stake in Nvidia for approximately US$ 5.8 billion, raising concerns about a possible reduction in exposure to the semiconductor industry in the short term. This event has led to growing investor caution toward the stock and currently maintains a notable selling bias in the market.
Uptrend Tries to Hold
Despite recent downward corrections that have halted the stock’s steady advance, Nvidia has yet to show a decisive bearish move that would end the long-term uptrend line. In the broader picture, buying momentum continues to hold firm. However, if selling pressure continues to strengthen, the uptrend could be at risk, especially if the price falls below the 50-period moving average.
RSI
The RSI indicator line is gradually approaching the neutral level of 50, suggesting a balance between buying and selling forces over the last 14 trading sessions. As long as this equilibrium remains, the stock is likely to continue showing indecisive movements in the coming days.
TRIX
The TRIX indicator remains above the neutral level of 0, indicating that in the long-term outlook, bullish strength continues to dominate the average of exponential moving averages. As long as the TRIX stays above this level, the bullish bias may remain intact, allowing the uptrend line to continue defending its position over the coming weeks.
Key Levels to Watch:
208 USD – Major Resistance: Corresponds to the area of recent highs. Price movements breaking above this level could trigger stronger buying pressure, reinforcing the current uptrend.
200 USD – Nearby Resistance: A key psychological level. Price action above this zone would reactivate a short-term bullish bias and reduce the risk of a trendline breakdown.
184 USD – Key Support: This is the most relevant support area, coinciding with the 50-period moving average and the Ichimoku cloud, which increases its significance. Downward movements reaching this zone could end the long-term bullish structure and lead to a period of indecision or the formation of a short-term consolidation range.
Written by Julian Pineda, CFA, CMT – Market Analyst

TSLA Catalysts Ranking: Q1 2026 Outlook PT 600 USD________________________________________
TSLA: Updated Outlook (Nov-2025)
Here's an updated/revised outlook for TSLA including all the primary
catalyst ranking and analyst ratings and overview of latest developments
this was updated for Q1 2026 with all the viable market data.
________________________________________
🤖 1) Autonomous & Robotaxi Execution — 9.2/10 (↑)
• What changed: Tesla’s invite-only Austin robotaxi pilot kept running through the summer; Tesla also says it launched a Bay Area ride-hailing service using Robotaxi tech (Q3 deck). FSD v14 (Supervised) began rolling out in Oct with broader model upgrades; Tesla claims billions of supervised miles and AI training capacity lifted to ~81k H100-equivalents.
• Offsetting risk: NHTSA opened a fresh probe (Oct-2025) into ~2.9M Teslas over traffic-safety violations when using FSD; investigation cites 58 reports incl. crashes/injuries.
• Why the bump: Real pilots in two metros + visible AI scale-up keep autonomy the center of the bull case—even with elevated regulatory risk.
________________________________________
🌍 2) EV Demand & Geographic Mix — 8.6/10 (↘ )
• What changed: Q3-25 delivered record vehicles and record energy storage deployments, with record revenue and near-record free cash flow. Still, we’re past the U.S. tax-credit pull-forward and China/Europe pricing remains competitive.
• Read-through: Momentum into Q4 looks better than 1H-25, but regional price discipline and mix will matter.
________________________________________
💸 3) U.S. EV Tax Credits & Incentives — 6.0/10 (↘)
• What changed: Federal new/used EV credits ended for vehicles acquired after Sept 30, 2025 under OBBB. Buyers can still qualify if a binding contract + payment was made by 9/30 and the car is placed in service later (“time-of-sale” reporting). This creates a limited after-deadline tail into late ’25/early ’26 but the program has sunset for new acquisitions.
• Implication: Pull-forward demand helped Q3; near-term becomes tougher without the credit.
________________________________________
📉 4) Rates & Credit Conditions — 6.5/10 (↔)
• Rate-cut expectations have eased financing costs M/M, but absolute affordability still binds EV uptake. (Macro-sensitive; no single decisive print.)
________________________________________
🎯 5) Affordable Model / Next-Gen Platform — 8.0/10 (↔)
• Q3 deck emphasized Model 3/Y “Standard” variants to expand entry price points; true next-gen remains staged, with execution risk.
________________________________________
🔋 6) Battery Cost & Margin Levers — 8.3/10 (↑)
• What changed: Q3 total GAAP GM improved vs 1H; energy revenue +44% YoY; free cash flow ~$4.0B. Scale/learning and supply-chain localization called out.
________________________________________
⚡ 7) Energy, AI & Optimus Optionality — 8.7/10 (↑)
• Record storage deployments, Megapack 3 / Megablock unveiled; expanding AI inference/training and a U.S. semi-conductor deal noted. This is the clearest re-rating vector beyond autos.
________________________________________
🛡️ 8) Safety, Regulatory & Governance Risk — 7.5/10 (risk) (↑ risk)
• New NHTSA probe into FSD reporting/behavior escalates headline risk; audit scrutiny persists. Interpret higher score here as more material risk to multiple.
________________________________________
🚩 9) Competition & Global Share — 6.2/10 (↔)
• Competitive intensity in China/EU remains high; Q3 execution improved but pricing power still contested.
________________________________________
🌐 10) Macro & Trade/Policy — 6.5/10 (↑)
• Policy shifts (e.g., OBBB tax-credit sunset; tariff/trade uncertainty) remain a swing factor for cost & demand corridors.
________________________________________
✅ 11) Commodities/Inputs — 5.5/10 (↔)
• Mixed moves across lithium/nickel; no single driver eclipses execution/AI narrative near term.
________________________________________
Updated Catalyst Scorecard (ranked by impact)
1. Autonomous & Robotaxi Execution — 9.2
2. Energy, AI & Optimus Optionality — 8.7
3. EV Demand & Geographic Mix — 8.6
4. Battery Cost & Margin Levers — 8.3
5. Affordable Model / Next-Gen — 8.0
6. U.S. EV Incentives — 6.0
7. Rates & Credit — 6.5
8. Macro/Trade — 6.5
9. Competition/Share — 6.2
10. Safety/Reg/Gov Risk — 7.5 (risk flag)
11. Commodities — 5.5
(Key Q3 facts from Tesla’s deck; probe/tax-credit items from NHTSA/IRS reporting.)
________________________________________
📊 Analyst Rankings & Price Targets
• Street consensus (near-term 12-mo): ~$391 average target; consensus rating: Hold across ~46 firms.
• Bull camp: Wedbush (Dan Ives) $600 PT (reiterated Nov-5; Street-high; thesis = embodied-AI/robotics optionality + robotaxi). Benchmark $475 Buy (post-Q3).
• Cautious/negative: UBS $247 Sell (raised from $215 but still bearish on deliveries/margins).
• Tape-check from Tesla: Q3-25 revenue $28.1B, non-GAAP EPS $0.50, record FCF, record deliveries & storage. (EPS miss vs some expectations; revenue beat.)
________________________________________
🔍 Headlines that moved the needle
• NHTSA opens new FSD probe (scope ~2.9M vehicles).
• FSD v14 (Supervised) broad rollout; AI capacity to ~81k H100-eq; Bay Area robotaxi ride-hailing noted (Q3 deck).
• OBBB EV tax credits sunset 9/30/25; binding-contract/time-of-sale guidance enables limited post-deadline claims.
• Q3 print: record deliveries, record energy storage, record FCF; EPS light vs some models but narrative shifts to AI/energy.
________________________________________
🧭 Technicals: Levels & Structure (weekly focus)
Primary structure: since late-2022, TSLA’s traded inside a contracting wedge, with noteworthy compression into 2H-2025—typical of late-stage accumulation before a decisive break. Momentum divergences are improving on weekly frames even as price consolidates.
________________________________________
Key levels (spot-agnostic):
• Support: $360–$370 (prior breakdown area/weekly shelf); $330–$345 (multi-touch base/pivot); $310–$320 (cycle risk zone).
• Resistance: $405–$420 (range top & supply), $450–$475 (post-robotaxi pop zone / analyst PT cluster), $500 (psych), then $600–$650 (LT measured target band).
• Roadmap Expect one more downside probe into $310–$320 in Q1-2026 to complete the wedge, then trend break and resume bull leg toward $600/$650 over the subsequent cycle (≈ ~100% off the projected low).
• Risk markers: sustained weekly closes < $305 would postpone the “final low” timing and force a re-mark to the 200-week MA cluster; weekly closes > $475 accelerate the upside timing toward the $500/$600 handles.
________________________________________
Cases unchanged framework
• Bull: Robotaxi expands to more metros, regulators settle into a supervised-AV regime, energy/AI scale continues; market re-rates to $475–$600 (Benchmark/Wedbush anchors).
• Base: Solid execution across autos + energy, FCF stays healthy, autonomy rolls out cautiously under oversight; stock tracks Street $350–$400 band.
• Bear: Delivery softness post-credit-sunset, tougher pricing in China/EU, or adverse NHTSA actions; retest of $300–$330 zone before trend resolution.
________________________________________
What to watch next (60–90 days)
1. NHTSA probe path and any software/recall remedies.
2. Robotaxi geographic expansion cadence and any shift from safety-monitor to remote-assist ops.
3. Energy bookings & Megapack 3/Megablock ramp against utility RFP calendars.
4. Delivery run-rate post-credit sunset and mix of Standard trims.
________________________________________

NVDA (NVIDIA) – Buy PlanNVDA (NVIDIA) – Buy Plan
📊 Market Sentiment
On October 29, the FED lowered rates by 25bps as expected. However, Powell’s remarks introduced uncertainty around further cuts in December, emphasizing that future policy will depend on incoming data.
One FED member dissented, preferring no cut this cycle — a notable shift from September’s unanimous decision.
Additionally, ADP Non-Farm Employment Change came at 42K versus 32K expected. It’s slightly higher, but since other macro data are missing due to the U.S. government shutdown, the overall sentiment remains mixed.
For now, macro sentiment leans bearish, as rate cuts may be delayed into 2026.
However, with NVDA earnings approaching, we could see a short-term bullish sentiment building around the stock.
📈 Technical Analysis
NVDA is currently trading around the 0.5 equilibrium zone, which aligns with the HTF bullish trendline.
This area could provide temporary support and a potential bounce setup.
However, it’s crucial to watch the SPY structure as it may influence NVDA’s short-term movement.
📌 Game Plan / Expectations
I’ll be watching the $185–$180 range as a key HTF support zone.
This area also aligns with a possible trendline deviation, where price could manipulate below the trendline to trap sellers before reclaiming it.
I plan to buy call options within this range, targeting a continuation of the bullish leg post-earnings.
💬 If this breakdown aligns with your outlook, like and comment below.
For deeper sentiment and strategy insights, subscribe to my Substack — free access available.
⚠️ Disclaimer
This analysis is for educational purposes only and does not constitute financial advice. Always conduct your own research before trading or investing.

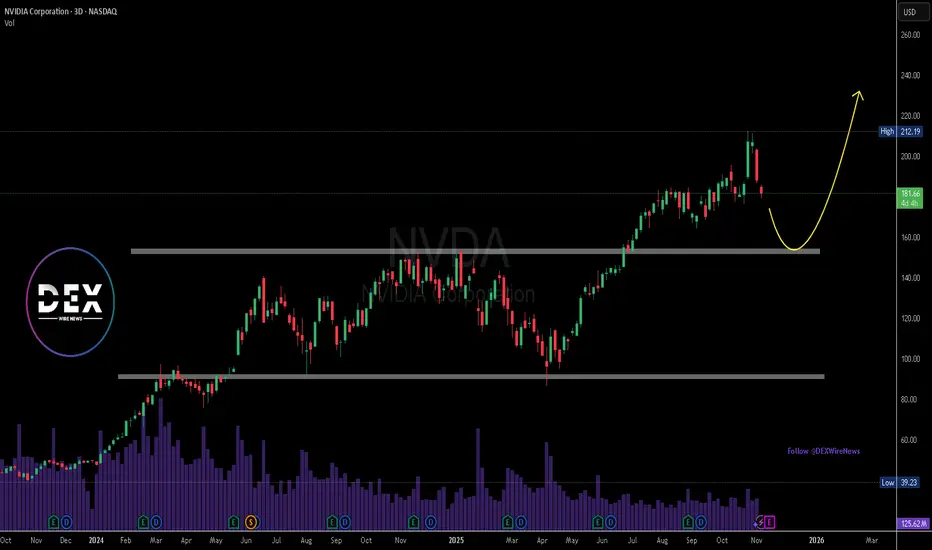
$NVDA NVIDIA CORPORATIONExecutive Summary:
NVIDIA Corporation ( NASDAQ:NVDA ) has demonstrated remarkable resilience and sustained growth over multiple market cycles, consistently defending its leadership position despite intense competition within the semiconductor and AI sectors. This analysis outlines a structured, multi-layered support framework derived from Fibonacci retracement theory, which identifies strategic price levels for potential entry. Our primary area of interest converges around the $150.00 psychological level, which aligns with a key Fibonacci midpoint and is anticipated to serve as a robust zone for buyer participation.
Detailed Technical Framework:
1. A History of Defending Its Turf:
NVDA's impressive performance is not merely a function of bullish markets but a testament to its fundamental dominance, particularly in the parallel processing and AI revolutions. The company has repeatedly validated its market strength by navigating competitive threats and leveraging its technological moat, which in turn has created a foundation of strong investor confidence. This fundamental strength is often mirrored in its technical charts, where pullbacks are frequently met with aggressive buying at key value areas.
2. The Fibonacci Support Ladder: A Tiered Defense System
By applying Fibonacci retracement levels to a significant prior upward swing, we can map a hierarchy of potential support zones. These levels do not operate in isolation but represent a cascading series of defenses where buyers have historically stepped in. Our analysis identifies the following critical tiers, from shallowest to deepest:
First Line of Defense (Shallow Pullback):
23.6% Level ($182.53): This level represents a mild, healthy pullback. A hold here would signify exceptionally strong momentum and would likely be a continuation pattern rather than a deep correction.
Secondary Support Zone (Moderate Correction):
38.2% Level ($164.02): A retracement to this level indicates a more pronounced correction but remains within the bounds of a strong uptrend. This is a common level for institutions to begin accumulating positions.
50.0% Level ($149.39): The halfway point of the prior major move is a critical psychological and technical battleground. A successful bounce from this level suggests the overall bull trend remains intact and that market sentiment has found a balance.
Tertiary & Deep Value Zones (Significant Correction):
61.8% Level ($134.58): Known as the "Golden Ratio," this is a deep retracement that often holds in volatile but fundamentally sound assets. A test of this level would indicate a major correction is underway, presenting a higher-risk but potentially high-reward entry point for long-term believers.
78.6% Level ($113.49): This is a deep, rarely-tested retracement level. A move to this zone would signal a severe market downturn or a fundamental reassessment of the stock, but it would also represent a potentially profound long-term value opportunity.
The Ultimate Major Support:
The $100.00 Psychological Level: Beyond the Fibonacci structure, the triple-digit benchmark at $100.00 stands as a monumental psychological and technical support. It represents a round number that often attracts immense buying interest and would be considered a "line in the sand" for the long-term thesis.
3. Primary Strategic Interest & Risk Management:
While the Fibonacci ladder provides multiple potential entry points, our primary area of strategic interest converges around the $150.00 level. This is not a single price point but a zone encompassing the 50% Fibonacci level at $149.39. The rationale for favoring this zone is twofold:
Technical Significance: It is a classic "value area" in a strong trend, offering a favorable balance of potential upside and managed risk.
Psychological Strength: The $150 level is a major round number that is easy for the market to identify and act upon.
A decisive reversal at or near this $150 zone, confirmed by bullish price action (e.g., hammer candlesticks, increased volume on up-days), would provide a strong signal for capital deployment. As with any investment, this thesis requires disciplined risk management; a sustained break below the deeper supports, particularly the $134.58 (61.8%) level, would necessitate a re-evaluation of the near-term bullish outlook.

Stock Market Forecast | TSLA NVDA AAPL AMZN META MSFTStock Market Forecast | CME_MINI:NQ1! CME_MINI:ES1! SP:SPX NASDAQ:NDX
Mag 7 | TSLA NVDA AAPL AMZN META MSFT

Nvidia Corp.($NVDA) Drops as U.S. Blocks AI Chip Sales to China Nvidia Corp. (Nasdaq: NASDAQ:NVDA ) shares dropped 4.18% to $180.22 on Friday after reports that Washington will block the company’s sales of scaled-down AI chips to China. The decision marks another escalation in U.S. restrictions on advanced semiconductor exports.
According to The Information, the White House informed several federal agencies that Nvidia will not be allowed to sell its new B30A AI chip to Chinese firms. Nvidia had already provided samples to some customers in China before the ban was confirmed.
The B30A was designed to meet U.S. export thresholds while retaining enough computing power for AI training when used in large clusters. However, U.S. officials reportedly concluded that the chip still poses national security risks.
Compounding Nvidia’s challenges, Beijing has issued new guidelines restricting foreign chips in state-backed data centers. Reuters reported that China will require all new projects using government funding to rely solely on domestically developed processors. Data centers less than 30% complete must remove foreign chips, while advanced projects will face case-by-case reviews.
Technical View
The NVDA chart shows a recent rejection from the $212 level, with price sliding toward $180. A further decline toward $160 support is possible before a rebound, as indicated by the yellow curve. Long-term structure remains bullish, but near-term weakness persists under regulatory pressure
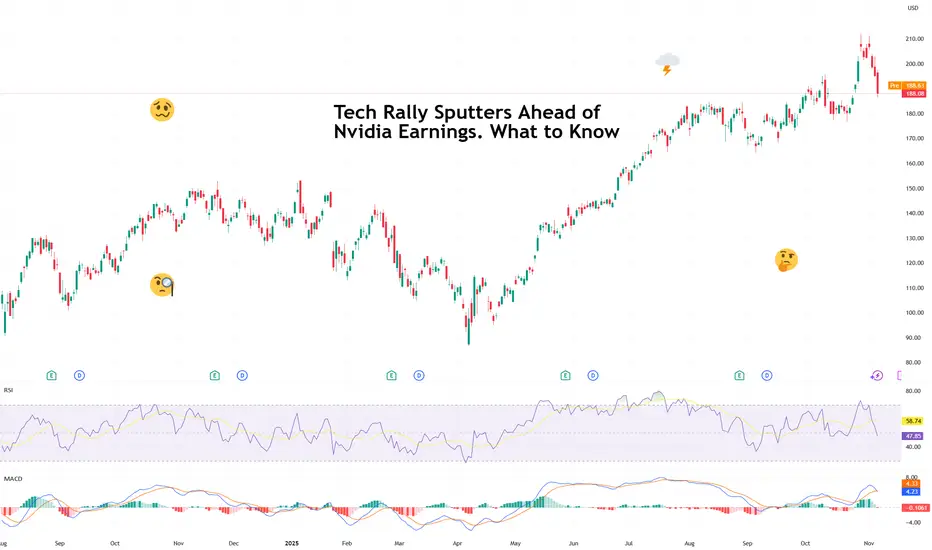
Tech Rally Sputters Ahead of Nvidia Earnings. What to KnowIs the powerful AI sector finally out of breath? With valuations that stretched, some investors fear if we all took it too far.
After months of seemingly unstoppable gains, the tech trade is finally showing signs of fatigue. Stocks are back in the red this week, with technology — the sector that’s carried the entire market on its silicon shoulders — leading the declines.
The S&P 500 SP:SPX , up more than 35% since its April lows and boasting 36 record closes this year, has been powered almost entirely by a handful of tech heavyweights.
The Magnificent Seven now make up nearly 40% of the index’s market value and roughly a third of its earnings.
But now, investors are wondering if the rally’s run too far, too fast. The question echoing across trading desks: Is AI finally out of breath?
💸 The Price of Perfection
It’s not that tech earnings have been bad — in fact, they’ve been stellar. Microsoft NASDAQ:MSFT , Amazon NASDAQ:AMZN , Meta NASDAQ:META , and Alphabet NASDAQ:GOOGL all beat expectations last week and promised even more AI spending next year. Translation: more orders for Nvidia’s chips, more data centers, more server farms, more everything.
But good news isn’t moving the needle right now. When valuations stretch this far, even “great” can start to look “meh.” Investors are realizing that the higher you climb, the thinner the air gets.
The entire AI complex — from semiconductors to cloud computing — now trades at multiples that assume not just perfection, but sustained, exponential perfection. And that’s a tough sell when rates are still relatively high, inflation is sticky, and the Fed remains data-deprived thanks to a looming government shutdown (now the longest in history).
🧠 Nvidia: The Market’s Favorite Crystal Ball
Which brings us to Nvidia NASDAQ:NVDA — the stock that can save the day. The chipmaker reports fiscal third-quarter earnings on November 19, and it’s shaping up to be a defining moment for the entire market.
Expectations are sky-high: analysts see earnings per share of $1.25, up from $0.81 a year ago , and revenue of $54.6 billion, a jaw-dropping 56% increase from last year’s $35 billion.
If Nvidia delivers (again), it could reignite the rally and remind investors why they fell in love with AI in the first place. But if there’s even a hint of deceleration — a cautious forecast, a whisper of supply constraints — the selloff could accelerate.
Simply put: as goes Nvidia, so goes the market. Fast fact: Nvidia washed out more than $450 billion from its valuation in just the last three days .
🔌 The Waiting Game
With two long weeks until Nvidia’s report, traders are stuck in a sort of limbo. Without a fresh catalyst, the market could decide to churn sideways — or drift lower — as profit-takers cash in on their massive gains.
The uncertainty isn’t helping either. A government shutdown delays key economic data, leaving the Fed flying in the dark just as investors are trying to gauge when rate cuts might actually arrive.
That means more guesswork, less conviction, and a good chance of exaggerated market swings.
So don’t be surprised if volatility ticks higher before Nvidia’s big reveal — the gem of the earnings calendar .
Off to you : How do you see the next two weeks unfolding? And, more importantly, are you bullish or bearish on Nvidia’s earnings report?
Nvidia: Acceleration Toward New Highs Nvidia gained strong upward momentum shortly after our last update, surging past the $196.45 mark, which had previously served as resistance. As a result, our prior short-term alternative scenario was triggered, and we have now adjusted the chart accordingly (with minor modifications). We now view the green wave as complete and believe that the joint top of green wave and beige wave III, as well as the low of wave IV, have already been established. The Target Zone we had initially set for the wave- low has therefore been removed. In our updated short-term alternative scenario, we still see a 30% probability of a new low for beige wave alt.IV below the $176.21 support level. In this case, however, price would likely rebound above the lower $145.50 level.

NVDA Bull Flag: Breakout Toward 220–230NVDA’s 1D chart remains firmly bullish. Price cleared the ~$195 “BOS” and pushed to fresh highs above $205, with MA20 > MA60 > MA120 and widening bands supporting momentum. The near-term map is clear: Demand sits around $183 (former ceiling turned floor), while supply is forming at the new swing high near $209.50.
Primary path: I’m looking for continuation on strength. A daily close above 209.50 would confirm buyers in control and opens room toward 220–225, with a stretch scope to 230 if momentum persists. If price hesitates first, a constructive retest of 195–198 (prior breakout area) can serve as the higher-low buy zone—especially if volume firms and intraday closes reclaim $200–203 quickly.
Alternative: Failure to hold recent gains brings a deeper check. A daily close below 203.00 risks a slide toward the $200 psych handle and then $195–198. The broader bullish thesis is invalidated on a decisive daily close below 183.00, which would mark a clear break of structure and shift the bias back to neutral/bearish until reclaimed.
Triggers to watch: daily close > 209.50 for continuation; weakness below 203.00 for a corrective leg. Manage entries around 195–198 or on strength through 209.50, and keep risk tight relative to 203/183 lines. This is a study, not financial advice. Manage risk and invalidations.

$NVDA Tradespoon – Long Entry $205.93Tradespoon model issued a long signal for NASDAQ:NVDA . Predicted range: $199.21–$209.01. Trend: +0.36%. NASDAQ:NVDA

LightWhenever I prepare an idea to publish, well... I don't prepare.
As you may already have realized, my "blog" is not about trading / investment analysis. It is an attempt of mine to describe the indescribable. To smell the un-smellable (like a Greek song said).
My first ideas were an attempt of mine to reach out to others to spark conversation.I wasn't trying to give out any meaningful insight, because I had none. Now I think I have information to share, but Socrates would not agree with me, he is certain that he knows nothing . Since I cannot / don't want to be like Socrates, I will be like Diogenes the Cynic, I like him more... His views on philosophy and the world have grown on me.
And speaking of grown...
Apple has grown. From a seed of a Macintosh in a wooden box, into to a computer that would destroy Orwell's 1984, and then to a pair of smart glasses that would become the dystopia they tried to avoid.
Traders have also grown, most only in their age and appetite. The minds stood still.
And prices have grown higher and higher, but lighter than ever before.
Many analysts develop indicators in reverse. They want profit and shape indicators in a way to satisfy this growing appetite. The appetite of the man who isn't satisfied with the few, cannot be satisfied with the many. I have done this myself in the past.
There are two ways this chart is misleading.
First: Price on top of Bollinger Band can be interpreted as a "strong push", and at the same time an "overextended price". The indicator by itself is not misleading. It is us who don't analyze it properly.
Second: While this indicator calculates a statistical deviation (a pure mathematical idea), it fails in the act. Statistical deviation of trending prices cannot be calculated with ordinary moving averages. Don't listen to me, listen to the scientists from whom I found this, research it yourselves. A secondary problem is log scale.
A portion of traders, whom I call gamblers have grown light minded, it seems. They don't want prices to ... slide backward into oblivion, just as (we / they) have finally begun to see the light.
And just like gamblers, lighter my charts have apparently become. I simply try to shed some light into the darkness of technological / artificially untelligent societies.
Since my publications of indicators have been buried in the darkness, now it is time for them to shine, in simple terms.
And so, fixing analysis needs many steps. I show again the original statistical band:
Our data lives in a log-scaled world of increasing proportions, not increasing amounts. So, we re-shape our/Bollinger's mathematics to survive in this wild world of massive numbers. We then conclude to the log-scaled band:
One of the major problems however has not been fixed. Mathematicians dictate that classical moving averages don't apply in "Time Series Data" i.e. price history. Statistics don't work in trending data.
To fix this issue I have constructed a simplified MA model and applied it in multi-timeframe price data using PineScript.
The MA-Model is not a moving average (it doesn't describe an average price). It is instead one of the infinite trend-nullifying lines, from the base of which statistics are calculated. The band is the same 2-sigma area like the classic Bollinger.
What is the conclusion of this chaotic story, I hear you say...
It is either too simple or too complex.
The simple explanation is that history repeats itself.
Going back to 1998, we see the following:
Price divergences have become apparent from statistics. On the first arrow of each one, price reaches a 2-sigma deviation. On the second arrow of each divergence, price fails to make a second deviation jump, price instead returns to mean.
It is as if prices move in two steps. First they define a trend from a 2-sigma event (either bullish / bearish), then they follow up on the trend, while reverting to mean.
Now in 2025, in a larger timeframe, Apple seems to crave bitter sweets.
The 1998-2000 bubble is dwarfed from this massive chart.
Apple has done it. From the bottom of the world and a sub 1% market share, to conquer the world. It is the most loved brand. Sells the most popular smartphone. Designs the most powerful chips. Shapes future trends. And ironically, this very idea is typed on a modern Apple device.
You have reached the top, when everyone is sure that you will live forever.
And I mean everyone, including me who hypocritically votes against them.
The drop will come when a single person changes their mind.
Be wise. Be safe. Be aware.
-Breen
P.S. I will follow up this idea with some interesting charts on SPX in the following days.

Stock Market Forecast | TSLA NVDA AAPL AMZN META MSFTStock Market Forecast | CME_MINI:NQ1! CME_MINI:ES1! NASDAQ:NDX SP:SPX
Mag 7 | TSLA NVDA AAPL AMZN META MSFT GOOGL

170 soon?Looks bearish, if it looses 250 then most likely it will hit 170. This may happen with in 1-2 months. 150-170 might be a good price point to buy.
Not a financial advice.
All the best !!

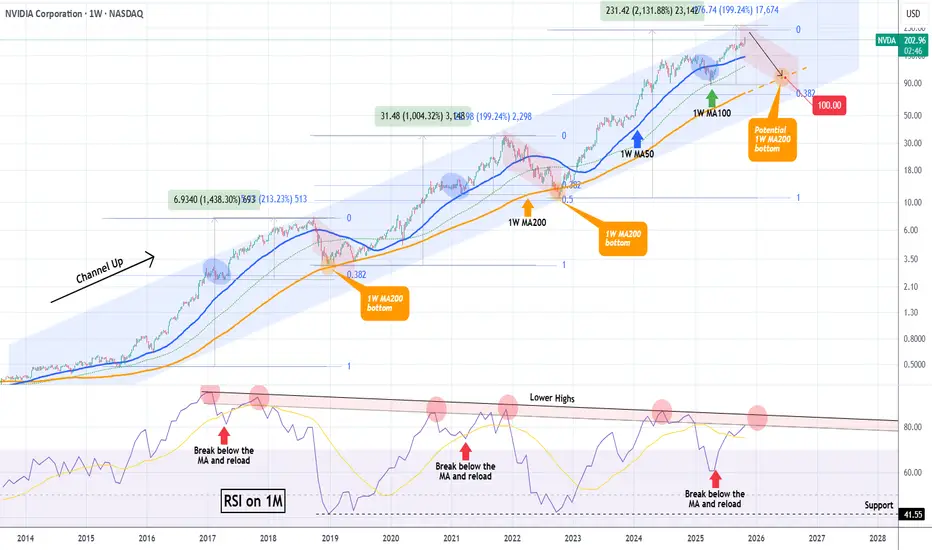
NVIDIA hit $5 Trillion but the end of the rally may be near.NVIDIA Corporation (NVDA) broke this week the $5 Trillion market cap barrier, becoming the first company to do so. In the meantime, it is extending the rally that started on the April 07 Low on the 1W MA100 (green trend-line), following the end of the Tariff War.
This rally has been nothing more than a part of the larger technical Bullish Leg inside the 10-year Channel Up that NVIDIA has been trading in. Within this pattern, the price has had rather asymmetric Bullish Legs in terms of rise % but has always been rejected at the top of the Channel Up and corrected back to the 1W MA200 (orange trend-line).
Following the mid-Bullish Leg corrections to the 1W MA50 (blue trend-line), the final rallies of the Bullish Legs before their Tops have been around +200%. Then their corrections/ Bearish Legs have always hit the 1W MA200 (as mentioned), with one time bottoming just above the 0.382 Fibonacci retracement level and the other below it (0.5 Fib).
We previously had NVIDIA's top at around $240, which is slightly below this expected +200% rise from the 1W MA100 bottom. As a result, we project that a potential contact with the 1W MA200 for the 2026 Bearish Leg can be achieved around $100, which is above the 0.382 Fib, similar to 2018.
Note that a very reliable Top indicator has also been the 1M RSI and its 9-year Lower Highs Zone. Every time the RSI entered the Zone and then broke below its MA (yellow trend-line) and rebounded, the next hit was the Bullish Leg's Top. Right now the 1M RSI is about to enter this Zone for the second time, indicating that we may be approaching the end of this long-term rally.
-------------------------------------------------------------------------------
** Please LIKE 👍, FOLLOW ✅, SHARE 🙌 and COMMENT ✍ if you enjoy this idea! Also share your ideas and charts in the comments section below! This is best way to keep it relevant, support us, keep the content here free and allow the idea to reach as many people as possible. **
-------------------------------------------------------------------------------
💸💸💸💸💸💸
👇 👇 👇 👇 👇 👇
NVDA Bullish Breakout: Retest or Close Above 212.19 Toward 225NVDA’s daily chart remains firmly bullish after a clean breakout from a multi-month rectangle. Price is riding a MA20 > MA60 > MA120 stack, Bollinger Bands are expanding, and MACD momentum has flipped higher. The last close near $207.04 came on strong breadth, keeping buyers in control while price consolidates just under the recent high.
Primary path: look for a controlled pullback into the former ceiling at $198.00–$202.00 to act as demand. A constructive reaction there keeps the breakout intact and favors a grind into $210–$215 first, with the measured move pointing toward $225 as momentum persists. Alternatively, strength can skip the retest— a decisive daily close above $212.19 would confirm continuation and unlock the same upside roadmap.
Invalidation sits below the range top: a daily close back under $195.00 would negate the breakout and re-open downside toward the prior consolidation zone, with risk of a slide toward the $188 area if sellers press. Until then, the bias stays bullish with $198.00–$202.00 as the key line in the sand and $212.19 the trigger for fresh highs.
This is a study, not financial advice. Manage risk and invalidations

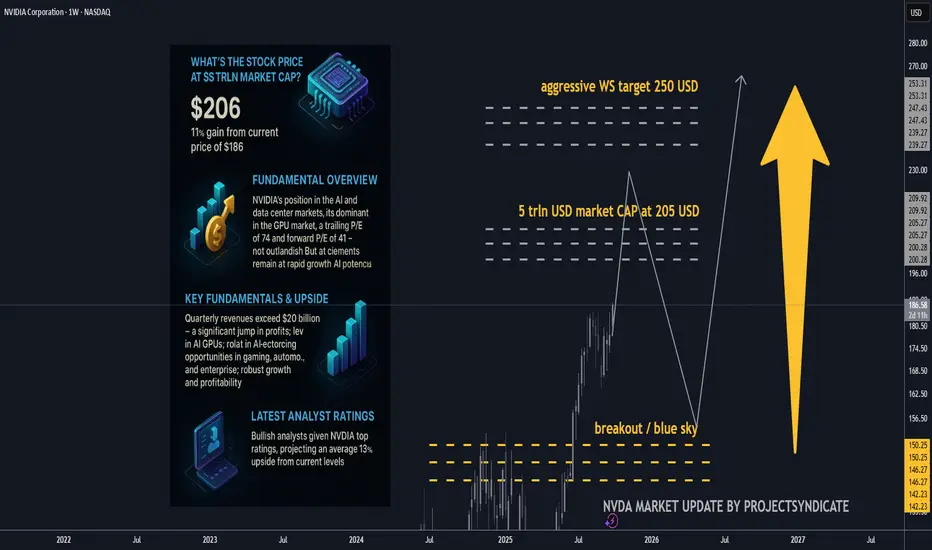
NVDA 5 trln USD market cap up next? Key fundamentals and upside.Is $5T reasonable for NVDA?
• Mechanically, yes: The market only needs ~10% near-term appreciation from today’s levels to print $5T. That’s within one strong quarter or a guidance beat.
• Fundamentally, the math works if (a) FY26–27 revenue tracks the guide/Street trajectory (TTM already $165B with Q3 guide $54B), (b) non-GAAP GMs hover low-to-mid-70s, and (c) opex discipline holds. Under those, forward EPS path supports ~35× at $5T, a premium but not outlandish for a category-defining compute platform.
• Free-cash optionality: With ~$48B net cash and massive FCF, NVDA can keep funding buybacks (already $60B fresh authorization) and capacity, smoothing cycles.
________________________________________
• Stock price at $5T market cap: ≈ $205.8 per share (on ~24.3B shares).
• Gain needed from $186.6: +$19.2 (~+10.3%).
The quick math (market cap ⇒ price)
• Shares outstanding (basic): ~24.3 B (as of Aug 22, 2025, per 10-Q).
• Stock @ $5T market cap: $5,000,000,000,000 ÷ 24.3B ≈ $205.8/share.
• From today’s price $186.6: needs +$19.2 or ~+10.3%.
That also implies P/E (TTM) at $5T of roughly ~56× (using TTM EPS ~3.68). Today’s trailing P/E is ~50–53× depending on feed.
________________________________________
Core fundamentals snapshot 🧩
Latest quarter (Q2 FY26, reported Aug 27, 2025)
• Revenue: $46.7B (+56% y/y; +6% q/q).
• Data Center revenue: $41.1B (+56% y/y).
• GAAP gross margin: 72.4%; non-GAAP 72.7%; Q3 guide ~73.3–73.5%.
• GAAP EPS: $1.08 (non-GAAP: $1.05; excl. $180M inventory release: $1.04).
TTM scale & profitability
• Revenue (TTM): ~$165.2B.
• Net income (TTM): ~$86.6B.
• Diluted EPS (TTM): ~$3.5–3.7.
• Cash & marketable securities: $56.8B; debt: ~$8.5–10.6B ⇒ net cash ≈ $48B.
Capital returns
• $24.3B returned in 1H FY26; new $60B buyback authorization (no expiration). Remaining buyback capacity ~$71B as of Aug 26.
________________________________________
Valuation read (today vs. $5T)
Using widely watched metrics:
• P/E (TTM): ~50–53× today; at $5T it rises to ~56× (assuming flat TTM EPS).
• Forward P/E: Street FY27 EPS ≈ $5.91 → ~31–33× today; ~35× at $5T — still below many AI hyper-growth narratives that trade at 40–50× forward when growth visibility is high.
• EV/EBITDA (TTM): EV ≈ market cap – net cash. Today EV ~$4.45T; EBITDA TTM ≈ $98–103B ⇒ EV/EBITDA ~43–45×; at $5T EV/EBITDA drifts to ~48–50×.
• P/S (TTM): ~27× today (at $4.5T) and ~30× at $5T on $165.2B TTM revenue.
• FCF yield: TTM FCF range $60.9–72.0B ⇒ ~1.35–1.60% today; ~1.22–1.44% at $5T.
Takeaway: $5T doesn’t require a heroic repricing — it’s ~10% above spot and implies ~35× forward earnings if consensus holds. That’s rich vs. the S&P (~22.5× forward) but arguably reasonable given NVDA’s growth, margins, and quasi-platform status in AI compute.
________________________________________
What must be true to justify $5T (and beyond) ✅
1. AI capex “supercycle” persists/expands. Citi now models $490B hyperscaler AI capex in 2026 (up from $420B) and trillions through 2029–30. A sustained 40–50% NVDA wallet share across compute+networking underwrites revenue momentum and margin sustainment.
2. Annual product cadence holds. Blackwell today → Rubin in 2026 with higher power & bandwidth, widening the perf gap vs. AMD MI450 — supports pricing power and mix.
3. Margins stay “mid-70s” non-GAAP. Company guides ~73.3–73.5% near term; sustaining 70%+ through transitions offsets any unit price compression.
4. Networking, software & systems scale. NVLink/Spectrum, NVL systems and CUDA/Enterprise subscriptions deepen the moat and smooth cyclicality; attach expands TAM (improves EV/EBITDA vs. pure-GPU lens).
5. China/export workarounds do not derail mix. Q2 had no H20 China sales; guidance and commentary frame this as manageable with non-China demand and limited H20 redirection.
________________________________________
A contrarian check (where the model could break) 🧨
• Power & grid bottlenecks. Even bulls (Citi) note AI buildouts imply tens of GW of incremental power; slippage in datacenter electrification can defer GPU racks, elongating deployments (and revenue recognition).
• Debt-funded AI spend. Rising share of AI DC capex is being levered (Oracle’s $18B bonds; neoclouds borrowing against NVDA GPUs). If credit windows tighten, orders could wobble.
• Customer consolidation & vertical ASICs. Hyperscalers iterating custom silicon could cap NVDA’s mix/price in some workloads; edge inference may fragment.
• China policy volatility. Export rules already forced product pivots; rebounds are uncertain and not fully in NVDA’s control.
• Multiple risk. At ~50× TTM and >40× EV/EBITDA, any growth decel (unit or pricing) can de-rate the multiple faster than earnings make up the gap.
Bottom line of the bear case: If AI capex normalizes faster (say +10–15% CAGR instead of +25–35%), forward EPS still grows, but the stock would likely need multiple compression (toward ~25–30× forward), making $5T less sticky near-term.
________________________________________
Street positioning (latest bullish calls) 📣
• KeyBanc: $250 (Overweight) — Rubin cycle deepens moat → ~+34% implied upside.
• Barclays: $240 (Overweight) — AI infra wave; higher multiple to 35×. ~+29% upside.
• Bank of America: $235 (Buy). ~+26% upside.
• Bernstein: $225 (Outperform). ~+21% upside.
• Citi: $210 (Buy) — reiterates annual cadence & rising AI capex.
• Morgan Stanley: $206–210 (Overweight). ~+11–13% upside; 33× CY25 EPS framework.
• Consensus: Avg 12-mo PT ~$211, ~+13% from here.
________________________________________
________________________________________
Extra color you can trade on 🎯
• Where bulls may be too conservative:
o Networking/NVLink attach could outgrow GPUs as Blackwell/Rubin systems standardize on NVIDIA fabric, defending blended margins longer.
o Software monetization (CUDA ecosystem, NIMs, enterprise inference toolchains) is still under-modeled in many sell-side DCFs.
• Where bulls may be too aggressive:
o China rebound timing & magnitude.
o Power/real-estate constraints delaying deployments into 2026.
o Credit-driven AI capex — watch for any signs of tightening in private credit / neocloud financing that uses GPUs as collateral.
________________________________________
________________________________________
Sources: NVIDIA IR & 10-Q; Yahoo Finance stats; StockAnalysis (TTM financials); company Q2 FY26 press release and CFO commentary; recent analyst notes from KeyBanc, Citi, Barclays, BofA, Morgan Stanley; financial media coverage (WSJ/FT).
Nvidia (NVDA) Shares Surpass $200 for the First TimeNvidia (NVDA) Shares Surpass $200 for the First Time
Yesterday, Nvidia’s (NVDA) share price climbed above the psychological threshold of $200 for the first time, pushing the company’s market capitalisation close to $5 trillion.
Why Are NVDA Shares Rising Today?
Several bullish factors are driving Nvidia’s share price higher:
→ Massive order backlog: The company reported pre-orders for its AI processors totalling an astonishing $500 billion.
→ Strategic partnership with the US government: CEO Jensen Huang announced plans to build seven AI supercomputers for the US Department of Energy.
→ Expansion into telecoms: Nvidia has invested $1 billion in Nokia, acquiring a 2.9% stake in the Finnish company to jointly develop AI-RAN and 6G technologies.
Technical Analysis of Nvidia (NVDA)
Back on 23 September, our analysis of the NVDA chart identified:
→ an upward channel outlining the stock’s price movements this autumn;
→ a breakout from a Bullish Flag pattern (shown in red);
→ a projection that strong fundamentals, the rapid advance of AI technology, and expectations of a Fed rate cut could enable bulls to overcome the $183 resistance level and target the psychological $200 mark.
That projection has materialised since:
→ the Bullish Flag breakout level has acted as support (marked with a bold blue line);
→ NVDA price swings have provided anchor points to refine the current channel.
What’s Next for Nvidia Shares?
Note the bullish gaps (highlighted by arrows) that indicate a demand imbalance. The rapidly strengthening upward momentum could drive NVDA’s share price towards the upper boundary of the channel, particularly as several major events approach today:
→ the Federal Reserve’s interest rate decision and subsequent press conference;
→ quarterly earnings releases from Microsoft (MSFT), Alphabet (GOOGL), and Meta Platforms (META), all of which are expected to reaffirm their commitment to AI development.
This article represents the opinion of the Companies operating under the FXOpen brand only. It is not to be construed as an offer, solicitation, or recommendation with respect to products and services provided by the Companies operating under the FXOpen brand, nor is it to be considered financial advice.

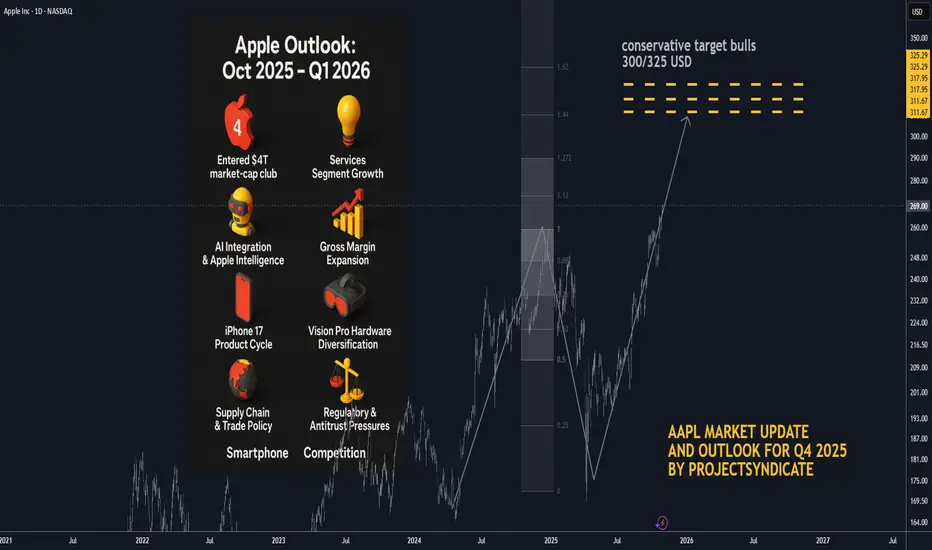
AAPL: Q1 2026 Target and Updated Outlook BULLS🍏 Apple Outlook: Oct 2025 – Q1 2026
🧠 Status and Tape Read. Apple (AAPL) has entered the $4 T market-cap club on Oct 28–29 2025, propelled by strong iPhone 17 sell-through and Services momentum. Shares pushed toward the $270 area intraday before easing, marking a powerful reversal from mid-year consolidation. Near-term, positioning is elevated into Thursday’s print; options imply ~±4% move on earnings.
📈 Path into Q1’26. Our base case shifts from a prolonged correction to a higher-low / buy-the-dip regime: dips toward the mid-$240s–$250s should attract sponsorship unless Services rolls over or China iPhone demand fades. A constructive tape through Q1’26 hinges on (1) Apple Intelligence engagement metrics, (2) iPhone 17 replacement/Android switcher rates, and (3) regulatory overhang.
📰 What’s New and recent headlines
🏆 Apple hits $4 T market value for the first time, joining Nvidia and Microsoft. Drivers: iPhone 17 traction and Services strength; stock up sharply since spring.
🗓️ Earnings set for Thu, Oct 30 (after-close); Street looking for growth in revenue/EPS; Services eyed >$100 B annual run-rate.
🔼 Loop Capital upgraded AAPL to Buy with $315 PT ahead of the move, citing iPhone cycle acceleration.
🧾 “Who Bought 8 Million Shares?”
🧺 JPMorgan Large Cap Growth Fund (SEEGX) increased its Apple position by ~8.15 million shares to ~32.9 million shares, per latest fund tracking.
⚙️ Catalysts Shaping Apple’s Stock Price in 2025–26
🤖 AI Integration & Apple Intelligence — Strength: 9/10
Rollout of on-device Apple Intelligence and upgraded Siri remains the core narrative into 2026. Look for user engagement datapoints and third-party app integrations at/after earnings. A positive read-through would validate the iPhone super-cycle argument.
💡 Services Segment Growth — Strength: 8.5/10
Consensus expects Services to push past a $100 B annual clip; durability watched versus regulatory pressure (DMA in EU, global app store scrutiny). A sustained >13% YoY growth print keeps multiple support intact.
📊 Gross Margin Expansion & Cost Efficiencies — Strength: 8/10
Management has guided 46–47% GM for FQ4 (tariff headwind embedded). Mix shift to Services + component deflation support FY26 margin resilience.
📱 iPhone 17 Product Cycle — Strength: 8/10 (↑ from 7.5)
Early sell-through outpacing prior gen in the U.S. and China within first days; the iPhone 17 (incl. “Air”) is the incremental driver restoring unit momentum.
🥽 Vision Pro & Hardware Diversification — Strength: 7/10
Next-gen devices + Apple Intelligence tie-ins create optionality; still niche near-term but adds ecosystem gravity.
💵 Capital Returns — Strength: 7/10
$110 B buyback authorization remains a floor; watch cadence vs. stock at ATHs and post-print cash deployment commentary.
🌏 Supply Chain & Trade Policy — Strength: 6.5/10
China exposure/tariffs remain a swing factor; Apple has been absorbing some costs rather than pushing through prices on key models.
⚖️ Regulatory & Antitrust Pressures — Strength: 6/10
DMA compliance and global app store cases could trim Services take-rate; monitor any remedial changes called out on the call.
📈 Macro & Rates — Strength: 5/10
“Higher for longer” limits multiple expansion; any disinflation/soft-landing upside would expand P/E support.
🥊 Smartphone Competition — Strength: 5/10
Android OEM velocity still high in EM; Apple’s cycle needs sustained switcher share to outrun.
💼 Earnings Set-Up: FQ4 reporting Thu Oct 30 2025
📅 Consensus into print:
• Revenue: ~$101–104 B (TipRanks ref: $102.2 B)
• EPS: ~$1.74–$1.82 (TipRanks ref: $1.78)
• Gross Margin guide: 46–47% (company indication)
• Services: watch for >$100 B annualized pace confirmation
• Implied move: options pricing ~±4%
🎧 Watch items on the call: Apple Intelligence activation/MAUs, iPhone 17 channel inventory, China mix, Services take-rate headwinds (EU), GM puts/takes (tariffs), cap-return cadence.
🎯 Street Positioning & Targets
🔼 Loop Capital: Buy, PT $315 (Oct 20/21 2025).
📊 General take: Many houses remain Overweight; focus turning to 2026 EPS power and AI monetization path.
🧭 Tactical View 0–3 Months
📈 Into/after print: Choppy but constructive. Chasing at ATHs is risky; prefer buy-on-weakness zones near $248–255 with stop discipline. A bullish guide/Services beat could sustain a breakout; a light AI engagement update or China wobble likely gets faded back into the mid-$250s.
⚠️ Risk-case: Regulatory headline or guide below mid-single-digit growth could quickly compress P/E and retest the $240s.
🚀 Bull-case: Clean beat/raise + AI usage KPIs → re-rate toward $290–300 into holiday.
🏁 Quick Milestone Recap
🥇 $4 Trillion Market Cap achieved on Oct 28–29 2025, making Apple the third public company (after Nvidia, Microsoft) to reach the level; iPhone 17 momentum and Services strength cited across coverage.
FinVolution Group (FINV) - A Quiet Giant on the Edge of Breakout⚡ FinVolution Group (FINV) — A Quiet Giant on the Edge of Breakout
While everyone is chasing the inflated Big Tech bubble, a much quieter — and potentially far more explosive — opportunity is forming right now in the fintech and online lending space.
That opportunity is FinVolution Group (FINV) — a Chinese and Southeast Asian fintech player that looks ready to break through its 2021 highs. Once that breakout happens, the move could be massive.
🔸 Fundamentals
FinVolution has quietly turned a corner.
Recent quarters have been consistently profitable — both revenue and EPS are growing.
The most striking part?
The forward P/E ratio is just 0.7 — yes, less than one.
That’s an extraordinary valuation for a profitable fintech with expanding operations across multiple Asian markets.
It’s a risky play, no doubt, but these are exactly the kind of setups that tend to drive portfolio growth over time: low valuation, improving financials, and clear technical breakout potential.
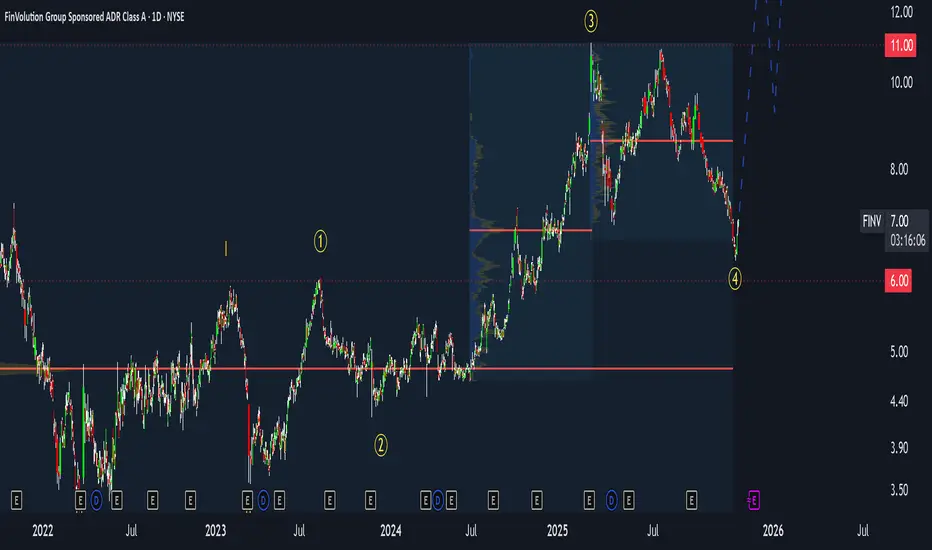
🔸 Technical Picture
From a technical perspective, FINV is at the start of what looks like the third major wave of its long-term structure.
Since 2021, the price has been consolidating sideways — but that phase seems to be ending now.
Key resistance: $11
Current price: around $7
Breakout level: above $11 (with volume confirmation)
First targets: $20 → $30 → $40
If the price breaks below $6, the bullish scenario pauses — it doesn’t collapse, but likely extends the sideways phase.
That sets up a risk of roughly 10–15%, while the potential upside remains multiple times higher.
The risk/reward profile here is exceptionally strong.
🔸 My Strategy
I’m already positioned - entered near $7, with a stop-loss around $6.
Once we approach $11, I plan to take partial profits and watch for a breakout confirmation.
If we get a strong breakout above $11 with solid volume, that’s my next entry trigger.
Then I’ll look to add on pullbacks, applying my call stacking strategy - building exposure gradually as the trend confirms and accelerates.
🚀 Summary
FinVolution (FINV) shows a rare combination:
✅ Profitable growth
✅ Deep undervaluation
✅ Strong breakout setup
It’s one of those asymmetric opportunities — where the downside is limited, but the upside could multiply several times over.
If the $11 breakout confirms, this could easily become one of the most powerful fintech moves of the next few quarters.
⚡ Call to Action
If you like this type of setup - low-risk, high-upside plays - tap 🚀 to support the idea,
and drop a comment with tickers you’d like me to review next.
(Full technical breakdown and strategy details are discussed in my latest videos — available via my profile.)
Nvidia Just Under Major SupportNvidia seems to have been pulled down by the Dow just like Apple as both are just under major support. I'm sorry for my previous Nvidia chart that drew support near 140, I recognize where I screwed up, but this chart should be good. Fortunately actual 117 support wasn't that far below and my NVDA isn't too in the red.
NVDA has the lowest revenue multiple in years right now. I know it's well off it's long term trend line, but it's growth rate is unlike anything it's ever been so expecting a steeper trend line to appear makes a lot of sense. Eventually I would imagine we'll get back to that trend line, but not anytime soon.
The Dow hitting major support should finally lift NVDA and the others that have been dragged down like AAPL and AMZN.
Good luck!

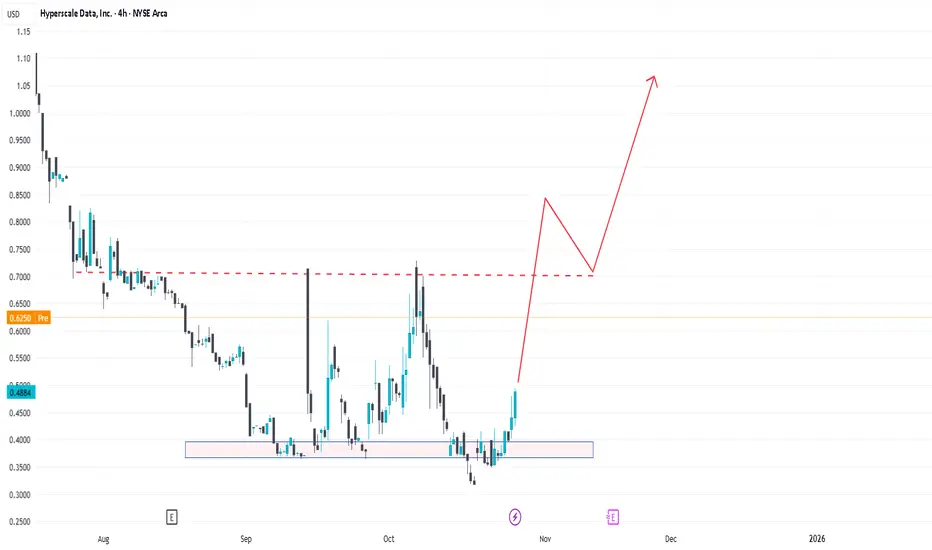
GPUS – The Hidden NVIDIA-Linked Microcap That Might 10×The market is full of AI infrastructure stories, but very few come from companies that already survived multiple industrial cycles. GPUS is one of those rare cases — a firm with decades of history that keeps reinventing itself. What used to be a crane and hotel business is now morphing into a modern data-infrastructure and Bitcoin-mining company, replacing declining legacy assets with the most demanded resource of this decade: computing power.
Through its Sentinum subsidiary, GPUS has begun building facilities powered by NVIDIA GPU clusters and high-efficiency miners. The goal is to scale to several thousand active mining and compute units — targeting roughly 5 000 machines in the coming phase. It’s a bold pivot: from lifting steel to lifting data. And in a market obsessed with AI capacity, this is exactly the kind of story that can explode when execution meets narrative.
The numbers highlight the asymmetry. GPUS trades at roughly $50 million market cap — microscopic compared with peers like NASDAQ:APLD , whose valuation exceeds $8 billion. Both target similar fields: AI-grade compute infrastructure and digital-asset power utilization. If GPUS manages to build even a fraction of its announced capacity, the valuation gap leaves theoretical upside north of 1 000 %. Add to that their new Bitcoin treasury strategy and expanding Michigan data-center power capacity, and the picture starts to resemble an undervalued optionality play on both crypto and AI.
Still, this isn’t a risk-free moonshot. The balance sheet shows losses; the pivot is capital-intensive; and dilution remains a possibility as the company raises funds to scale. Execution speed will be crucial — the market won’t reward empty announcements for long. But if management delivers actual installed GPU capacity and lands enterprise clients, the repricing could be violent.
In short, GPUS is the kind of microcap that the market usually ignores — until suddenly it doesn’t. It’s volatile, speculative, and not for the faint-hearted. Yet for traders searching for asymmetric setups, it sits right at the intersection of Bitcoin mining, AI compute, and under-discovered transformation. A clean breakout above recent resistance could be the technical confirmation that fundamentals are finally catching up with the story.
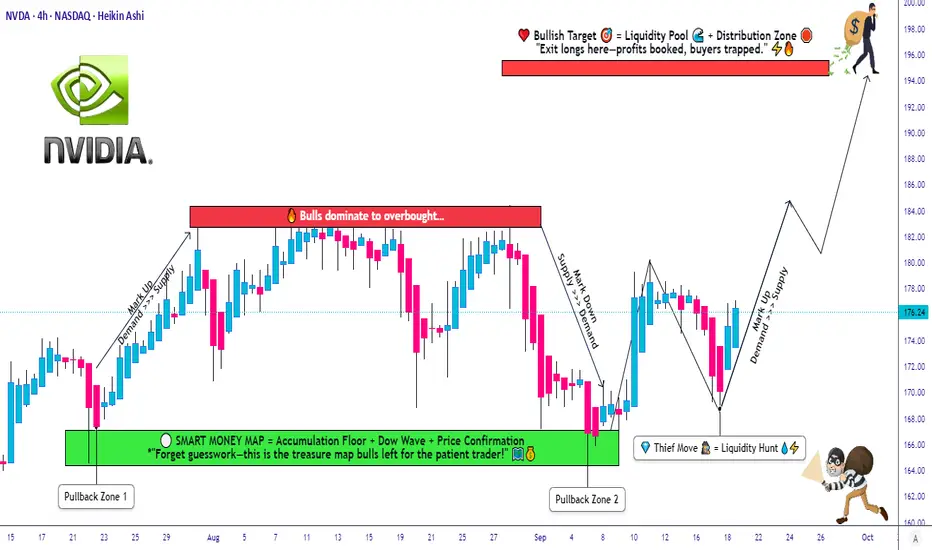
NVDA Setup Explained: Layered Entry + Clear SL/TP Levels😎 NVDA Thief’s Wealth Heist: Swing/Day Trade Blueprint 🚀
Asset: NVIDIA Corporation (NVDA) 📈Vibe: Bullish, sneaky, and ready to snatch profits with style! 💰
Welcome, ladies and gentlemen, to the Thief’s OG Wealth Strategy Map for NVDA!
This is a fun swing/day trading plan designed to grab liquidity like a master thief. Let’s break down this bullish setup with a double bottom pullback, layered entries, and a cheeky escape plan. Ready to outsmart the market? 🕵️♂️
📊 Market Analysis: Why NVDA?
NVDA is riding a bullish wave 🌊, confirmed by a double bottom pullback pattern and a sneaky liquidity grab at key support levels. The stock’s momentum is screaming “UP!” as buyers step in to defend the price. This setup is perfect for swing or day traders looking to capitalize on NVIDIA’s tech-fueled surge. 💻
🗺️ The Thief’s Plan: Bullish Heist Strategy
🎯 Entry Strategy:Deploy the Thief’s Layering Tactic with multiple buy limit orders to maximize your entry precision.
Suggested price levels:
$172.00
$174.00
$176.00
$178.00
Pro Tip: Feel free to add more layers based on your risk appetite and market conditions. The more, the merrier! 🧑💼
🛑 Stop Loss (SL):Set a Thief’s SL at $168.00 to protect your loot.
Note: Dear Thief OGs, this SL is my suggestion, but you’re the boss of your trades! Adjust based on your risk tolerance and let the profits roll. 💸
🎉 Take Profit (TP):Aim for the juicy $195.00 target, where we expect strong resistance, potential overbought conditions, and a possible trap for the unprepared. Lock in those hard-earned gains and escape like a pro! 🏃♂️
Note: This TP is my call, but you do you! Take profits at your own pace and keep the cash flowin’. 😎
🔗 Related Pairs to Watch (in USD)
To boost your market awareness, keep an eye on these correlated assets:
NASDAQ:AMD (Advanced Micro Devices): NVDA’s chipmaking cousin often moves in tandem. A bullish NVDA could signal strength in AMD. 📡
NASDAQ:SMH (VanEck Semiconductor ETF): This ETF tracks the semiconductor sector, including NVDA. Watch for sector-wide momentum. 📊
NASDAQ:QQQ (Invesco QQQ Trust): NVDA’s a heavy hitter in this tech-heavy ETF. QQQ’s trend can confirm NVDA’s direction. 🚀
Key Correlation Point: NVDA’s performance is tied to the broader semiconductor and tech sector. If AMD or SMH shows bullish patterns, it reinforces NVDA’s upside potential. Conversely, weakness in QQQ could signal caution. Stay sharp, thieves! 🕵️
🛠️ Why This Setup Rocks
Double Bottom Pullback: A textbook bullish reversal pattern, signaling strong buying interest. 📉➡️📈
Liquidity Grab: The market’s attempt to shake out weak hands before the real move up. We’re smarter than that! 😏
Layered Entries: Spread your risk across multiple price levels for a smoother ride. 🎢
Risk Management: Clear SL and TP levels keep your heist disciplined and profitable. 🧠
⚠️ Disclaimer
This Thief Style Trading Strategy is just for fun and educational purposes! I’m not a financial advisor, and trading involves risks. Make your own decisions, manage your risk, and trade responsibly. Let’s keep the vibes high and the losses low! 😜
✨ “If you find value in my analysis, a 👍 and 🚀 boost is much appreciated — it helps me share more setups with the community!”
#NVIDIA #NVDA #Trading #SwingTrading #DayTrading #ThiefStrategy #StockMarket #Bullish #TechnicalAnalysis