Nvidia (NVDA) Upcoming Earnings ReportNvidia (NVDA) Upcoming Earnings Report
Tomorrow after hours, Nvidia will release its quarterly report, attracting heightened attention given its position as:
→ the world’s largest company (market capitalisation of around $4.39 trillion);
→ a leader in the development of AI-related industries;
→ strong stock price performance — approximately +33% year-to-date, +108% from the yearly low.
Bullish Expectations
Analysts anticipate Nvidia will report revenue of around $46 billion, more than 50% higher than the same period last year.
Investors are counting on confirmation of robust demand for Nvidia’s chips from tech giants such as Microsoft, Google, Amazon, and Meta, all of which continue to expand capital expenditure on data centres to power AI workloads.
Further support for NVDA’s share price could come from positive news about demand for the new Blackwell chips and the resumption of sales in China following a recent agreement with the US government.
Bearish Concerns
Even strong results may fall short of “sky-high” optimistic expectations, potentially triggering profit-taking and a decline in Nvidia’s (NVDA) stock price. The stock trades at a high P/E multiple (price-to-earnings ratio), making it vulnerable to any negative news or even a minor miss against forecasts.
The primary concern is that Nvidia’s forward guidance might point to a slowdown in AI infrastructure spending growth by its key clients. Any hint of this could negatively affect not only Nvidia’s shares but also the broader technology sector.
Technical Analysis of Nvidia (NVDA) Chart
NVDA’s share price remains within an upward channel (shown in blue), with the following configuration:
→ until mid-August, the price remained within the upper half of the channel;
→ in August, the price declined towards the lower boundary (point A).
The $170 level appears to be a key support:
→ it is a round psychological level;
→ the low at point A looks like an aggressive test of this level, after which the price reversed upward.
From a bullish perspective:
→ support is provided by the lower boundary of the channel;
→ a long bullish candlestick (2) signals persistent demand.
From a bearish perspective, the $183 level looks like key resistance: NVDA’s share price slowed its advance here in early August, with repeated unsuccessful attempts to break higher.
Given the above, we could assume that the bulls may attempt to push through the $183 resistance on the back of the earnings release, but to do so, Nvidia’s results and guidance must at least meet the market’s extremely optimistic expectations.
This article represents the opinion of the Companies operating under the FXOpen brand only. It is not to be construed as an offer, solicitation, or recommendation with respect to products and services provided by the Companies operating under the FXOpen brand, nor is it to be considered financial advice.
Nvda_analysis

Nvidia Shares Maintain Bearish Bias Near $170Over the past three trading sessions, Nvidia’s shares have posted a sharp decline, accumulating losses of more than 3% in the short term. For now, the emerging selling bias around the stock remains in place, as the market fears a potential overheating of the artificial intelligence industry. Added to this is the anticipation of the company’s results on August 27, which may show difficulties in revenue, mainly due to concerns that sales in China have weakened in recent months amid the intensifying trade war. Earnings per share are expected to come in around $0.94, but uncertainty remains as to whether this figure can hold given possible performance challenges. As long as this uncertainty persists, selling pressure on the stock could remain in the short term.
Uptrend Channel at Risk
Recent sessions have shown a clear shift in the bullish outlook that Nvidia had been sustaining in prior weeks. A significant bearish correction has emerged, halting the advance of the short-term uptrend channel and leading to a breakdown of its lower boundary. As long as selling pressure continues, this previous channel may lose relevance and give way to a broader bearish scenario, provided the bearish bias remains dominant.
Technical Indicators
RSI: the RSI line has begun to show a downward slope, now approaching the neutral 50 level. If it breaks below this threshold, selling momentum could become dominant in the short term, paving the way for stronger bearish pressure on the chart in the upcoming sessions.
MACD: the MACD histogram is currently moving below the 0 line, reflecting that short-term moving averages have entered a sustained bearish territory. If the histogram continues to decline, selling pressure is likely to strengthen further in the short term.
Key Levels to Watch:
$184 – Main Resistance: corresponds to the area of recent highs. A sustained recovery above this level could reactivate a bullish bias and bring back strength to the uptrend channel.
$173 – Near-Term Support: current congestion zone of recent weeks and the most immediate barrier. A sustained move below this level could trigger a stronger bearish bias in the short term.
$162 – Crucial Support: aligned with the 23.6% Fibonacci retracement. A decisive break below this level would confirm a bearish structural shift, opening the door to a new selling trend in the short term.
Written by Julian Pineda, CFA – Market Analyst

Nvidia - This is clearly not the end!📐Nvidia ( NASDAQ:NVDA ) will simply rally more:
🔎Analysis summary:
Yes, over the past couple of months, Nvidia has been rallying another +100%. But looking at the higher timeframe, this is still not the end of the unbelievable bullrun. Following the rising channel pattern, Nvidia can rally another +20% before we might see a potential retracement.
📝Levels to watch:
$250
SwingTraderPhil
SwingTrading.Simplified. | Investing.Simplified. | #LONGTERMVISION

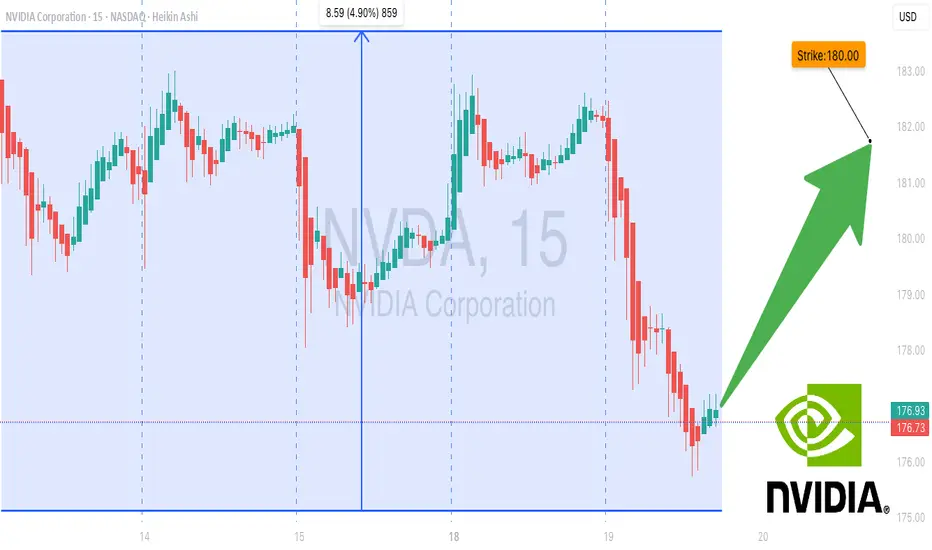
Strong Bullish Flow in NVDA: $180 Calls Primed for Breakout! 🚀 NVDA Weekly Options Bullish Flow – Aug 19, 2025
**Market Sentiment:**
📈 Total calls: **632,689** | Total puts: **334,721**
💥 **Call/Put Ratio: 1.89 → Strong Weekly Bullish Flow**
⚠️ Gamma Risk: Moderate – watch volatility closely.
**Technical Indicators:**
* **Daily RSI:** 63.3 → slight pullback signs
* **Weekly RSI:** 87.2 → 🚀 strong weekly momentum
* **Weekly Volume Ratio:** 0.9x → weak institutional activity, caution advised
**Options Highlights:**
* Key strikes: **\$180** (OI: 65,649), **\$187.50** (liquid and premium-friendly)
* Expiration in **3 days** → time decay accelerating
**Risks to Monitor:**
* Weak weekly volume
* Daily RSI trending down
* Price support at **\$175.90–\$176.00**
**Consensus & Trade Setup:**
* **Overall Bias:** Moderate Bullish
* **Recommended Trade:** **Single-leg Call**
* **Strike:** \$180.00
* **Entry:** \$3.60
* **Stop Loss:** \$1.80
* **Profit Target:** \$6.00–\$7.50 (80%-100% potential)
* **Confidence:** 65%
**Trade JSON Snapshot:**
```json
{
"instrument": "NVDA",
"direction": "call",
"strike": 180.0,
"expiry": "2025-08-22",
"confidence": 0.65,
"profit_target": 6.00,
"stop_loss": 1.80,
"size": 1,
"entry_price": 3.60,
"entry_timing": "open",
"signal_publish_time": "2025-08-19 13:15:57 EDT"
}
NVDA Ready to Break Higher – $187.50 Calls Flashing Opportunity!
# 🚀 NVDA Weekly Options Analysis (2025-08-17) – Don’t Miss Out!
### 🔎 Model Insights Recap
**Grok/xAI Report**
* 📊 RSI: Falling (daily & weekly → potential exhaustion)
* 📈 Call/Put Ratio: **2.00 (Bullish flow)**
* 🔊 Volume: Weak
* ✅ Decision: Moderate bullish → suggested **\$190 Call**
**Gemini/Google Report**
* 📊 RSI: Declining
* 📈 Options Flow: Strong, but weak trend & volume
* 🛑 Decision: **Pass** (low confidence)
**Claude/Anthropic Report**
* 📊 Technical: Overbought with negative divergence
* 🔊 Volume: Flat weekly
* 🛑 Decision: **No trade** (bearish momentum indicators)
**Llama/Meta Report**
* 📊 Bias: Neutral-bullish (options flow positive)
* 🔊 Volume: Weak
* ✅ Decision: **\$187.50 Call** with caution
**DeepSeek Report**
* 📊 Market: Bearish divergence despite bullish flow
* 🔊 Volume: Weak institutional support
* 🛑 Decision: **No trade**
---
### 📌 Key Agreements
✔️ Declining daily & weekly RSI = potential momentum exhaustion
✔️ Strong call/put ratio = bullish sentiment from options traders
✔️ Weak volume = lack of support for sustained upside
### 📌 Key Disagreements
⚖️ Grok/xAI & Llama/Meta → potential bullish calls
⚖️ Gemini/Claude/DeepSeek → caution/pass
⚖️ Bullishness varies depending on options flow vs volume
---
## 📊 Recommended Trade Setup
* **Direction:** CALL (Long)
* **Strike:** \$187.50
* **Expiry:** 2025-08-22
* **Entry Price:** \$0.85
* **Stop Loss:** \$0.34 – \$0.425 (40-50% of premium)
* **Profit Target:** \$1.50 (50-100% return)
* **Entry Timing:** Market Open
* **Confidence:** 65%
---
### ⚠️ Key Risks
* **Momentum Exhaustion:** Falling RSI could signal reversals
* **Weak Institutional Support:** Volume may limit upside
* **Event Risk:** Upcoming earnings may introduce volatility
---
📊 **TRADE DETAILS JSON**
```json
{
"instrument": "NVDA",
"direction": "call",
"strike": 187.50,
"expiry": "2025-08-22",
"confidence": 0.65,
"profit_target": 1.50,
"stop_loss": 0.34,
"size": 1,
"entry_price": 0.85,
"entry_timing": "open",
"signal_publish_time": "2025-08-17 09:26:30 EDT"
}
```

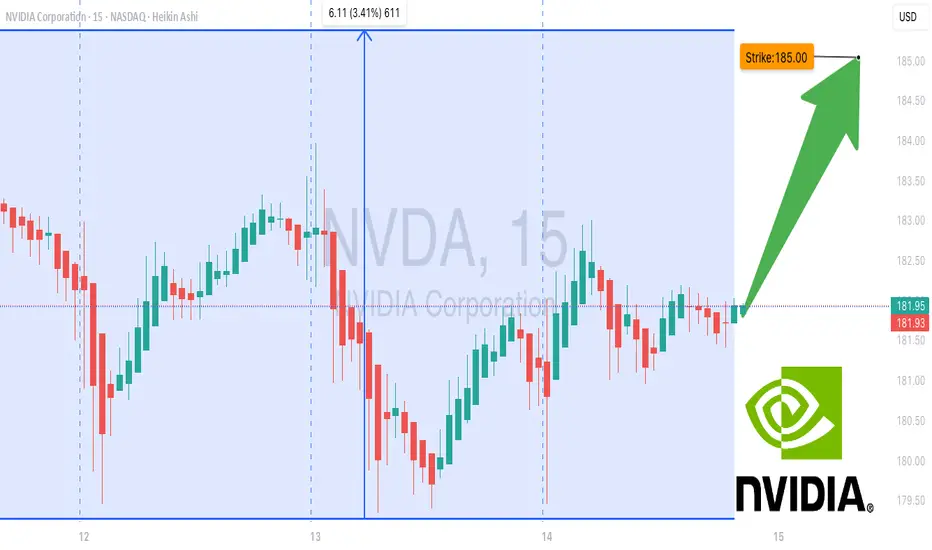
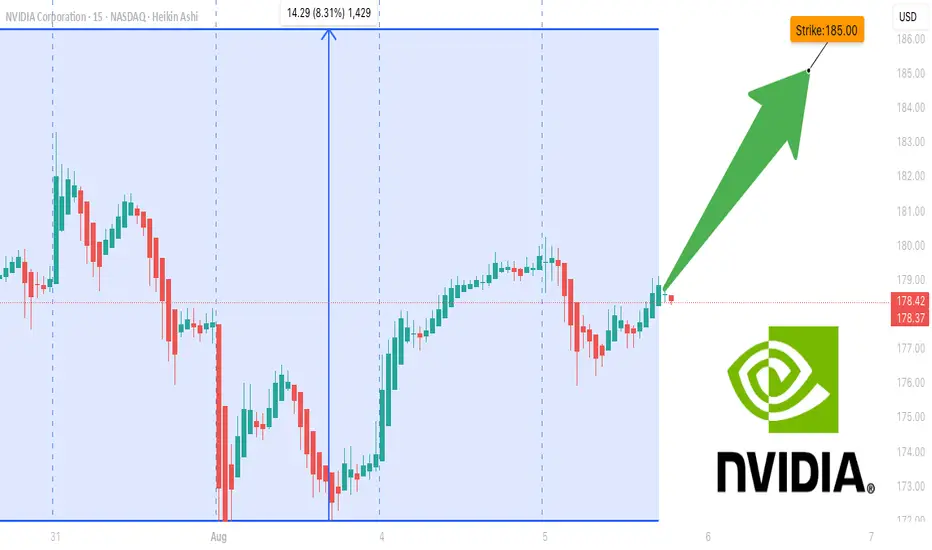
NVDA Gamma Showdown: Will Bulls Break $185 Before Time Runs Out? 🚀 NVDA Gamma Showdown: Will Bulls Break \$185 Before Time Runs Out?
**Sentiment:** ⚖️ *Moderate Bullish, High Risk*
* **Call/Put Ratio:** 1.78 📈
* **Daily RSI:** Mixed → Losing momentum
* **Weekly RSI:** Still bullish
* **Volume:** Weak → Low institutional conviction
* **Gamma Risk:** 🔥 HIGH — expiry in 1 day
* **Time Decay:** Accelerating ⚡
---
### 📊 **Consensus Highlights**
✅ Bullish options flow supports upside potential
⚠️ Weak volume + gamma risk = cautious sizing
💡 Tight stop loss and fast profit-taking advised
---
### 🎯 **Trade Setup**
* **Type:** CALL (Naked)
* **Strike:** \$185.00
* **Expiry:** 2025-08-15
* **Entry:** \$0.62
* **Profit Target:** \$0.86 (+30%)
* **Stop Loss:** \$0.31 (–50%)
* **Confidence:** 65%
* **Entry Timing:** Market open
---
💬 *This is a high-risk, high-reward expiry play — watch it like a hawk.*
📌 *Not financial advice. DYOR.*
---
**#NVDA #OptionsTrading #GammaSqueeze #DayTrading #StocksToWatch #OptionsFlow #TradingSignals #StockMarket**
Nvidia (NVDA) Share Price Growth SlowsNvidia (NVDA) Share Price Growth Slows
Equity markets are on the rise:
→ The S&P 500 index (US SPX 500 mini on FXOpen) has reached a new all-time high;
→ The Nikkei 225 (Japan 225 on FXOpen) hit a fresh record high yesterday;
→ Gains are also seen across other assets — for example, Ethereum has climbed to its highest level since November 2021.
The CNN Fear & Greed Index indicates market “greed”, but it is worth noting that one of the market leaders, Nvidia (NVDA), is not matching the broader bullish momentum.
Technical Analysis of Nvidia (NVDA)
Although NVDA’s share price remains within a long-term ascending channel (shown in blue), holders have valid reasons for concern.
The NVDA chart shows that price growth is capped by the $183 resistance level, with a series of bearish signals emerging (as indicated by the arrows):
→ Following a bullish gap in late July, the price failed to sustain its highs and quickly retreated, erasing the upbeat sentiment;
→ A bearish engulfing pattern on 7 August suggests that the median line of the ascending channel is acting as resistance;
→ The RSI indicator peaked on 29 July, but subsequent price increases have not been accompanied by higher RSI highs — a sign of bearish divergence.
As a result, NVDA price is consolidating within a narrowing triangle:
→ On the one hand, higher lows indicate that buyers are still supporting the price;
→ On the other hand, the $183 level continues to cap the advance of this market leader despite the broader bullish environment.
Bulls need to show determination soon to break through the key $183 resistance; otherwise, the ascending channel in place since early July risks being breached. In that scenario, the August low near $172 could be retested.
This article represents the opinion of the Companies operating under the FXOpen brand only. It is not to be construed as an offer, solicitation, or recommendation with respect to products and services provided by the Companies operating under the FXOpen brand, nor is it to be considered financial advice.

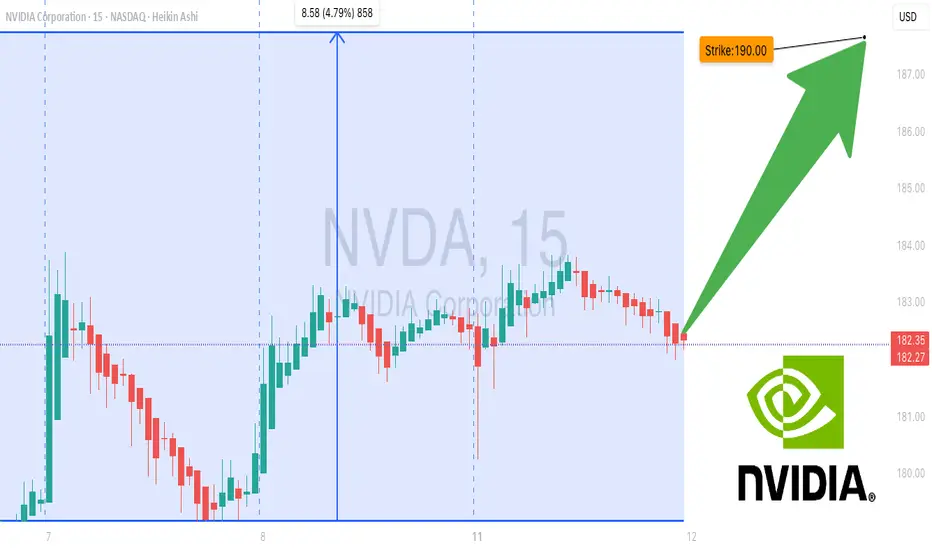
NVDA don’t Miss Out--$190 Call Target, Momentum on Fire## 🚀 NVDA Weekly Options Breakdown (Aug 11, 2025) 🚀
### 🔥 Market Sentiment: Bullish Bias Across Models
* **Grok/xAI**: Strong Bullish — rising RSI & bullish flow, but *watch weak volume*.
* **Claude/Anthropic**: Moderate Bullish but *no trade* due to policy risks & volume doubts.
* **Gemini/Google**: Moderate Bullish, recommends **\$192.5 calls** with stop loss — volume risk noted.
* **Llama/Meta**: Bullish — buy **\$190 calls**, manage volatility & premium decay.
### ✅ Consensus Trade Setup:
**Buy \$190 Calls** expiring Aug 15 @ \$0.70 premium
* 🎯 Profit Target: \$0.91
* 🛑 Stop Loss: \$0.35
* 📊 Confidence: 70%
* ⏰ Entry: Market Open Next Trading Day
### ⚠️ Key Risks:
* Policy/news impact on semiconductor sector
* Moderate gamma risk & possible volatility spikes near expiry
---
### 🔍 Model Insights Breakdown
| Model | Sentiment | Trade Idea | Confidence |
| ---------------- | ---------------- | ------------------------------ | ---------- |
| Grok/xAI | Strong Bullish | Buy \$190 Calls | 70% |
| Claude/Anthropic | Moderate Bullish | No trade (high news risk) | 45% |
| Gemini/Google | Moderate Bullish | Buy \$192.5 Calls w/ stop loss | 65% |
| Llama/Meta | Bullish | Buy \$190 Calls w/ risk mgmt | 70% |
---
### 💡 Why This Matters
* RSI and options flow point strongly bullish — calls dominate puts 1.2+ ratio
* Volume confirmation weak, so *manage risk tightly*
* Position best for aggressive traders ready to manage fast moves
---
📈 **NVDA Weekly Options Trade Summary**
```json
{
"instrument": "NVDA",
"direction": "call",
"strike": 190.0,
"expiry": "2025-08-15",
"confidence": 0.70,
"profit_target": 0.91,
"stop_loss": 0.35,
"size": 1,
"entry_price": 0.70,
"entry_timing": "open",
"signal_publish_time": "2025-08-11 10:33:48 UTC-04:00"
}
```
NVDA Don’t Miss Out## ⚡ NVDA Swing Setup (2025-08-08) ⚡
**Bias:** 📈 **Moderate Bullish** — RSI hot (67), trend up, low VIX, but volume still meh.
**🎯 Trade Plan**
* **Ticker:** \ NASDAQ:NVDA
* **Type:** CALL (LONG)
* **Strike:** \$185.00
* **Entry:** \$3.15 (near open)
* **Profit Target:** \$4.65 (+48%)
* **Stop Loss:** \$2.13 (-30%)
* **Expiry:** 2025-08-22 (14DTE)
* **Size:** 1 contract
* **Confidence:** 75%
**📊 Key Notes**
* RSI strong = momentum on your side ✅
* VIX favorable for calls ✅
* Weak volume & neutral flow = confirm before adding size ⚠️
* Watch breakout above **\$183.88** for momentum kick
**💡 Play Idea:**
Ride momentum to \$195+, take 50% profits at \$4.65, trail stops to lock gains.

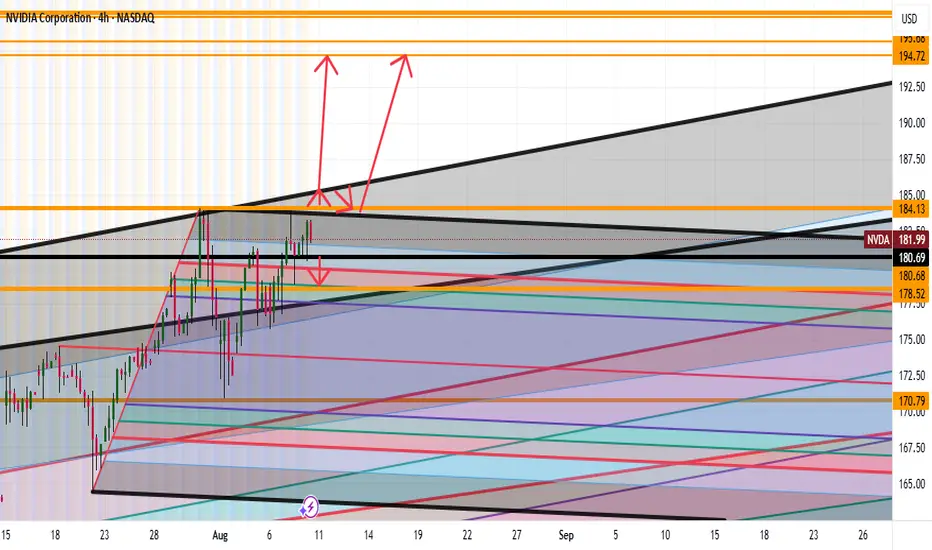
NVDA Going to 194 Full AnalysisGood afternoon Traders
So looking at NVDA we have a strong monthly bullish trend
Micro though we see the following:
Bearish: If we break the lows of 180 expect to see 178 getting hit
Bullish: Break 184 highs then expect to see a punch up to 185 then small correction then a big up to 190's or we miss the correction and blow right through to the 190's
Happy Trading Folks
Trade Smarter Live Better
Kris
Nvidia - This is clearly not the end!📐Nvidia ( NASDAQ:NVDA ) will confirm the breakout:
🔎Analysis summary:
Over the past couple of months, Nvidia managed to rally about +100%, reaching top 1 of total market cap. Most of the time such bullish momentum just continues and new all time highs will follow. But in order for that to happen, Nvidia has to confirm the all time high breakout now.
📝Levels to watch:
$150
🙏🏻#LONGTERMVISION
SwingTraderPhil

NVDA Don't Miss Out !!!!
**NVDA \$185C Weekly Momentum Surge ⚡ All Models Aligned – 75% Confidence Setup 🔥**
---
### 📊 **Post Body (Optimized for TradingView):**
**NVDA Weekly Call Play — Aug 8 Expiry (3 DTE) 🔥**
📈 **Momentum Snapshot:**
* **Weekly RSI:** 🔼 Above 50 and climbing
* **Daily RSI:** 🔻 Falling — short-term caution
* **Volume:** 1.2x previous week (🟢 Institutional flow)
* **Volatility (VIX):** <22 — favorable setup
* **Gamma Risk:** 🟠 Moderate
---
🧠 **Model Scorecard Summary:**
* **Grok / xAI:** 4/5 Bullish 🟢
* **Gemini (Google):** 3/5 Bullish with 80% confidence 🟢
* **Claude (Anthropic):** 5/5 Bullish 💯
* **LLaMA (Meta):** 4/5 Bullish 💪
* **DeepSeek:** 5/5 Bullish 🚀
✅ **Consensus:** Strong Bullish 🔥
---
### 💡 **Trade Setup:**
* 🎯 **Strategy:** Long CALL
* 🟢 **Strike:** \$185
* 📅 **Expiry:** Aug 8, 2025
* 💵 **Entry Price:** \$0.96
* 📈 **Target Exit:** \$1.90 (100% gain)
* 🛑 **Stop Loss:** \$0.48 (50% risk cap)
* 📏 **Size:** 1 contract
* ⏰ **Timing:** Market Open
* 📊 **Confidence Level:** 75%
---
⚠️ **Key Risks to Watch:**
* Time decay – Only 3 DTE ⏳
* Daily RSI divergence 😬
* Gamma risk & market volatility (track \ TVC:VIX )
---
### 🧾 **Auto-Logger JSON (for tracking):**
```json
{
"instrument": "NVDA",
"direction": "call",
"strike": 185.00,
"expiry": "2025-08-08",
"confidence": 0.75,
"profit_target": 1.90,
"stop_loss": 0.48,
"size": 1,
"entry_price": 0.96,
"entry_timing": "open",
"signal_publish_time": "2025-08-05 09:43:22 UTC-04:00"
}
```
---
### 🏷️ **Suggested Hashtags (TradingView Style):**
`#NVDA #OptionsTrading #WeeklyOptions #CallOptions #MomentumStocks #AIStocks #TechLeaders #TradingSetup #RSISignal #GammaSqueeze #NVIDIA #OptionAlert #HighConviction #TradeIdeas #TechBreakout`
NVDA Weekly Trade Setup (2025-08-02)
### 🟢 NVDA Weekly Trade Setup (2025-08-02)
🚀 **BULLISH CONSENSUS** across 5 top-tier models
📉 Daily RSI: Weak — but weekly trend is STRONG
💼 Institutional Volume: Confirmed accumulation
📊 Options Flow: Call/Put leaning bullish
---
### 🎯 TRADE SETUP
**💥 Direction:** CALL (LONG)
**📍 Strike:** \$182.50
**📅 Expiry:** 2025-08-08
**💵 Entry:** \$0.73
**🎯 Target:** \$1.46 (100% gain)
**🛑 Stop:** \$0.36 (50% risk cap)
**✅ Confidence:** 75%
**🕒 Entry Timing:** At market open
---
### 🧠 Model Breakdown:
✅ **Grok/xAI:** Weekly bullish, 4/5 signals green
✅ **DeepSeek:** Volume confirms; cautious on daily RSI
✅ **Google/Gemini:** Bullish weekly > bearish daily
✅ **Claude:** Weekly momentum + rising options flow
✅ **Meta/Llama:** All signals aligned for \$182.50 call
---
### ⚠️ Risk Watch:
* Falling Daily RSI = short-term drag risk
* Key Support: Watch for \$178 breakdown
* Earnings/events could spike volatility
---
### 📦 TRADE JSON (for tracking):
```json
{
"instrument": "NVDA",
"direction": "call",
"strike": 182.50,
"expiry": "2025-08-08",
"confidence": 0.75,
"profit_target": 1.46,
"stop_loss": 0.36,
"size": 1,
"entry_price": 0.73,
"entry_timing": "open",
"signal_publish_time": "2025-08-03 00:54:05 UTC-04:00"
}
```
---
🔥 *“Smart money is circling. Ride the wave, not the noise.”*
💬 Drop your thoughts below. Will NVDA break \$185 next week?

NVDA Bullish Weekly Trade Setup** – 2025-07-29
📈 **NVDA Bullish Weekly Trade Setup** – 2025-07-29
🚀 *"Momentum meets money flow!"*
### 🔍 Market Snapshot:
* 💥 **Call/Put Ratio**: 2.47 → Bullish sentiment confirmed
* 🧠 **RSI**: Rising on Daily & Weekly → Momentum building
* 🔕 **Low VIX**: Favors call strategies (cheap premiums)
* ⚠️ **Caution**: Light volume = soft institutional backing
---
### 🔧 Recommended Options Trade:
**🟢 NVDA \$182.50 CALL (Exp: Aug 1)**
💰 *Entry*: \~\$0.53 (Mid)
📈 *Profit Target*: \$0.69 – \$1.06
🛑 *Stop Loss*: \$0.32
📆 *DTE*: 3 days
🔄 *Entry Timing*: Market Open
✅ *Confidence*: 75%
🔥 *Theta & Gamma Risk*: Elevated — manage position size!
---
### 💡 Why This Trade?
✅ RSI Strength across timeframes
✅ Flow favors upside
✅ Cheap premium in a low-volatility regime
🟡 Just watch that volume…
---
📊 **TRADE SNAPSHOT (JSON):**
```json
{
"instrument": "NVDA",
"direction": "call",
"strike": 182.50,
"expiry": "2025-08-01",
"confidence": 0.75,
"profit_target": 1.06,
"stop_loss": 0.32,
"size": 10,
"entry_price": 0.53,
"entry_timing": "open",
"signal_publish_time": "2025-07-29 11:59:10 UTC-04:00"
}
```
---
📣 **Taglines for Sharing:**
* "NVDA setup is 🔥—momentum + flow = GO!"
* "Gamma risk is real—but so is this profit window 💸"
* "Short-term sprint or fade? This call has range."

NVDA 0DTE TRADE SIGNAL – JULY 25, 2025
⚡ NVDA 0DTE TRADE SIGNAL – JULY 25, 2025 ⚡
🚀 Strong Bullish Momentum – But Friday Expiration = Gamma Trap?
⸻
📊 Market Stats:
• 💰 Call Volume: Strong
• 🔻 Weak Volume Overall
• ⚖️ Call/Put Ratio: Bullish
• 📈 RSI: Overbought but still pushing
• ⏳ Time Decay: Accelerating
• ☠️ Gamma Risk: 🔥 MAX today (0DTE)
⸻
🧠 Model Summary:
• Grok/xAI: 🔒 NO TRADE today – wait for Monday
• Claude: 🛑 Caution – avoid entries today
• DeepSeek: ⏸️ 4/5 Bullish, wait for cleaner setup
• Gemini: 💡 Suggests $180C next week
• Llama: ✅ Bullish bias, but gamma risk = no go for Friday
⸻
📌 TRADE IDEA: Wait for Monday
📍 Strike: $175 Call
📆 Expiry: Today (0DTE)
💵 Entry Price: $0.56
🎯 Target: $0.95
🛑 Stop: $0.30
📈 Confidence: 65%
🕒 Entry Timing: Monday open IF support holds
⸻
⚠️ Key Warning:
Don’t get trapped by 0DTE gamma swings. Momentum says yes, time decay says no…
✅ Best move? Watch NVDA closely, then strike on Monday if volume confirms.
⸻
👍 Like & save if you’re tracking NVDA.
🔁 Repost if you’re waiting for the perfect Monday setup!
#NVDA #OptionsTrading #0DTE #GammaRisk #BullishSetup #TradingView #TechStocks #WeeklyOptions

$NVDA WEEKLY TRADE IDEA – JULY 21, 2025
💥 NASDAQ:NVDA WEEKLY TRADE IDEA – JULY 21, 2025 💥
🔥 Bullish Options Flow + Weekly RSI Strength = Controlled Momentum Play
⸻
📊 Trade Details
🔹 Type: Long Call
🎯 Strike: $180.00
📆 Expiry: July 25, 2025 (4DTE)
💰 Entry: $0.51
🎯 Target: $1.02 (💯% Gain)
🛑 Stop: $0.20 (~40% Risk)
📈 Confidence: 65%
🕰️ Timing: Monday Open
📦 Size: 1 Contract (Adjust based on risk tolerance)
⸻
📈 Why This Trade?
✅ Call/Put Ratio = 1.48 → Bullish bias confirmed
📈 Weekly RSI = 77.0 → Strong momentum
🔻 Daily RSI = 80.8 (falling) → Short-term pullback risk
📉 Volume = flat (1.0x) → Weak confirmation = tighter risk mgmt
🧠 Strike Clustering: $177.50 & $180 = strong OI zones
🌬️ VIX = 16.7 → Favorable for long premium plays
⸻
⚠️ Risks & Strategy Notes
❗ Daily RSI = caution: short-term exhaustion possible
📉 Weak volume = lack of institutional chase
⏳ Exit before Friday – avoid IV crush and gamma slam
🔐 Set alerts at $178.75 and $179.80 – pre-breakout signals
⸻
🎯 Plan:
• Enter Monday open
• Scale partials if price hits +30–50%
• Full exit by Thursday unless price is breaking through $180 early with strong volume
⸻
🏁 Quick Verdict:
This is a momentum continuation setup, not a fresh breakout.
Play the trend, respect RSI signals, and cut fast if flow dries up.
NASDAQ:NVDA 180C — Risk $0.20 to Target $1.02
Let the call ride… just don’t overstay.
⸻
#NVDA #OptionsTrading #CallOption #WeeklyPlay #MomentumTrade #FlowBasedSetup #TradingViewIdeas #GammaPlay #BullishBias #NVIDIA

NVIDIA Robbery Plan: Bullish Swing Trade to Millions!🔥 NVIDIA (NVDA) Stock Heist Blueprint: Unlock Bullish Profits with Thief Trading Style! 🚀💰
🌟 Greetings, Wealth Warriors! 🌟
Hello, Ciao, Salaam, Bonjour, Hola, and Hallo to all you savvy traders and market masterminds! 🤑💸 Get ready to execute a high-octane trading plan with our Thief Trading Style—a bold fusion of technical precision and fundamental insights designed to crack the NVIDIA (NVDA) stock market vault! 💥📈
📝 The NVIDIA Heist Plan: Swing & Day Trading Mastery 🏆
Based on our proprietary Thief Trading Style, this plan targets NVIDIA (NVDA), currently riding a bullish wave fueled by strong fundamentals and technical setups. Follow the strategy outlined below to navigate the high-risk Red Zone—where overbought conditions, consolidation, and potential trend reversals create opportunities for sharp traders. 💪 Stay alert, as bearish players may set traps at key levels! 🕵️♂️
Entry Strategy: Crack the 🙂Vault! 🏦
Go long with confidence! The market is primed for a bullish breakout. Enter at current prices or set buy limit orders near recent swing lows/highs on the 15-minute or 30-minute timeframe. 📅
Pro Tip: Set price alerts on your chart to catch the optimal entry. Timing is everything in this heist! ⏰
Swing Traders: Look for pullbacks to key support levels for safer entries.
Scalpers: Focus on quick long-side trades with tight stops to maximize gains. 💨
Stop Loss: Protect Your Loot! 🔒
Place your stop loss (SL) below the recent swing low on the 30-minute timeframe (e.g., $162.00 for swing trades).
Adjust your SL based on your risk tolerance, position size, and number of orders. For larger accounts, consider tighter stops to lock in gains early. 🛡️
Scalpers: Use a trailing stop to secure profits while riding short-term momentum.
Take Profit Target: Cash Out Big! 💰
Aim for $191.00 as the primary target, or exit early if momentum slows.
Swing Traders: Hold for the full target if the trend remains strong.
Scalpers: Grab quick profits on smaller price spikes and re-enter on dips.
Pro Move: Use a trailing stop to let profits run while safeguarding gains. 🚀
📌Key Levels & Risk Management
Entry Zone: Market price or swing low – ideal for long positions. 📈
Stop Loss: $162.00 – based on 30m timeframe swing low. 🛑
Take Profit Target: $191.00 – primary target for swing/day trades. 🎯
Risky Red Zone: Overbought levels – watch for consolidation or reversal traps. ⚠️
💡 Why NVIDIA? The Bullish Case 📡
NVIDIA (NVDA) is powering through a bullish phase, driven by:
Fundamentals: Strong demand for AI, gaming, and data center chips. 📊
Macro Factors: Positive market sentiment and tech sector momentum. 🌍
COT Data (Latest Friday Update, UTC+1): Large speculators are increasing bullish positions, signaling confidence in NVDA’s upside (data sourced from reliable platforms). 📅
Geopolitical & News: Monitor upcoming earnings and industry developments for catalysts. 📰
Intermarket Analysis: Tech-heavy indices like the NASDAQ are trending higher, supporting NVDA’s rally. 📈
For a deeper dive, check fundamental reports, COT data, and sentiment analysis to align your trades with the bigger picture. 🔍
⚠️ Trading Alert: Navigate News & Volatility 🗞️
News releases can spark sharp price swings. To protect your capital:
Avoid new trades during major news events (e.g., earnings or Fed announcements). 🚫
Use trailing stops to lock in profits and limit downside risk. 🔐
Stay updated with real-time market developments to adjust your strategy dynamically. 📡
🚀 Boost the Heist! Support the Thief Trading Community 🤝
Love this plan? Hit the Boost Button to amplify our Thief Trading Style and empower our community to conquer the markets! 💥 Every like and share fuels our mission to make money with precision and style. 💪 Join us daily to unlock more high-profit heist plans! 🏴☠️
📌 Important Disclaimer
This analysis is for educational purposes only and not personalized investment advice. Always conduct your own research, assess your risk tolerance, and verify market conditions before trading. Markets move fast—stay sharp and adapt! ⚡
🌟 Stay tuned for the next heist plan, traders! Let’s keep stealing profits together! 🤑🐱👤🎉

Nvidia (NVDA) Share Price Surges Above $170Nvidia (NVDA) Share Price Surges Above $170
Yesterday, Nvidia’s (NVDA) share price rose by more than 4%, with the following developments:
→ It surpassed the psychological level of $170 per share;
→ Reached another all-time high;
→ Gained more than 9% since the beginning of the month.
The bullish sentiment is driven by Nvidia CEO Jensen Huang’s visit to China shortly after meeting with US President Trump. At the same time:
→ US Secretary of Commerce Howard Lutnick stated that the planned resumption of sales of Nvidia H20 AI chips in China is part of the US negotiations on rare earth metals.
→ The head of Nvidia stated that he was assured licences would be granted very quickly, and that a large number of orders for H20 chip deliveries had already been received from Chinese companies.
Market participants are viewing the situation with strong optimism, and analysts are raising their valuations for NVDA shares:
→ Morningstar analysts raised their fair value estimate for Nvidia shares from $140 to $170.
→ Oppenheimer analysts increased their target price from $170 to $200.
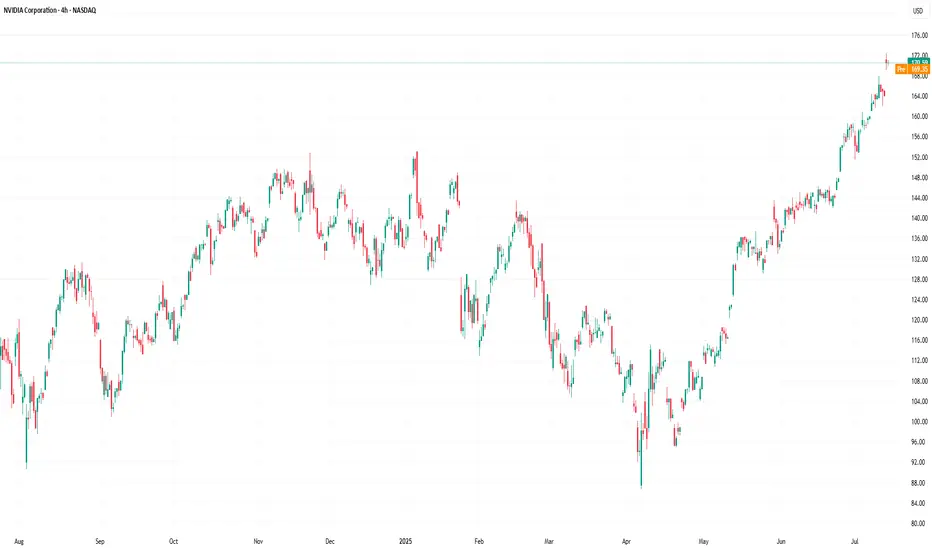
Technical Analysis of the NVDA Chart
The price trajectory of NVDA shares fully reflects the exceptionally strong demand:
→ The price is moving within an ascending channel with a steep growth angle;
→ Since early May, the RSI indicator on the 4-hour chart has not fallen below the 50 level;
→ Yesterday’s trading session opened with a large bullish gap.
The chart also shows the formation of a stable bullish market structure (shown with a purple broken line), expressed through a sequence of higher highs and higher lows.
Given the above, it is difficult to imagine what might cause a sharp shift from positive to negative sentiment. If a correction begins (for example, with a test of the $160 level), traders should watch for signs of its completion — this could present an opportunity to join the emerging rally.
This article represents the opinion of the Companies operating under the FXOpen brand only. It is not to be construed as an offer, solicitation, or recommendation with respect to products and services provided by the Companies operating under the FXOpen brand, nor is it to be considered financial advice.
$NVDA - $270 PT in BULL ChannelThe stock is currently bouncing off of the lower channel line of the rising Bull Channel. Price action has created a Cup and Handle. The projected Price Objective sits at around $270. Remember, the height of the cup is the project target which from current stock price extends to around $270.

Nvidia Market Capitalisation Reaches $4 TrillionNvidia Market Capitalisation Reaches $4 Trillion
Yesterday, Nvidia’s (NVDA) share price surpassed $162 for the first time in history. As a result, the company’s market capitalisation briefly exceeded $4 trillion during intraday trading (according to CNBC), making Nvidia the first publicly listed company to reach this milestone.
The rise in NVDA’s share price is being driven by both bullish sentiment across the broader equity market—which appears optimistic ahead of the upcoming Q2 earnings season—and evidence of sustained demand for Nvidia’s products, as artificial intelligence technologies continue to gain widespread adoption.
Noteworthy developments include:
→ Nvidia may begin producing a specialised AI chip for the Chinese market this autumn, potentially circumventing current export restrictions;
→ Perplexity, a company backed by Nvidia, is launching an AI-powered browser aimed at competing with Google Chrome.
Technical Analysis of NVDA Chart
In our previous analysis of NVDA’s price action, we:
→ Drew an ascending channel;
→ Highlighted bullish conviction in overcoming the $145–150 resistance zone.
The channel remains valid, with the current price trading near its upper boundary. However, the RSI indicator is showing signs of bearish divergence, suggesting that the stock may be vulnerable to a near-term correction—potentially towards the median line of the existing upward channel.
At the same time, a major shift in the prevailing bullish trend appears unlikely. The $145–150 range may serve as a key support zone for NVDA in the foreseeable future.
This article represents the opinion of the Companies operating under the FXOpen brand only. It is not to be construed as an offer, solicitation, or recommendation with respect to products and services provided by the Companies operating under the FXOpen brand, nor is it to be considered financial advice.

Nvidia - New all time highs!Nvidia - NASDAQ:NVDA - breaks out now:
(click chart above to see the in depth analysis👆🏻)
Within two and a half months, Nvidia rallied more than +70%. Following this recent bullish strength, a retest of the previous highs was totally expected. But this does not seem to be the end at all. There is a much higher chance that we will see new all time highs soon.
Levels to watch: $150
Keep your long term vision🙏🙏
Philip (BasicTrading)

NVDA Analysis To 164?Quick breakdown of NVDA
Appears we hit our corrected level, we could go deeper possibly or hold at this level and drive up to 164
This is looking like a nice little setup long indeed
Trade Smarter Live Better
Kris/Mindbloome Exchange

NVIDIANVIDIA is due for correction, anytime it can start. This week probably would be a good week to start the correction.
Disclosure: We are part of Trade Nation's Influencer program and receive a monthly fee for using their TradingView charts in our analysis.
