NVDA Bullish Setup | Structure, Momentum & Risk Defined🔥 NVDA Bullish Layered Accumulation Playbook (Swing Trade)
Asset:
NVDA – NVIDIA Corporation
NASDAQ Exchange | US Equities
🧭 Trade Thesis (Bullish Bias)
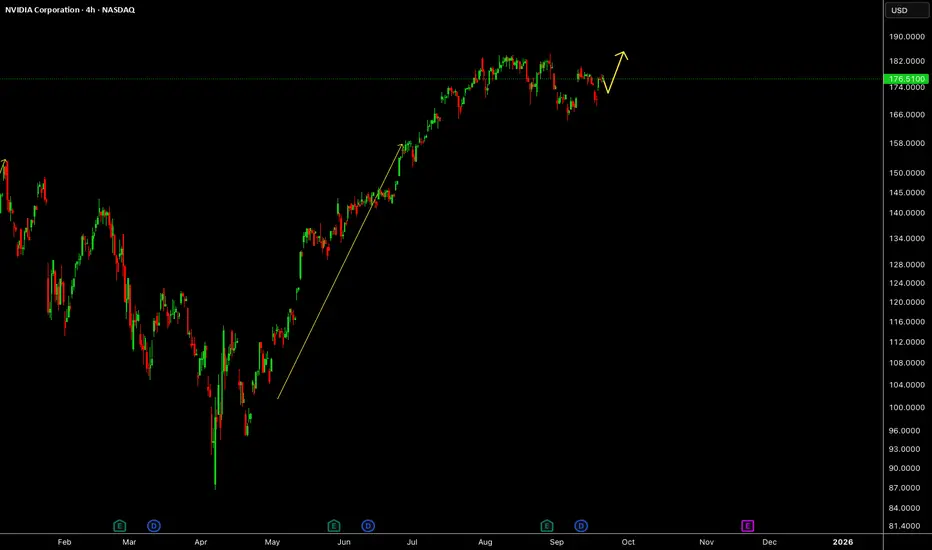
NVDA remains structurally strong within the broader AI, data-center, and semiconductor leadership cycle. Price action shows healthy pullback behavior within a dominant bullish trend, offering swing traders an opportunity to accumulate via layered entries instead of chasing breakouts.
This plan is designed using a layered limit-order approach (“thief-style accumulation”), allowing flexibility and improved average pricing during volatility.
🟢 Entry Strategy – Layered Accumulation (Thief Style)
Instead of a single entry, this plan uses multiple buy-limit layers to manage volatility and avoid emotional entries.
📌 Layered Buy Zones (example):
Buy Limit 1: $190.00
Buy Limit 2: $185.00
Buy Limit 3: $180.00
👉 Traders may add or adjust layers based on their own risk tolerance, timeframe, and volatility expectations.
👉 This structure allows participation from any price level, while improving cost basis if price dips.
🔴 Risk Management – Stop-Loss Zone
🛑 Protective Stop-Loss: $175.00
⚠️ Important Note (Risk Awareness):
Dear Ladies & Gentlemen (Thief OGs), this stop-loss level is not mandatory. Risk management is a personal decision — manage size responsibly and secure profits according to your own trading plan.
🎯 Target Zone – Profit Protection Area
🚧 Target: $205.00
This level aligns with:
Prior strong resistance (police barricade zone)
Signs of potential overbought conditions
Possible liquidity traps near highs
📌 The plan is to escape with profits, not to predict tops. Partial profit-taking is encouraged as price approaches resistance.
⚠️ TP Reminder:
This take-profit level is guidance only. Traders are free to secure gains based on their own strategy and market conditions.
📊 Technical Context (Clean & TradingView-Friendly)
Bullish higher-timeframe structure intact
Pullback within trend = accumulation opportunity
Layered entries reduce timing risk
Resistance overhead justifies disciplined exits
🌍 Fundamental & Economic Factors Supporting NVDA
Fundamental Drivers:
NVIDIA remains a core leader in AI chips, data centers, and accelerated computing
Strong demand from cloud providers, AI infrastructure, and enterprise compute
Ongoing investment in next-gen GPUs and AI platforms
Macro & Economic Considerations:
US tech sector strength tied to AI capex cycles
Market sensitivity to interest-rate expectations and inflation data
Risk-on sentiment generally benefits high-growth semiconductor leaders
📌 Watch upcoming:
US CPI / PPI inflation data
Federal Reserve rate guidance
Earnings or forward-looking statements impacting AI demand expectations
🔗 Related Symbols to Watch (Correlation Check)
NASDAQ:SOXX / NASDAQ:SMH – Semiconductor ETFs (sector health confirmation)
NASDAQ:QQQ / NASDAQ:NDX – Nasdaq strength supports NVDA momentum
NASDAQ:AMD – Peer comparison and sentiment gauge
NASDAQ:MSFT / NASDAQ:GOOGL – AI infrastructure demand correlation
📈 Strength in these symbols often confirms bullish continuation in NVDA.
🧠 Master Trader Note (Correction & Guidance)
You’re not “wrong” in asking for layered entries at any price level — this is a valid accumulation methodology. The key improvement is clarity, structure, and risk framing, which ensures the idea remains educational, compliant, and professional rather than promotional or misleading.
✨ “If you find value in my analysis, a 👍 and 🚀 boost is much appreciated — it helps me share more setups with the community!”
⚠️ Disclaimer: This is a thief-style trading strategy just for fun. This analysis is for educational purposes only and does not constitute financial advice. Trade responsibly.
Nvdia

NVDA Bull Flag: Breakout Toward 220–230NVDA’s 1D chart remains firmly bullish. Price cleared the ~$195 “BOS” and pushed to fresh highs above $205, with MA20 > MA60 > MA120 and widening bands supporting momentum. The near-term map is clear: Demand sits around $183 (former ceiling turned floor), while supply is forming at the new swing high near $209.50.
Primary path: I’m looking for continuation on strength. A daily close above 209.50 would confirm buyers in control and opens room toward 220–225, with a stretch scope to 230 if momentum persists. If price hesitates first, a constructive retest of 195–198 (prior breakout area) can serve as the higher-low buy zone—especially if volume firms and intraday closes reclaim $200–203 quickly.
Alternative: Failure to hold recent gains brings a deeper check. A daily close below 203.00 risks a slide toward the $200 psych handle and then $195–198. The broader bullish thesis is invalidated on a decisive daily close below 183.00, which would mark a clear break of structure and shift the bias back to neutral/bearish until reclaimed.
Triggers to watch: daily close > 209.50 for continuation; weakness below 203.00 for a corrective leg. Manage entries around 195–198 or on strength through 209.50, and keep risk tight relative to 203/183 lines. This is a study, not financial advice. Manage risk and invalidations.

NVDA Bullish Breakout: Retest or Close Above 212.19 Toward 225NVDA’s daily chart remains firmly bullish after a clean breakout from a multi-month rectangle. Price is riding a MA20 > MA60 > MA120 stack, Bollinger Bands are expanding, and MACD momentum has flipped higher. The last close near $207.04 came on strong breadth, keeping buyers in control while price consolidates just under the recent high.
Primary path: look for a controlled pullback into the former ceiling at $198.00–$202.00 to act as demand. A constructive reaction there keeps the breakout intact and favors a grind into $210–$215 first, with the measured move pointing toward $225 as momentum persists. Alternatively, strength can skip the retest— a decisive daily close above $212.19 would confirm continuation and unlock the same upside roadmap.
Invalidation sits below the range top: a daily close back under $195.00 would negate the breakout and re-open downside toward the prior consolidation zone, with risk of a slide toward the $188 area if sellers press. Until then, the bias stays bullish with $198.00–$202.00 as the key line in the sand and $212.19 the trigger for fresh highs.
This is a study, not financial advice. Manage risk and invalidations

NVDIANVDIA has one more push up to take all time high.
Disclosure: We are part of Trade Nation's Influencer program and receive a monthly fee for using their TradingView charts in our analysis.
Dow Eyes 45,700-Resistance for Breakout ConfirmationDespite consistently beating market expectations with strong earnings, Nvidia’s Q3 outlook is under pressure. China’s restrictions on importing Nvidia’s H20 chips due to security concerns have weighed on the stock, preventing it from reaching new highs.
Both Nasdaq and Nvidia shares are still trading below their respective record highs, limiting upside potential for the Dow and S&P 500, especially in light of ongoing US-EU political and economic instability.
While the Dow Jones holds above the 45,000 mark, it now faces key resistance at 45,700, which must be comfortably breached to confirm further bullish continuation toward 46,200, 47,100, and 48,000. These levels align with the upper boundary of a well-respected ascending channel in place since May 2025.
On the downside, should political and economic pressures dampen risk appetite, and if overbought RSI conditions resurface, a drop below 45,000 may open the door to further losses toward 44,500 and 43,800.
Written by Razan Hilal, CMT

Nasdaq Eyes the 23,700 Resistance Ahead of NVDIA EarningsOn the Nasdaq front, all eyes are on NVIDIA’s Q2 earnings, with expectations for revenue around 45.9B and EPS between 1.00–1.01. While enthusiasm around AI continues to drive tech optimism, concerns remain over tariff risks with China, particularly regarding potential backdoors or tracking technologies in NVIDIA chips. These risks could limit revenue potential from the Chinese market
Nasdaq's rebound from the 22,900 mark appears sustainable, with daily RSI holding above the 50 neutral-barrier. A clean hold above 23,700 and 24,100 could pave the way toward new highs at 24,400 and 24,700, in line with continued AI-driven growth.
Downside: A break below 23,200, 22,900, and especially 22,700 would signal broader tech sector weakness, potentially aligning price action with 22,300 and 21,900 support zones.
Written by Razan Hilal, CMT

Traders caught off guard --- Now NVDA's Reverse Cup and HandleTraders were caught off guard by Federal Reserve Chairman Jerome Powell’s unexpectedly dovish tone at the Jackson Hole symposium.
In his keynote, Powell highlighted softening inflation risks and growing concerns over the labour market, boosting market expectations of a 25-basis point rate cut in September.
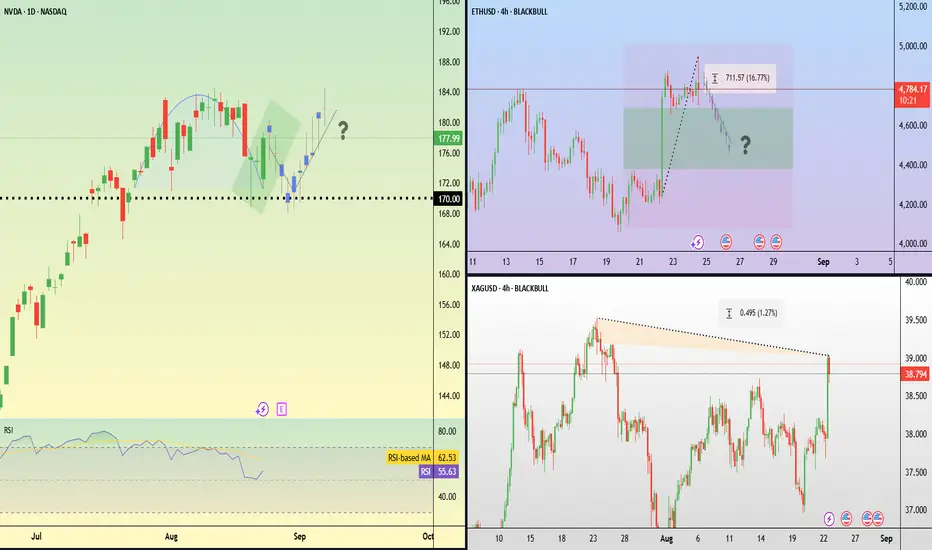
The speech ignited a strong cross-asset rally. Equities surged, with the S&P 500 up 1.5% and the Nasdaq advancing 1.9%. Ethereum led digital assets higher, soaring 15%, climbing as high as $4,950 and surpassing its previous November 2021 high of $4,866. Silver also rallied, touching $39 per ounce and moving closer to its 14-year peak of $39.5 reached at the end of July.
Looking ahead, U.S. markets will turn their focus to Nvidia’s upcoming earnings results. Price action shows a series of higher highs and higher lows, but the stock has recently faced resistance near $190. Price potentially remains supported around $170, which aligns with the breakout zone from early August.
Quantum's TSLA & NVDA Trades 8/1/25Simply breaking down what I look at going into the trading day. Premarket watchlist was short but nailed TSLA short for 150% and could have made double that on TSLA and NVDA longs. Due to hitting my daily goals I had to walk away to avoid overtrading but what an amazing day.

Nvidia Market Capitalisation Reaches $4 TrillionNvidia Market Capitalisation Reaches $4 Trillion
Yesterday, Nvidia’s (NVDA) share price surpassed $162 for the first time in history. As a result, the company’s market capitalisation briefly exceeded $4 trillion during intraday trading (according to CNBC), making Nvidia the first publicly listed company to reach this milestone.
The rise in NVDA’s share price is being driven by both bullish sentiment across the broader equity market—which appears optimistic ahead of the upcoming Q2 earnings season—and evidence of sustained demand for Nvidia’s products, as artificial intelligence technologies continue to gain widespread adoption.
Noteworthy developments include:
→ Nvidia may begin producing a specialised AI chip for the Chinese market this autumn, potentially circumventing current export restrictions;
→ Perplexity, a company backed by Nvidia, is launching an AI-powered browser aimed at competing with Google Chrome.
Technical Analysis of NVDA Chart
In our previous analysis of NVDA’s price action, we:
→ Drew an ascending channel;
→ Highlighted bullish conviction in overcoming the $145–150 resistance zone.
The channel remains valid, with the current price trading near its upper boundary. However, the RSI indicator is showing signs of bearish divergence, suggesting that the stock may be vulnerable to a near-term correction—potentially towards the median line of the existing upward channel.
At the same time, a major shift in the prevailing bullish trend appears unlikely. The $145–150 range may serve as a key support zone for NVDA in the foreseeable future.
This article represents the opinion of the Companies operating under the FXOpen brand only. It is not to be construed as an offer, solicitation, or recommendation with respect to products and services provided by the Companies operating under the FXOpen brand, nor is it to be considered financial advice.

NVDA$ - possible pullback to $50 (-67% from pick) in the making.NASDAQ:NVDA have done this before (67% pullbacks after long rally).
NVDA is following very predictable patterns for many years now, despite excitement around this stock - stock made "new recent low" and current rally maybe just a part of a "head and shoulders" in the making. If "new all time high" is not reached with in the next few weeks - we will see stock pullback to $50 or less in the next 6-9 month.

NVIDIA (NVDA) – Ending Diagonal at the Top? 126 Next?NVDA is currently trading inside a potential ending diagonal, often signaling a reversal or strong correction. With multiple Breaks of Structure (BoS) and a visible Fair Value Gap (FVG) left behind, this setup is aligning with Smart Money Concepts.
📉 Bearish Rejection Expected?
Price might sweep liquidity and revisit the 126–129 demand zone, where strong unmitigated orders sit. If this zone holds, a bullish continuation toward 152+ is likely.
🔍 Key Highlights:
⚠️ Ending Diagonal pattern near local top
📊 Multiple BoS confirming internal structure shifts
📉 Unfilled Fair Value Gap (FVG) near 129
🟩 Strong demand zones at 129–126 and 108
🔄 Potential liquidity sweep before reversal
🧠 Smart money footprint visible
📅 Watch for price reaction around 129.8–126.1.
📈 Breakout above 145 with strength may invalidate the drop.

NVDIANVDIA will not back down until 158-160 level is reached. Wait for setup and aim for the target.
Disclosure: We are part of Trade Nation's Influencer program and receive a monthly fee for using their TradingView charts in our analysis.

Nasdaq Holds Above 21,000 Ahead of NVIDIA EarningsDespite Risk-Off Headlines, Nasdaq Remains Resilient
AI remains embedded in long-term national strategies across 2030 and beyond, which is keeping tech resilient even amid trade uncertainty and weaker economic data. Markets are now eyeing NVIDIA’s earnings on Wednesday. Expectations are high, but the announcement could raise volatility risks, particularly heading into Wednesday evening and Thursday's U.S. market open.
The Nasdaq remains in a bullish zone above the neckline of a double top pattern that formed between December 2024 and February 2025. Price action is currently consolidating between the 21,500 resistance and the 20,800 support.
A clear breakout above 21,500 could push the index toward 22,200 and potentially the next major high near 23,700.
Conversely, a decisive close below 20,800–20,600 would signal increased selling pressure, targeting 19,600 and 19,100.
- Razan Hilal, CMT

FREE Day Trade Setup 15April: $NVDA🚨 FREE Day Trade Setup: NASDAQ:NVDA 🚨
🚀 Bullish Scenario:
Entry: Break above $111.88 (S/R Area)
🎯 Targets: 10% / $112.70, $114.05, PDH
📈 Instruments:
Options: April 18th $112 Calls
🚪 Exit: Close below H5 on chosen timeframe (2m / 5m / 15m)
📉 Bearish Scenario:
Entry: Break below PDL at $109.07
🎯 Targets: 10% / $108.01, $106.92, $105.77
📉 Instruments:
Options: April 18th $109 Puts
🚪 Exit: Close below H5 on chosen timeframe (2m / 5m / 15m)
Not Financial Advice

NVIDIA: Time for a Graphic Comeback?🔍Analysis:
Following up from a previous breakdown, NVIDIA has now tapped into a high-probability Weekly Order Block (OB) just above the sell-side liquidity zone at $88.97. This level also aligns with a structural area of support, making it a prime zone for a potential bullish reversal.
Key signs:
Price is showing early signs of displacement from the OB.
If this zone holds, we could be looking at a 77% move back up to the buyside liquidity at $157.92.
Watch for a strong weekly candle close above $96.30 to confirm the bounce.
🛑 Invalidation:
If price fails to hold this OB and breaks below $88.97, expect a deeper move into the $76.06 zone.
💡 Summary:
Patience is key. We’re sitting on a solid base for a potential bullish push — now it’s all about the confirmation candle. 📊
DYOR — Don't just HODL, study the chart!

OH NO! $SOXS is primed for a significant rise.The concept of a multiple bottom suggests that the stock has already experienced a significant decline, creating a buying opportunity at a lower price over time.
Plus, Trump is coming= BYE semidocutor stocks!
Stricter trade policies and tariffs on imported semiconductors could disrupt global supply chains, leading to higher costs and potential shortages.
During his previous presidency, Trump focused on "America First" policies, which included promoting domestic manufacturing and reducing reliance on foreign supply chains
Additionally, there were concerns about the potential mismanagement of federal initiatives like the CHIPS and Science Act, which aimed to boost domestic semiconductor manufacturing.
AMEX:SOXL , NASDAQ:NVDA , NASDAQ:AMD , NASDAQ:AVGO , NASDAQ:QCOM : Sell now to take the profit.
IT'S COMING

Will you dare to short NVDIA at 122? Shorting NVDIA something no one would have dared to do in 2024 and rightfully so. It was having a massive uptrend and there was no reason to go against it.
2025 is completely different story. The emergence of DeepSeek has dampened its prospects and NVDIA saw a massive double top at 152 (The same time S&P reversed at 6144).
It has now fallen to a low of 107 and made its way back to 121 where there is a pattern to sell. Here is our thinking:
1) It is in a daily downtrend
2) It is following the H4 trend
3) There is a pattern to sell
4) RSI divergence is present
We will sell around 122 with a stop loss of 125.50 and target the low of 107.
Yes, we just follow the trend and not the news or sentiments.

NVDIANVDIA is close to completing bigger correction, soon enough we will head to break the top minimum.
Disclosure: We are part of Trade Nation's Influencer program and receive a monthly fee for using their TradingView charts in our analysis.

SPX S&P 500 Gearing Up For A 10x Over Next 10 yearsSPX looks extremely bullish and the patterns are obvious to me. This parabola will continue into the 2030's and be even more vertical than we've seen in any prior runs. This next decade is going to be wonderful. There may be some corrections along the way but in the bigger picture we are going to go absolutely vertical. Hold onto your hats.
None of this is financial advice just my opinion.

NVDA to 151? Morning Trading Fam
Currently this is what I am seeing with NVDA, looks like we have decent support around 118 if that level holds I can see us driving up to 144 then 151 from here. However if we break through the 118 support: we could possibly see a massive breakdown down to 87-88 dollar range.
Kris/ Mindbloome Exchange
Trade Smarter Live Better

$42 TARGET $RXRX BUY NOW!The triple bottom chart pattern usually emerges after an extended downtrend with bears dominating the market. While the first bottom might reflect regular price fluctuations, the second bottom signals that the bulls are gathering strength and gearing up for a potential reversal. The third bottom demonstrates robust support, suggesting that bears may surrender when the price surpasses resistance levels.
ALSO: Investing in Recursion Pharmaceuticals (RXRX) offers intriguing possibilities for several reasons:
Innovative Technology: NASDAQ:RXRX utilizes artificial intelligence (AI) and machine learning to expedite drug discovery. Their BioHive-2 supercomputer, powered by Nvidia AI chips, is among the most powerful accelerated computing systems globally.
Partnerships: NASDAQ:RXRX has formed alliances with major tech and healthcare leaders, including Nvidia ( NASDAQ:NVDA ), which invested $50 million into its operations. These collaborations aim to streamline drug discovery, making it faster and more cost-effective.
Promising Pipeline: NASDAQ:RXRX boasts a strong lineup of drug candidates, and their technology has already shown promising results. Their merger with Exscientia, another biotech company focused on AI-driven drug discovery, has created a more robust, vertically integrated platform.
Potential for High Returns: While investing in NASDAQ:RXRX involves risks, it also holds the potential for significant returns. The company's innovative approach could transform the healthcare industry, making it a potential "10-bagger" (a stock that increases tenfold in value).
Long-term Vision: RXRX seeks to shorten the drug discovery process from years to months and significantly reduce costs. This long-term vision could lead to substantial growth if successful.


