Nvidia - The -25% correction starts now!✂️Nvidia ( NASDAQ:NVDA ) is about to create a correction:
🔎Analysis summary:
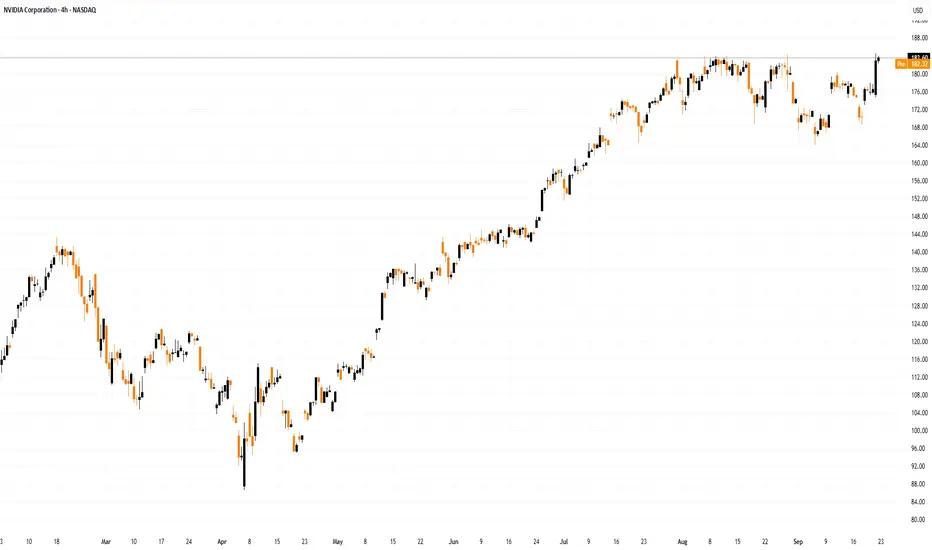
After Nvidia retested major support in mid 2025, we saw another rally of about +125%. But now, Nvidia is rejecting a major resistance trendline and is about to create bearish confirmation. Quite likely that Nvidia will create a major -25% correction in the future.
📝Levels to watch:
$140
SwingTraderPhil
SwingTrading.Simplified. | Investing.Simplified. | #LONGTERMVISION
Nvidia_analysis

Nvidia - This is all still expected!🥊Nvidia ( NASDAQ:NVDA ) is heading for another -20%:
🔎Analysis summary:
Just last month, Nvidia created a massive bearish engulfing candle. This clearly shows that buyers are not willing to accept higher prices. Together with the retest of the major resistance trendline, Nvidia is heading lower. The next support will come at about -20%.
📝Levels to watch:
$150
SwingTraderPhil
SwingTrading.Simplified. | Investing.Simplified. | #LONGTERMVISION

Nvidia - The correction just started!💉Nvidia ( NASDAQ:NVDA ) is now heading lower:
🔎Analysis summary:
Just recently, Nvidia once again retested the major rising channel resistance trendline. Together with November's bearish engulfing candle, Nvidia is slowly shifting bearish. And before Nvidia will retest the next major support area, we can see a drop of another -15%.
📝Levels to watch:
$150
SwingTraderPhil
SwingTrading.Simplified. | Investing.Simplified. | #LONGTERMVISION

NVIDIA must hold $169A clear line in the sand is evident (in my eyes)
Closing beneath $169 could beget further selloffs and trigger a Head and shoulders pattern.
Which projects down to $135.
Around a -36% Haircut
At which point it could represent really good value to the long side.

Nvidia - Now is the time to go short!💣Nvidia ( NASDAQ:NVDA ) is now creating a top:
🔎Analysis summary:
Just a couple of days ago, Nvidia perfectly retested a major resistance trendline. Always in the past, such a retest was followed by a major move towards the downside. Therefore, Nvidia is preparing for a major drop, which could lead to another -25% drop in the future.
📝Levels to watch:
$180 and $140 and $100
SwingTraderPhil
SwingTrading.Simplified. | Investing.Simplified. | #LONGTERMVISION

$NVDA - $140 Target - Short Position - AI Bubble About to BurstIn my opinion, Nvidia does not have much to continue the next needed support for a pro-longed bull run, at least in terms of sentiment. The AI bubble has gone on for too long and the actual multiples of valuations in comparison to revenue and profit generations do not seem to have strong support when considering traditional investing strategies. Also, the next wave seems getting closer and closer to a red trend. Retracement potential is possible after hitting $140, but Nvidia needs to do far more benefit for the public good and have a differentiation that doesn't rely on trends such as crypto mining and the boost of LLMs. As always, none of this is investment or financial advice. Please do your own due diligence and research.
I guess it is a bubble...When the CEO is selling, the CFO is selling, SoftBank is unloading, Peter Thiel is selling, and Michael Burry is short, you have to stop and ask the only question that matters:
Is it actually smart to buy the dip here?
I didn’t even bother checking the latest SMH holdings, but if anyone wants to post the updated weightings, it would help frame how much passive-flow risk still sits above price.
The real question is whether there’s room left on the downside and whether this is anywhere near a bottom. If you want an example of how low “too low” can go, just study META during its unwinding. Fundamentals didn’t matter. Valuation didn’t matter. Price just kept repricing until forced sellers were done.
The one positive about this environment is volatility. When liquidity thins out and ranges widen, both sides can pull money out — but only if you treat it like a scalp environment, not a swing-long hero trade.
Because think about it rationally:
Do you want to be the one buying while billionaires, insiders, and institutions are selling into strength?
We’re moving into year-end — historically the period where funds clean books, tax-loss harvest, and unwind risk. Pair that with the probability of crypto-liquidation bleed-through, and you can easily get a chain reaction. Markets don’t fall in straight lines; they fall like Jenga blocks, dominoes, or a card tower collapsing from the bottom up.
This isn’t doom posting — it’s just market structure.
Flow dictates direction, and right now the flow is one-directional.

Nvidia Erases Post-Earnings RallyShortly after publishing its earnings, shares of tech giant Nvidia jumped more than 5% at the start of the session; however, a new bearish sentiment quickly took hold of the market, and the stock fell over 7% in the final trading hours, wiping out the gains seen after the results. The company reported strong figures, with revenue of $57 billion, above the expected $54 billion, and projected fourth-quarter sales near $65 billion.
Despite the positive numbers, selling pressure began weighing on the price, mainly because the optimism was likely already priced in, prompting short-term profit-taking. In addition, growing concerns about emerging competition have fueled ongoing weakness in the stock. If market confidence fails to recover soon, selling pressure could intensify in the coming sessions.
Uptrend Losing Momentum
Since November 11, indecisive price action has led to a break of the long-standing upward trendline that had been guiding the stock’s movement. This uncertainty has created a short-term sideways range, with a ceiling at $196 and a floor at $179 per share. As long as these levels hold, a neutral and sideways phase is likely to dominate, indicating lack of clear direction in the short term.
RSI
The RSI remains slightly below the neutral 50 level, suggesting that selling momentum slightly outweighs buying pressure, though not strongly enough to establish a consistent short-term trend. As long as the RSI stays near 50, neutrality in price movement is likely to persist.
TRIX
The TRIX indicator shows a downward slope, moving closer to the zero line, indicating a balance in the strength of the exponential moving averages. This reinforces the indecision in the stock’s short-term behavior.
Key Levels to Watch:
$196 – Main Resistance: Corresponds to the most recent upward retracement zone. A break above this level could revive the bullish bias and reactivate the long-term uptrend.
$188 – Nearby Barrier: Area aligned with the 50-period simple moving average. Price moves near this level could support the formation of a more defined sideways range.
$179 – Key Support: Represents the lowest area from the past two months and serves as the most critical bearish barrier. A drop below this level could trigger a stronger selling bias and mark the start of a short-term downtrend.
Written by Julian Pineda, CFA, CMT – Market Analyst

Breaking: Nvidia ($NVDA) Crush Q3 Earnings Nvidia ( NASDAQ:NVDA ) stock saw a noteworthy uptick of 5% in early Thursday premarket trading albeit market turmoil. The asset reported earnings yesterday after market close sparking bullish sentiment.
The asset is approaching the $200 resistant as the RSI is at 47 giving room for massive upside.
The Shares of Nvidia popped in premarket trade after the U.S. firm beat expectations in third-quarter results after the closing bell on Wednesday.
Shares were last trading 5.5% higher at 4:15 a.m. ET.
Nvidia topped forecasts for revenue, which jumped 62% to $57.01 billion year-on-year, and issued stronger-than-expected fourth-quarter sales guidance.
“There’s been a lot of talk about an AI bubble,” Nvidia CEO Jensen Huang told investors on an earnings call, as the firm set out its view of the industry. “From our vantage point, we see something very different.”
Financial Performance
In 2024, NVIDIA's revenue was $130.50 billion, an increase of 114.20% compared to the previous year's $60.92 billion. Earnings were $72.88 billion, an increase of 144.89%.
Financial Performance
In 2024, NVIDIA's revenue was $130.50 billion, an increase of 114.20% compared to the previous year's $60.92 billion. Earnings were $72.88 billion, an increase of 144.89%.
About NVDA
NVIDIA Corporation, a computing infrastructure company, provides graphics and compute and networking solutions in the United States, Singapore, Taiwan, China, Hong Kong, and internationally. The Compute & Networking segment includes its Data Centre accelerated computing platforms and artificial intelligence solutions and software; networking; automotive platforms and autonomous and electric vehicle solutions; Jetson for robotics and other embedded platforms; and DGX Cloud computing services.

Nvidia (NASDAQ: $NVDA) Smashes Q3 Expectations on AI Demand Nvidia (NASDAQ: NASDAQ:NVDA , XETRA:NVD) posted another blockbuster quarter as its fiscal Q3 results exceeded Wall Street expectations, powered almost entirely by explosive demand for its AI-focused data center chips. Revenue reached $57.01 billion, beating the $55.19 billion consensus and climbing 62% year-over-year. Adjusted EPS came in at $1.30, up 60% from last year and 24% sequentially.
The data center division once again carried the quarter with $51.2 billion in revenue, outperforming analyst estimates of $49.34 billion and rising 66% from a year ago. Nvidia highlighted record demand for its Blackwell platform, which delivers industry-leading performance and 10x throughput per megawatt compared to previous generations. CEO Jensen Huang said AI compute demand continues to accelerate across both training and inference, calling it a “virtuous cycle of AI.”
Other business segments posted mixed results. Gaming revenue grew 30% year-over-year to $4.3 billion but dipped slightly from the previous quarter. Professional visualization revenue increased 56% to $760 million, and automotive revenue rose 32% to $590 million, reflecting steady diversification outside core AI markets.
Nvidia reported adjusted operating income of $37.75 billion and adjusted net income of $31.77 billion, both well above expectations. Free cash flow hit $22.09 billion, and the company returned $37 billion to shareholders through dividends and buybacks in the first nine months of fiscal 2026.
For Q4, Nvidia guided revenue of $65 billion, well above the $61.98 billion consensus, and projected gross margins around 75%. The company expects global AI adoption to accelerate further as more startups, enterprises, and countries ramp up model development.
Shares rose 3.7% in after-hours trading following the earnings release.

Ahead of Nvidia’s (NVDA) Earnings: How the Price Could MoveAhead of Nvidia’s (NVDA) Earnings: How the Price Could Move
On Wednesday, after the close of the main US trading session, Nvidia will release its quarterly results — a report seen not merely as another batch of corporate data but as a crucial test for the entire AI-driven bull run.
NVDA shares are up more than 40% since the start of the year, and the company must now prove that this surge is justified and that the AI revolution is still accelerating. According to media reports, Wall Street analysts remain optimistic:
→ Revenue: forecast around $54.9bn, implying roughly 56% year-on-year growth.
→ Earnings per share (EPS): about $1.25 (previous quarter: $1.05).
What should investors focus on?
Of particular importance will be:
→ data on Data Centre revenue, a key indicator of whether the AI boom remains intact;
→ forward guidance, as the market is looking for reassurance that Big Tech will continue to spend heavily on AI.
Technical Analysis of the Nvidia (NVDA) Chart
Recent price action in NVDA points to a sequence that can be interpreted as bearish:
→ 28 October: a strong rally above the psychological $200 level;
→ a failure to hold above that barrier;
→ a pullback on rising volumes (Nasdaq data) with expanding candles in early November.
In the broader market context, it is notable that early November has seen NVDA underperforming major equity indices, signalling firm resistance from sellers around $200.
From a bullish perspective, the decline from the all-time high resembles a correction pattern (shown in red) within a larger uptrend.
However, there is a risk that the market’s high expectations will not be met when the earnings report is published. If that happens, NVDA could extend its decline towards the lower boundary of the rising channel, where support lies near $165.
This article represents the opinion of the Companies operating under the FXOpen brand only. It is not to be construed as an offer, solicitation, or recommendation with respect to products and services provided by the Companies operating under the FXOpen brand, nor is it to be considered financial advice.

Nvidia - Squeezing every single bear!🧯NVidia ( NASDAQ:NVDA ) is finally breaking out:
🔎Analysis summary:
Over the course of the past couple of months, Nvidia has been rallying +125%. Considering the market cap of Nvidia, this is already an insane move but clearly not the end. We can still see another +25% from here, before Nvidia will then retest the next resistance.
📝Levels to watch:
$250
SwingTraderPhil
SwingTrading.Simplified. | Investing.Simplified. | #LONGTERMVISION

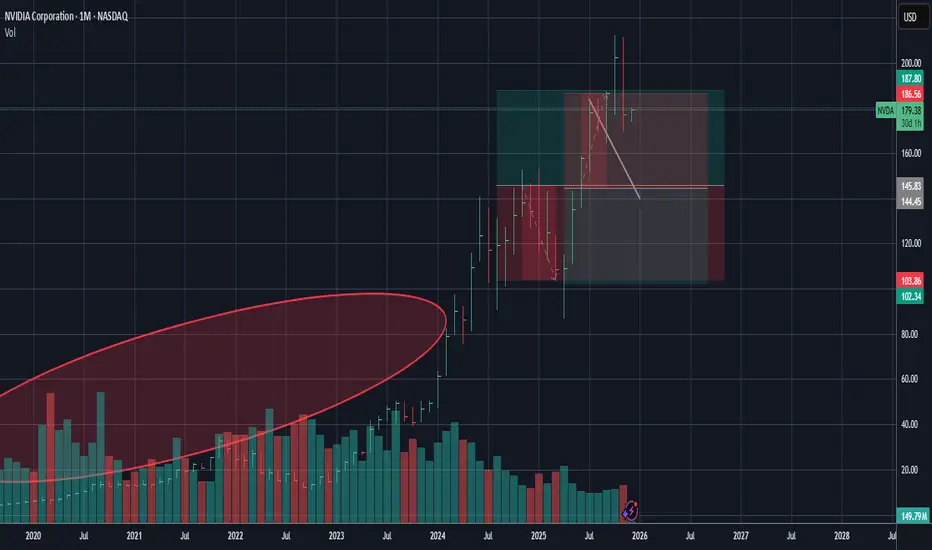
Nvidia Denies $1B Mexico Plan, Eyes Key SupportNvidia Corporation (NASDAQ: NASDAQ:NVDA ) came under brief scrutiny on Wednesday after reports suggested a $1 billion investment in a new data center project in Nuevo León, Mexico. The tech giant has since denied any financial involvement, clarifying that its role in Latin America remains limited to collaborative initiatives, research, and talent development, not direct infrastructure spending.
The confusion began when the state’s governor, Samuel García, publicly announced the investment alongside individuals presented as Nvidia representatives. However, later corrections confirmed that the green hydrogen data center would actually be built by CIPRE Holding, utilizing Nvidia’s technology rather than capital.
Despite the miscommunication, the news had little fundamental impact on Nvidia’s long-term growth narrative. The company remains the dominant force in AI semiconductors, with global demand for GPUs powering everything from data centers to generative AI models. However, short-term volatility persists amid global tech supply pressures, tighter U.S.–China chip export controls, and broader market repricing ahead of potential U.S. interest rate cuts in December.
From a technical perspective, NVDA recently hit resistance near the $212 high before retracing. The chart suggests potential for a healthy correction toward the $155 support range, which coincides with a strong accumulation zone from mid-2025. A rebound from this level could fuel a continuation toward $230–$240, resuming Nvidia’s dominant uptrend.
Investors remain focused on upcoming quarterly earnings and the broader market’s reaction to monetary easing expectations. A confirmed rate cut could renew institutional appetite for high-growth tech names, keeping Nvidia positioned as one of the most favored equities in the AI sector.
Nvidia Stock Fails to Return to the $200 LevelAlthough Nvidia seemed poised to start the week with an optimistic bias, partly driven by the end of the U.S. government shutdown, which has generated a short-term confidence boost, the stock has begun to show a bearish tone in the current session, posting a decline of more than 2%. This weakness is mainly due to recent comments from the SoftBank Group, which sold its entire stake in Nvidia for approximately US$ 5.8 billion, raising concerns about a possible reduction in exposure to the semiconductor industry in the short term. This event has led to growing investor caution toward the stock and currently maintains a notable selling bias in the market.
Uptrend Tries to Hold
Despite recent downward corrections that have halted the stock’s steady advance, Nvidia has yet to show a decisive bearish move that would end the long-term uptrend line. In the broader picture, buying momentum continues to hold firm. However, if selling pressure continues to strengthen, the uptrend could be at risk, especially if the price falls below the 50-period moving average.
RSI
The RSI indicator line is gradually approaching the neutral level of 50, suggesting a balance between buying and selling forces over the last 14 trading sessions. As long as this equilibrium remains, the stock is likely to continue showing indecisive movements in the coming days.
TRIX
The TRIX indicator remains above the neutral level of 0, indicating that in the long-term outlook, bullish strength continues to dominate the average of exponential moving averages. As long as the TRIX stays above this level, the bullish bias may remain intact, allowing the uptrend line to continue defending its position over the coming weeks.
Key Levels to Watch:
208 USD – Major Resistance: Corresponds to the area of recent highs. Price movements breaking above this level could trigger stronger buying pressure, reinforcing the current uptrend.
200 USD – Nearby Resistance: A key psychological level. Price action above this zone would reactivate a short-term bullish bias and reduce the risk of a trendline breakdown.
184 USD – Key Support: This is the most relevant support area, coinciding with the 50-period moving average and the Ichimoku cloud, which increases its significance. Downward movements reaching this zone could end the long-term bullish structure and lead to a period of indecision or the formation of a short-term consolidation range.
Written by Julian Pineda, CFA, CMT – Market Analyst

Nvidia - The next rally of +33% started!🚀Nvidia ( NASDAQ:NVDA ) just broke out:
🔎Analysis summary:
Over the past couple of months, Nvidia has been rallying an expected +100%. However, just objectively looking at the chart, this rally is not over yet. After the confirmed all time high breakout, Nvidia can rally another +33% until it will retest a substantial resistance level.
📝Levels to watch:
$250
SwingTraderPhil
SwingTrading.Simplified. | Investing.Simplified. | #LONGTERMVISION

Nvidia Stock Nears the $200 MarkNvidia’s stock has gained more than 4% over the last three trading sessions. The price currently hovers slightly above $190 per share, marking new record highs and moving closer to the psychological level of $200.
Buying pressure has intensified after the U.S. government authorized a series of agreements allowing the export of advanced artificial intelligence chips to the United Arab Emirates, opening a strategic trade channel with the Middle East. This development has strengthened investor confidence, fueled by higher long-term revenue expectations for the company. As a result, buying momentum may continue to dominate in the short term.
Relevant Uptrend
Since early April, the stock has maintained a steady upward trend, consistently posting new highs that confirm a dominant bullish bias on the broader chart. So far, there have been no significant corrections threatening this structure, leaving the uptrend line as the key reference for short-term movements.
However, as the price approaches the $200 level, a phase of indecision could emerge due to signs of buyer exhaustion, reflected in the formation of weakening candles. This behavior could lead to technical pullbacks within the broader bullish trend.
RSI
The RSI line remains above the 50 level, indicating that buying momentum remains dominant over the past 14 trading sessions. However, the indicator is gradually approaching the overbought zone (70). If it reaches this level, it could signal an imbalance in market forces, opening the door to short-term downward corrections.
MACD
The MACD histogram remains close to the neutral line (0), suggesting a lack of clear directional strength in the short-term moving averages.
Both indicators point to a potential phase of indecision in short-term movements, allowing for a possible period of consolidation within the current bullish bias, especially if no new major catalysts emerge to drive aggressive buying pressure in the coming sessions.
Key Levels to Watch:
$200 – Psychological Resistance: In the absence of historical references, this level stands out as the most relevant short-term price point. It could act as a technical barrier, triggering temporary pullbacks.
$184 – Near-Term Support: Corresponds to the recent retracement area. A drop below this level could neutralize bullish momentum and lead to a sideways consolidation phase.
$170 – Key Support: Associated with recent lows, located below the 100-period moving average. A sustained move under this level could shift the market structure and pave the way for a dominant bearish bias.
Written by Julian Pineda, CFA – Market Analyst

Nvidia - Starting a clear +20% rally!🧲Nvidia ( NASDAQ:NVDA ) rallies higher now:
🔎Analysis summary:
About one decade ago, Nvidia broke out of a major bullish triangle pattern. Following this remarkable breakout, Nvidia continued with a rally of about +35.000%. But looking at all these previous cycles, Nvidia remains bullish with another potential +20% move towards the upside.
📝Levels to watch:
$200, $250
SwingTraderPhil
SwingTrading.Simplified. | Investing.Simplified. | #LONGTERMVISION

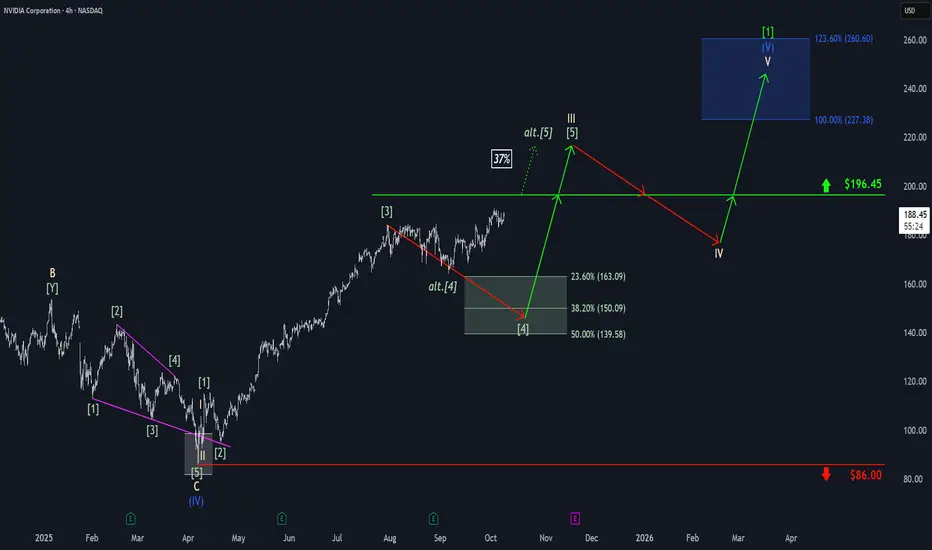
Nvidia: Bullish DistractionAmid bullish momentum, Nvidia edged closer to resistance at $196.45 before settling into sideways action late last week. As a result, there remains a 37% probability that the stock will bypass a new low and instead break directly above the $196.45 level. However, our primary expectation is for the stock to turn lower, targeting our green Target Zone between $163.09 and $139.58 to complete green wave . Only after this move do we anticipate a sustained advance above $196.45, which would mark the completion of beige wave III. Following a wave IV pullback below this threshold, we ultimately expect gains into the blue Target Zone between $227.38 and $260.60, where beige wave V should complete not only blue wave (V), but also the larger neon green wave .
NVIDIA – From Thesis to Profits: How Fundamentals & Technicals 📚💡 NVIDIA – From Thesis to Profits: How Fundamentals & Technicals Aligned 🚀🧠
This isn’t just a trade —it’s a lesson in how conviction, timing, and structure come together when you truly understand what you're investing in.
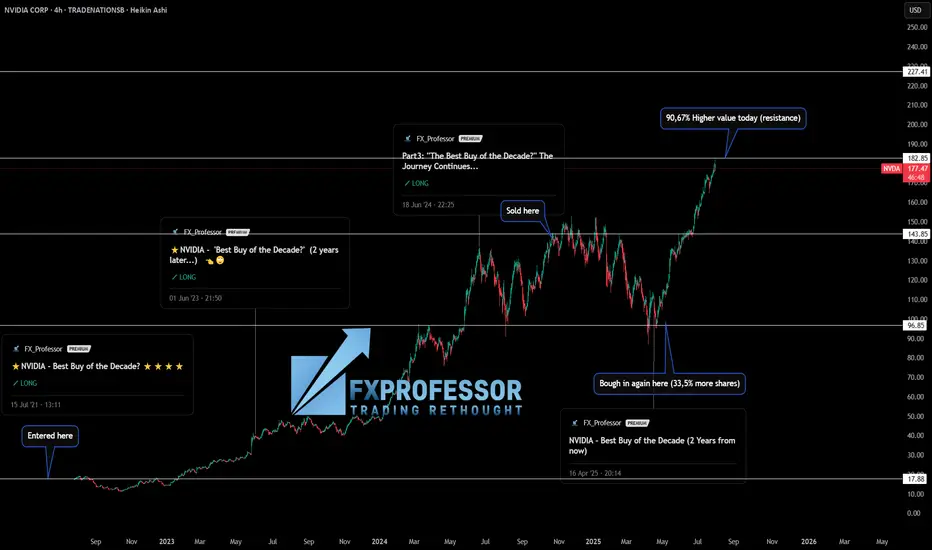
I’ve been publicly calling NASDAQ:NVDA the “Best Buy of the Decade” since July 2021 when the price was around $18. Why? Because I’m a gamer, I understand chips, and I knew exactly what NVIDIA was building long before AI became a buzzword. From graphics cards to data centers and AI compute, the fundamentals were solid.
But let me be clear: I’m not a holder forever. I use technical analysis to manage entries and exits. And that’s where the real edge comes in. 🎯
Here’s how the trade evolved:
✅ Initial entry: $17.88 (2021)
✅ First target hit: $143.85 → Took profits
✅ Re-entry: $96.85 → Got 33.5% more shares for the same money
✅ Today’s value (July 31st): Up +90.67% in just 100 days
📅 That’s from April 23rd to today.
(and it was ALL publicly posted here, for You!)
This is what happens when macro conviction meets micro execution.
🧠 The key takeaways:
Fundamentals gave me the why.
Technicals gave me the when.
And risk management gave me more shares for free.
That’s not luck —it’s structure, patience, and doing the work. If you’re just “HODLing” and hoping, consider learning how to work the chart instead of letting the chart work you.
Let me know in the comments—did you catch this move? Are you in, or waiting for the next entry?
One Love,
The FX PROFESSOR 💙
ps. in this case i did not sell many shares today i hedged with a short on SP500. Nvidia might correct a bit
Disclosure: I am happy to be part of the Trade Nation's Influencer program and receive a monthly fee for using their TradingView charts in my analysis. Awesome broker, where the trader really comes first! 🌟🤝📈
Nvidia and OpenAI Announce Partnership, NVDA Shares SurgeNvidia and OpenAI Announce Partnership, NVDA Shares Surge
Yesterday it was revealed that leading chipmaker Nvidia and leading artificial intelligence research laboratory OpenAI have announced a strategic partnership, under which Nvidia will invest $100 billion in OpenAI.
A network of data centres will also be created to train and operate the most advanced artificial intelligence models:
→ the network will be based on Nvidia’s next-generation platform, Vera Rubin;
→ the network’s total capacity is unprecedented, reaching 10 gigawatts;
→ the first phase of the project is expected to launch in the second half of 2026.
Nvidia (NVDA) shares reacted sharply to the news. During Monday’s trading, 22 September, the company’s stock price jumped by roughly 4%, climbing at yesterday’s high above $184.30 (marking a new all-time record, as shown on the chart). The chipmaker’s market capitalisation closed in on $4.5 trillion, cementing its status as the most valuable company in the world.
Technical Analysis of Nvidia (NVDA) Chart
Previously, in our 1 September analysis of NVDA, we:
→ plotted an ascending channel describing NVDA’s price movements following the bullish impulse at the end of June;
→ noted unsuccessful attempts by the bulls to break resistance at $183, which provided grounds to view the chart in the context of a Triple Top pattern (1-2-3);
→ assumed that the bears were exerting pressure on an overvalued stock and considered a correction scenario.
Since then, the Nvidia stock price corrected to $165, from where it resumed its upward trend (shown with a broken arrow).
The new data provide grounds to:
→ expand the channel (shown in blue) without changing its slope, adding the QH and QL lines to divide the wider channel into quarters;
→ plot the trajectory of the correction (in red).
Within this context, it is reasonable to assume that:
→ the stock price of NVDA found support at the QL line and moved up towards the midline;
→ the red lines form a Bullish Flag pattern;
→ yesterday’s rise broke out of this corrective pattern, with the bulls attempting to resume the upward trend, though the $183 level still provides resistance.
It is not excluded that the strong fundamental background, the development of AI technologies, and the supportive driver of the Fed’s rate cut may ultimately enable the bulls to overcome the $183 level, paving the way for NVDA’s share price to approach the psychological $200 mark.
This article represents the opinion of the Companies operating under the FXOpen brand only. It is not to be construed as an offer, solicitation, or recommendation with respect to products and services provided by the Companies operating under the FXOpen brand, nor is it to be considered financial advice.
Nvidia Returns to Yearly Highs on Temporary Boost in ConfidenceNvidia’s stock started the week with a gain of more than 4%, maintaining a steady bullish bias after it was announced that the company will invest over $100 billion in OpenAI to support the development of artificial intelligence infrastructure. As part of the agreement, Nvidia is expected to receive OpenAI shares as compensation. This move reflects both companies’ commitment to sustained growth in the AI industry and suggests that Nvidia views this project as a key step to strengthen its position beyond microchip production, seeking to consolidate itself as a strategic player in the sector over the long term. For now, market confidence has fueled buying pressure, and if further announcements are made, this trend could continue to dominate in the short term.
Short-Term Sideways Range at Risk
In recent weeks, Nvidia’s price had been moving within a sideways range, with a ceiling near $183 per share and a floor around $162. However, the latest bullish momentum is pushing the stock to test this resistance. If buying pressure holds, the range could break out and pave the way for a more relevant bullish bias in the coming sessions.
RSI
The RSI line remains above the neutral level of 50, showing that short-term bullish momentum has begun to dominate the average of the last 14 sessions. As long as this trend continues and the indicator does not enter overbought territory, buying pressure could become even more relevant in the short term.
MACD
The MACD histogram has started to show oscillations above the neutral 0 level, suggesting that the average strength of the moving averages has entered a steady bullish zone. If this signal persists, it could open the door to a stronger bullish bias in the short term.
Key Levels to Watch:
$183 – Yearly Resistance: Marks the yearly high and is the most important barrier in the short term. A sustained breakout above this level could drive the continuation of the broader bullish trend seen in recent weeks.
$173 – Nearby Barrier: Aligns with the zone marked by the Ichimoku cloud. Price action around this level could generate neutrality and extend the ongoing sideways formation.
$162 – Critical Support: Matches the 100-period moving average and the 23.6% Fibonacci retracement. A break below this support would activate a more relevant bearish bias, opening the door to a short-term downtrend.
Written by Julian Pineda, CFA – Market Analyst

Nvidia - The rally is still not over!🔌Nvidia ( NASDAQ:NVDA ) still heads much higher:
🔎Analysis summary:
For the past decade, Nvidia has perfectly been respecting a major bullish rising channel formation. Currently, Nvidia is still far away from the upper red resistance trendline, which indicates another potential move higher. Just understand that the trend is your closest friend.
📝Levels to watch:
$200
SwingTraderPhil
SwingTrading.Simplified. | Investing.Simplified. | #LONGTERMVISION

Nvidia (NVDA) Shows Bearish Signs After Earnings ReleaseNvidia (NVDA) Shows Bearish Signs After Earnings Release
On Wednesday, Nvidia published a fairly strong quarterly report:
→ Revenue for the second quarter came in at $46.74 billion (record), up 56% compared with the same period last year;
→ Adjusted earnings per share (EPS) were $1.05, a 54% year-on-year increase and above analysts’ expectations of $1.01–$1.02.
However, in the Data Centre segment (closely watched by the market), results fell slightly short of Wall Street forecasts, which may suggest a slowdown in capital flows into AI infrastructure. This factor could explain why Nvidia (NVDA) underperformed the index later in the week: for instance, the S&P 500 hit a record high on Thursday, while NVDA closed lower.
Technical analysis of Nvidia (NVDA) chart
Six days ago, we:
→ Drew an upward channel (shown in blue), capturing NVDA’s price swings after the bullish surge at the end of June;
→ Highlighted the importance of support at $170 and resistance at $183.
Indeed, $183 looks like a solid barrier:
→ The numbers (1, 2, 3) mark failed attempts by the bulls to break through this resistance, giving grounds to view the chart in the context of a triple top pattern.
→ The third peak only slightly exceeds the previous highs, which resembles a bull trap and the Upthrust After Distribution (UTAD) pattern in Richard Wyckoff’s methodology, signalling the prospect of lower prices. A bearish gap the following day (shown by the red arrow) and a weak Friday close underline the bears’ aggression.
Given the above, we could assume that the bulls may try to keep the price within the channel, relying on support at its lower boundary. Yet the mentioned signals suggest that the bears are intensifying pressure. If we see only a weak rebound from the lower boundary at the start of September, the current channel could be at risk. In the event of a bearish breakout, a move down to test the $170 support could happen.
This article represents the opinion of the Companies operating under the FXOpen brand only. It is not to be construed as an offer, solicitation, or recommendation with respect to products and services provided by the Companies operating under the FXOpen brand, nor is it to be considered financial advice.
