NZDCHF FREE SIGNAL|LONG|
✅NZDCHF strong bullish displacement from higher-timeframe demand signals smart-money accumulation. Price is reacting from discount zone and is expected to continue higher toward resting buy-side liquidity.
—————————
Entry: 0.4610
Stop Loss: 0.4595
Take Profit: 0.4631
Time Frame: 2H
—————————
LONG🚀
✅Like and subscribe to never miss a new idea!✅
NZDCHF

NZD/CHF BEARS WILL DOMINATE THE MARKET|SHORT
Hello, Friends!
The BB upper band is nearby so NZD-CHF is in the overbought territory. Thus, despite the uptrend on the 1W timeframe I think that we will see a bearish reaction from the resistance line above and a move down towards the target at around 0.463.
Disclosure: I am part of Trade Nation's Influencer program and receive a monthly fee for using their TradingView charts in my analysis.
✅LIKE AND COMMENT MY IDEAS✅

NZDCHF: Bullish Push to 0.473?OANDA:NZDCHF is eyeing a bullish breakout on the 4-hour chart , with price forming higher lows after rebounding from support, converging with a downward trendline touch that could ignite upside momentum if buyers break through amid recent consolidation. This setup suggests a reversal opportunity post-downtrend, targeting higher resistance levels with near 1:3 risk-reward .🔥
Entry between 0.4497–0.4543 for a long position. Target at 0.4730 . Set a stop loss at a daily close below 0.4470 , yielding a risk-reward ratio of near 1:3 . Monitor for confirmation via a bullish candle close above entry with rising volume, leveraging the pair's potential recovery near lows.🌟
Fundamentally , NZDCHF is trading around 0.453 in early January 2026, with limited high-impact events this week due to the New Year holiday period, but key releases next week could influence direction. For the New Zealand Dollar, the RBNZ will resume regular data releases starting January 5, with notable events including National Accounts (income, saving, assets, and liabilities) for September 2025 quarter on January 15 at 10:45 AM NZT, potentially impacting NZD if showing economic strength. For the Swiss Franc, the KOF Leading Indicator for December on January 27 at 8:00 AM CET (forecast 102.5) is a major forward-looking metric that could weaken CHF if below expectations, signaling slowdown. Overall, softer Swiss data could favor NZD upside in thin post-holiday markets. 💡
📝 Trade Setup
🎯 Entry (Long):
0.4497 – 0.4543
(Entry within this zone is valid with proper risk & capital management.)
🎯 Target:
• 0.4730
❌ Stop Loss:
• Daily close below 0.4470
⚖️ Risk-to-Reward:
• ~ 1:3
💡 Your view?
Does NZDCHF finally break the descending trendline and push toward 0.4730 — or will resistance cap the move and force another range? 👇

NZD-CHF Free Signal! Sell!
Hello,Traders!
NZDCHF taps a well-defined supply zone after an impulsive bullish leg. Clear signs of buy-side liquidity exhaustion and bearish displacement favor a downside rotation from premium.
--------------------
Entry: 0.4666
Stop Loss: 0.4676
Take Profit: 0.4651
Time Frame: 5H
--------------------
Sell!
Comment and subscribe to help us grow!
Check out other forecasts below too!
Disclosure: I am part of Trade Nation's Influencer program and receive a monthly fee for using their TradingView charts in my analysis.

NZD/CHF BEARS ARE GAINING STRENGTH|SHORT
Hello, Friends!
NZD-CHF uptrend evident from the last 1W green candle makes short trades more risky, but the current set-up targeting 0.460 area still presents a good opportunity for us to sell the pair because the resistance line is nearby and the BB upper band is close which indicates the overbought state of the NZD/CHF pair.
Disclosure: I am part of Trade Nation's Influencer program and receive a monthly fee for using their TradingView charts in my analysis.
✅LIKE AND COMMENT MY IDEAS✅

NZD-CHF Will Keep Growing! Buy!
Hello,Traders!
NZDCHF continues to respect bullish SMC structure after a clean reaction from the horizontal demand area. Price is holding above prior sell-side liquidity, showing strong absorption and follow-through buying.Time Frame 2H.
Buy!
Comment and subscribe to help us grow!
Check out other forecasts below too!
Disclosure: I am part of Trade Nation's Influencer program and receive a monthly fee for using their TradingView charts in my analysis.

NZD/CHF SHORT FROM RESISTANCE
Hello, Friends!
NZD/CHF is trending down which is clear from the red colour of the previous weekly candle. However, the price has locally surged into the overbought territory. Which can be told from its proximity to the BB upper band. Which presents a classical trend following opportunity for a short trade from the resistance line above towards the demand level of 0.457.
Disclosure: I am part of Trade Nation's Influencer program and receive a monthly fee for using their TradingView charts in my analysis.
✅LIKE AND COMMENT MY IDEAS✅

NZDCHF: Bearish Forecast & Outlook
The analysis of the NZDCHF chart clearly shows us that the pair is finally about to tank due to the rising pressure from the sellers.
Disclosure: I am part of Trade Nation's Influencer program and receive a monthly fee for using their TradingView charts in my analysis.
❤️ Please, support our work with like & comment! ❤️

NZDCHF Will Go Higher From Support! Long!
Here is our detailed technical review for NZDCHF.
Time Frame: 4h
Current Trend: Bullish
Sentiment: Oversold (based on 7-period RSI)
Forecast: Bullish
The market is testing a major horizontal structure 0.458.
Taking into consideration the structure & trend analysis, I believe that the market will reach 0.459 level soon.
P.S
Overbought describes a period of time where there has been a significant and consistent upward move in price over a period of time without much pullback.
Like and subscribe and comment my ideas if you enjoy them!

NZDCHF Losing Strength | Sellers Target Lower Levels🔻🧊 NZDCHF Losing Strength | Sellers Target Lower Levels 🎯
Overview:
NZDCHF is showing bearish continuation signs, with price reacting near a key supply area, opening the door for further downside movement.
Sell Zone (Focus Area):
🔴 0.4600 – 0.4595
This zone acts as a resistance area where selling pressure is expected to remain active.
Downside Targets:
🎯 Target 1: 0.4570 – Initial downside reaction
🎯 Target 2: 0.4560 – Continuation target
🎯 Target 3: 0.4550 – Deeper downside objective
Why This Setup Works:
✔ Price respecting a clear resistance zone
✔ Bearish structure remains intact
✔ Smooth downside path with defined targets
Trade Management Insight:
Scaling out at each target helps secure profits while maintaining exposure for further downside continuation.
Execution Guidance:
Allow price to confirm rejection or acceptance near the sell zone before entry. Precision improves outcomes.
Final Note:
As long as price remains below the resistance zone, the probability favors a move toward lower targets.
⸻
✨ Special Note for Serious Traders
If you value clean setups, precise targets, and disciplined execution over emotional trading, feel free to connect. I work with traders who focus on structure, patience, and long-term consistency.

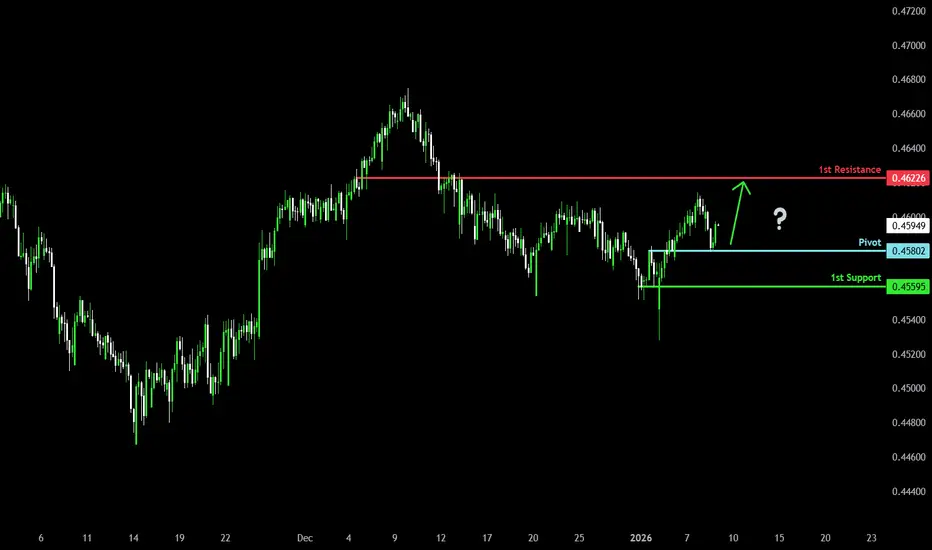
Bullish bounce off?NZD/CHF has bounced off the pivot and could rise to the 1st resistance.
Pivot: 0.45802
1st Support: 0.45595
1st Resistance: 0.46226
Disclaimer:
The opinions given above constitute general market commentary and do not constitute the opinion or advice of IC Markets or any form of personal or investment advice.
Any opinions, news, research, analyses, prices, other information, or links to third-party sites contained on this website are provided on an "as-is" basis, are intended to be informative only, and are not advice, a recommendation, research, a record of our trading prices, an offer of, or solicitation for, a transaction in any financial instrument and thus should not be treated as such. The information provided does not involve any specific investment objectives, financial situation, or needs of any specific person who may receive it. Please be aware that past performance is not a reliable indicator of future performance and/or results. Past performance or forward-looking scenarios based upon the reasonable beliefs of the third-party provider are not a guarantee of future performance. Actual results may differ materially from those anticipated in forward-looking or past performance statements. IC Markets makes no representation or warranty and assumes no liability as to the accuracy or completeness of the information provided, nor any loss arising from any investment based on a recommendation, forecast, or any information supplied by any third party
NZDCHF: Bullish Push to 0.467?FX:NZDCHF is eyeing a bullish breakout on the 4-hour chart , with price rebounding from support after a downward trendline break and breakout candle, converging with a potential entry zone that could fuel upside momentum if buyers hold amid recent volatility. This setup suggests a continuation opportunity in the uptrend, targeting higher resistance levels with risk-reward exceeding 1:2.🔥
Entry between 0.4516–0.4544 for a long position. Target at 0.4670 . Set a stop loss at a daily close below 0.4585 , yielding a risk-reward ratio of more than 1:2 . Monitor for confirmation via a bullish candle close above entry with rising volume, leveraging the pair's momentum post-breakout.🌟
Fundamentally , NZDCHF is trading around 0.458 in late December 2025, with limited high-impact events for NZD this week, shifting focus to CHF catalysts that could influence the pair. For the Swiss Franc, key releases include Current Account Q3 on December 19 at 08:00 AM (forecast CHF 14.5B), where a weaker surplus might pressure CHF; Economic Sentiment Index DEC on December 23 at 09:00 AM (forecast 10), potentially weakening CHF if sentiment dips; and KOF Leading Indicators DEC on December 30 at 08:00 AM (forecast 102.5), with softer readings signaling economic slowdown and CHF vulnerability. No major NZD events until January, leaving the pair sensitive to CHF data and broader USD sentiment. 💡
📝 Trade Setup
🎯 Entry (Long):
0.4516 – 0.4544
🎯 Target:
• 0.4670
❌ Stop Loss:
• Daily close below 0.4585
⚖️ Risk-to-Reward:
• > 1:2
💡 Your view?
Will NZDCHF defend this breakout zone and push toward 0.4670 — or does momentum fade into consolidation? 👇

Bullish rise?NZD/CHF has reacted off the pivot and could rise to the 1st resistance, which is a pullback resistance.
Pivot: 0.45802
1st Support: 0.4542
1st Resistance: 0.46226
Disclaimer:
The opinions given above constitute general market commentary and do not constitute the opinion or advice of IC Markets or any form of personal or investment advice.
Any opinions, news, research, analyses, prices, other information, or links to third-party sites contained on this website are provided on an "as-is" basis, are intended to be informative only, and are not advice, a recommendation, research, a record of our trading prices, an offer of, or solicitation for, a transaction in any financial instrument and thus should not be treated as such. The information provided does not involve any specific investment objectives, financial situation, or needs of any specific person who may receive it. Please be aware that past performance is not a reliable indicator of future performance and/or results. Past performance or forward-looking scenarios based upon the reasonable beliefs of the third-party provider are not a guarantee of future performance. Actual results may differ materially from those anticipated in forward-looking or past performance statements. IC Markets makes no representation or warranty and assumes no liability as to the accuracy or completeness of the information provided, nor any loss arising from any investment based on a recommendation, forecast, or any information supplied by any third party

NZDCHF Will Go Lower! Sell!
Take a look at our analysis for NZDCHF.
Time Frame: 4h
Current Trend: Bearish
Sentiment: Overbought (based on 7-period RSI)
Forecast: Bearish
The market is on a crucial zone of supply 0.459.
The above-mentioned technicals clearly indicate the dominance of sellers on the market. I recommend shorting the instrument, aiming at 0.457 level.
P.S
Please, note that an oversold/overbought condition can last for a long time, and therefore being oversold/overbought doesn't mean a price rally will come soon, or at all.
Like and subscribe and comment my ideas if you enjoy them!

Bearish reversal?NZD/CHF has rejected off the pivot and could drop to the 1st support, which is a pullback support that aligns with the 61.8% Fibonacci projection.
Pivot: 0.45973
1st Support: 0.45384
1st Resistance: 0.46222
Disclaimer:
The opinions given above constitute general market commentary and do not constitute the opinion or advice of IC Markets or any form of personal or investment advice.
Any opinions, news, research, analyses, prices, other information, or links to third-party sites contained on this website are provided on an "as-is" basis, are intended to be informative only, and are not advice, a recommendation, research, a record of our trading prices, an offer of, or solicitation for, a transaction in any financial instrument and thus should not be treated as such. The information provided does not involve any specific investment objectives, financial situation, or needs of any specific person who may receive it. Please be aware that past performance is not a reliable indicator of future performance and/or results. Past performance or forward-looking scenarios based upon the reasonable beliefs of the third-party provider are not a guarantee of future performance. Actual results may differ materially from those anticipated in forward-looking or past performance statements. IC Markets makes no representation or warranty and assumes no liability as to the accuracy or completeness of the information provided, nor any loss arising from any investment based on a recommendation, forecast, or any information supplied by any third party

NZD/CHF BEARS ARE STRONG HERE|SHORT
Hello, Friends!
NZD/CHF is making a bullish rebound on the 1H TF and is nearing the resistance line above while we are generally bearish biased on the pair due to our previous 1W candle analysis, thus making a trend-following short a good option for us with the target being the 0.459 level.
Disclosure: I am part of Trade Nation's Influencer program and receive a monthly fee for using their TradingView charts in my analysis.
✅LIKE AND COMMENT MY IDEAS✅

NZDCHF Under Pressure! SELL!
My dear friends,
Please, find my technical outlook for NZDCHF below:
The price is coiling around a solid key level - 0.4593
Bias - Bearish
Technical Indicators: Pivot Points Low anticipates a potential price reversal.
Super trend shows a clear sell, giving a perfect indicators' convergence.
Goal - 0.4584
Safe Stop Loss - 0.4598
About Used Indicators:
The pivot point itself is simply the average of the high, low and closing prices from the previous trading day.
Disclosure: I am part of Trade Nation's Influencer program and receive a monthly fee for using their TradingView charts in my analysis.
———————————
WISH YOU ALL LUCK

NZD/CHF BULLISH BIAS RIGHT NOW| LONG
Hello, Friends!
NZD/CHF is trending up which is evident from the green colour of the previous weekly candle. However, the price has locally plunged into the oversold territory. Which can be told from its proximity to the BB lower band. Which presents a beautiful trend following opportunity for a long trade from the support line below towards the supply level of 0.466.
Disclosure: I am part of Trade Nation's Influencer program and receive a monthly fee for using their TradingView charts in my analysis.
✅LIKE AND COMMENT MY IDEAS✅

Bullish bounce off pullback support?NZD/CHF is falling towards the pivot, which is a pullback support and could bounce to the 1st resistance.
Pivot: 0.45562
1st Support: 0.45192
1asr Resistance: 0.46117
Disclaimer:
The opinions given above constitute general market commentary and do not constitute the opinion or advice of IC Markets or any form of personal or investment advice.
Any opinions, news, research, analyses, prices, other information, or links to third-party sites contained on this website are provided on an "as-is" basis, are intended to be informative only, and are not advice, a recommendation, research, a record of our trading prices, an offer of, or solicitation for, a transaction in any financial instrument and thus should not be treated as such. The information provided does not involve any specific investment objectives, financial situation, or needs of any specific person who may receive it. Please be aware that past performance is not a reliable indicator of future performance and/or results. Past performance or forward-looking scenarios based upon the reasonable beliefs of the third-party provider are not a guarantee of future performance. Actual results may differ materially from those anticipated in forward-looking or past performance statements. IC Markets makes no representation or warranty and assumes no liability as to the accuracy or completeness of the information provided, nor any loss arising from any investment based on a recommendation, forecast, or any information supplied by any third party

Bearish drop?NZD/CHF has rejected off the resistance level, which is a pullback resistance and could drop from this level to our take profit.
Entry: 0.46105
Why we like it:
There is a pullback resistance level.
Stop loss: 0.46333
Why we like it:
There is a pullback resistance level.
Take profit: 0.45529
Why we like it:
There is a pullback support that is slightly above the 61.8% Fibonacci retracement.
Enjoying your TradingView experience? Review us!
Please be advised that the information presented on TradingView is provided to Vantage (‘Vantage Global Limited’, ‘we’) by a third-party provider (‘Everest Fortune Group’). Please be reminded that you are solely responsible for the trading decisions on your account. There is a very high degree of risk involved in trading. Any information and/or content is intended entirely for research, educational and informational purposes only and does not constitute investment or consultation advice or investment strategy. The information is not tailored to the investment needs of any specific person and therefore does not involve a consideration of any of the investment objectives, financial situation or needs of any viewer that may receive it. Kindly also note that past performance is not a reliable indicator of future results. Actual results may differ materially from those anticipated in forward-looking or past performance statements. We assume no liability as to the accuracy or completeness of any of the information and/or content provided herein and the Company cannot be held responsible for any omission, mistake nor for any loss or damage including without limitation to any loss of profit which may arise from reliance on any information supplied by Everest Fortune Group.

NZDCHF is in the Bearish DirectionHello Traders
In This Chart NZDCHF HOURLY Forex Forecast By FOREX PLANET
today NZDCHF analysis 👆
🟢This Chart includes_ (NZDCHF market update)
🟢What is The Next Opportunity on NZDCHF Market
🟢how to Enter to the Valid Entry With Assurance Profit
This CHART is For Trader's that Want to Improve Their Technical Analysis Skills and Their Trading By Understanding How To Analyze The Market Using Multiple Timeframes and Understanding The Bigger Picture on the Chart

Bullish bounce off pullback support?NZD/CHF has bounced off the pivot, which has been identified as an overlap support, and could rise to the 1st resistance.
Pivot: 0.4587
1st Support: 0.45584
1st Resistance: 0.46322
Disclaimer:
The opinions given above constitute general market commentary and do not constitute the opinion or advice of IC Markets or any form of personal or investment advice.
Any opinions, news, research, analyses, prices, other information, or links to third-party sites contained on this website are provided on an "as-is" basis, are intended to be informative only, and are not advice, a recommendation, research, a record of our trading prices, an offer of, or solicitation for, a transaction in any financial instrument and thus should not be treated as such. The information provided does not involve any specific investment objectives, financial situation, or needs of any specific person who may receive it. Please be aware that past performance is not a reliable indicator of future performance and/or results. Past performance or forward-looking scenarios based upon the reasonable beliefs of the third-party provider are not a guarantee of future performance. Actual results may differ materially from those anticipated in forward-looking or past performance statements. IC Markets makes no representation or warranty and assumes no liability as to the accuracy or completeness of the information provided, nor any loss arising from any investment based on a recommendation, forecast, or any information supplied by any third party

NZD/CHF Price Action Supports Upside Continuation Scenario🔥 NZD/CHF Bullish Breakout After Kijun Retest — Upside in Play? 🔥
📊 Asset
NZD/CHF – “KIWI DOLLAR vs SWISSY”
Forex Market Trade Opportunity Guide (Swing / Day Trade)
🧭 Market Bias
🟢 Bullish Structure Confirmed
Price has successfully broken above the KIJUN Moving Average and completed a clean breakout + retest, signaling a shift in momentum from sellers to buyers. This type of Kijun behavior often acts as a trend continuation trigger when aligned with broader risk sentiment.
🎯 Trade Plan
📈 Bullish Plan – Active
✅ Confirmation: Kijun MA Breakout & Retest
🔓 Entry: You can enter at ANY price level
(Position sizing and timing should match your own execution model)
🛑 Stop Loss
🚫 Thief SL: 0.45600
Dear Ladies & Gentlemen (Thief OG’s),
Adjust your stop-loss based on your own risk management, volatility tolerance, and account size. This SL is not mandatory—it’s a reference level only.
⚠️ Note: I do not recommend blindly following my SL. You make money, you manage risk — your responsibility, your choice.
🎯 Target Zone
🎯 Primary Target: 0.46700
🚧 Police Barricade Resistance Zone
📊 Overbought conditions building
Potential liquidity trap near highs
Kindly escape with profits as price approaches this zone. Momentum may stall or reverse once supply steps in.
⚠️ Note: I do not recommend blindly following my TP. Scale out or exit based on your own system.
👀 Related Pairs to Watch (Correlation & Confirmation)
💱 NZD-Related (Risk Currency)
$NZD/USD 💵
🔹 Strong positive correlation with NZD/CHF
🔹 Kiwi strength vs USD supports upside continuation in NZD crosses
$AUD/NZD 💵
🔹 Acts as a regional sentiment gauge
🔹 AUD weakness vs NZD adds confidence to NZD bullish flows
💱 CHF-Related (Safe Haven)
OANDA:USDCHF 💵
🔹 CHF weakness vs USD often aligns with CHF weakness across the board
🔹 Rising USD/CHF = supportive for NZD/CHF upside
OANDA:EURCHF 💵
🔹 CHF selling pressure here confirms broader Swiss franc softness
🔹 Sustained EUR/CHF bids favor NZD/CHF bullish continuation
📌 Key Correlation Insight
📈 Risk-ON environment = NZD strength
📉 Risk-OFF environment = CHF strength
If equities and risk assets remain supported, NZD/CHF bullish structure stays valid.
🧠 Final Thought
This setup favors trend continuation traders following Ichimoku Kijun dynamics. Manage risk smartly, respect resistance zones, and don’t marry the trade.
💬 If this breakdown helps you, drop a LIKE ❤️, COMMENT 🗨️, and FOLLOW 🔔 for more clean market structures.
Trade safe. Trade disciplined. 💼📊
