Time To Steal Pips? NZD/CHF Bullish Layer StrategyNZD/CHF "Kiwi vs Swiss" Bank Heist Plan 🏦💰 - Bullish Swing Play (Layer Entry Strategy)
🎯 The Heist Plan (Trade Setup)
Asset: OANDA:NZDCHF (Kiwi vs Swiss Franc)
Bias: Bullish 🐂
Strategy: "The Thief's Layer" 🎭 - Using multiple limit orders to scale into the position and optimize entry.
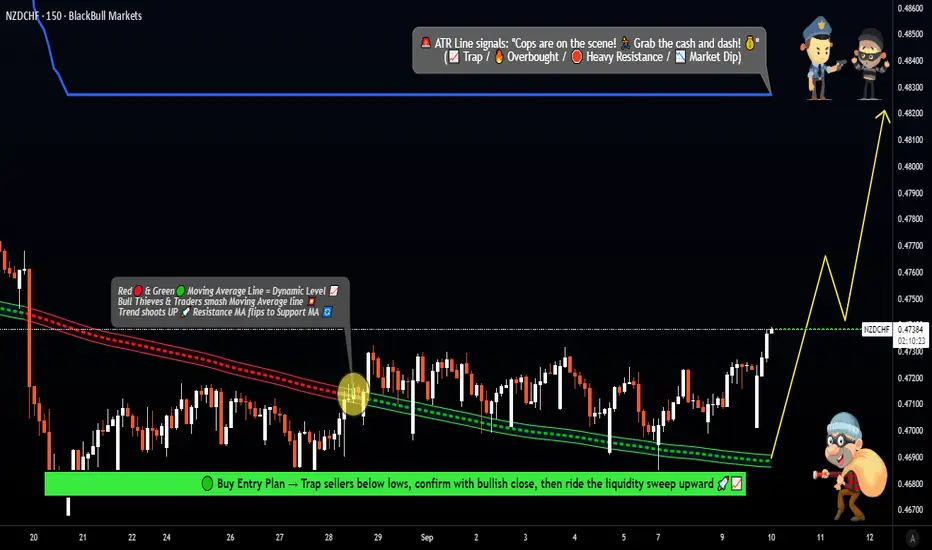
🛠️ Entry (The Layered Approach):
"A thief doesn't knock on the front door! 🚪 Use layered limit orders for a better average entry."
Consider layering buy limits at: 0.47400 📈, 0.47300 📈, 0.47200 📈, 0.47100 📈.
You can adjust the number of layers and levels based on your own capital and risk appetite!
🚨 Stop Loss (Your Escape Route):
Thief's Suggested SL: 0.46800 ❌
⚠️ Important Note: Dear Thief OGs (Ladies & Gents), this is MY plan. You MUST adjust your SL based on your own risk management and strategy. Protect your capital! 🛡️
🎯 Take Profit (Escape With The Loot):
Target: 0.48200 ✅
Why Here? This area acts as a key police barricade 🚧 (resistance), confluence with ATR, overbought signals, and potential bull traps. Secure your stolen profits before then! 💰💨
⚠️ Important Note: Take money at your own risk! You are free to take partial profits earlier or trail your stop. This is a suggested target, not financial advice.
🔍 Why This Heist? The Fundamental Blueprint
This isn't a random trade; it's a planned operation based on current data.
📊 Real-Time Data (As of Sep 10, 2025)
Current Rate: 0.4972 (+0.32% today) 💹
🧠 Trader Sentiment
Retail: 🟢 58% Long | 🔴 42% Short (Bullish Bias)
Institutional: 🟢 52% Long | 🔴 48% Short (Neutral-Leaning Bullish)
Overall Mood: Moderately Optimistic 😊
📈 Fear & Greed Index
Level: 55/100 (Greed Zone) - Indicates market optimism is present, supporting risk-on plays like NZD.
📋 Fundamental Score: 62/100 ✅
🟢 NZD Strength: Strong Asian export demand supports the Kiwi.
🔴 CHF Strength: Its safe-haven status due to global uncertainties provides a floor.
⚪ Neutral: Both RBNZ and SNB are on hold with rates; no major shocks expected.
🌍 Macro Score: 58/100 ✅
🟢 Pro-NZD: Global risk-on mood benefits commodity currencies (NZD).
🔴 Pro-CHF: Any US rate cut speculation can briefly strengthen the Swissy.
⚪ Neutral: Stable economic data from both nations.
🐂 Overall Outlook: Neutral to Slightly Bullish
A favourable mix for a potential NZD grind higher, though CHF's safe-haven status will likely prevent a moonshot. This setup aims to steal a chunk of that predicted move.
👮♂️ Risk Management (The Most Important Part)
This is a SWING/DAY TRADE idea, not investment advice.
MANAGE YOUR RISK. Use proper position sizing. Only risk what you can afford to lose.
The "Layer" strategy helps your average entry but requires disciplined capital allocation.
Related Pairs to Watch: OANDA:AUDCHF , OANDA:NZDUSD , OANDA:USDCHF , OANDA:AUDNZD
✨ “If you find value in my analysis, a 👍 and 🚀 boost is much appreciated — it helps me share more setups with the community!”
#NZDCHF #Forex #Trading #SwingTrading #DayTrading #Kiwi #ForexAnalysis #FX #TechnicalAnalysis #ThiefStrategy
NZDCHF
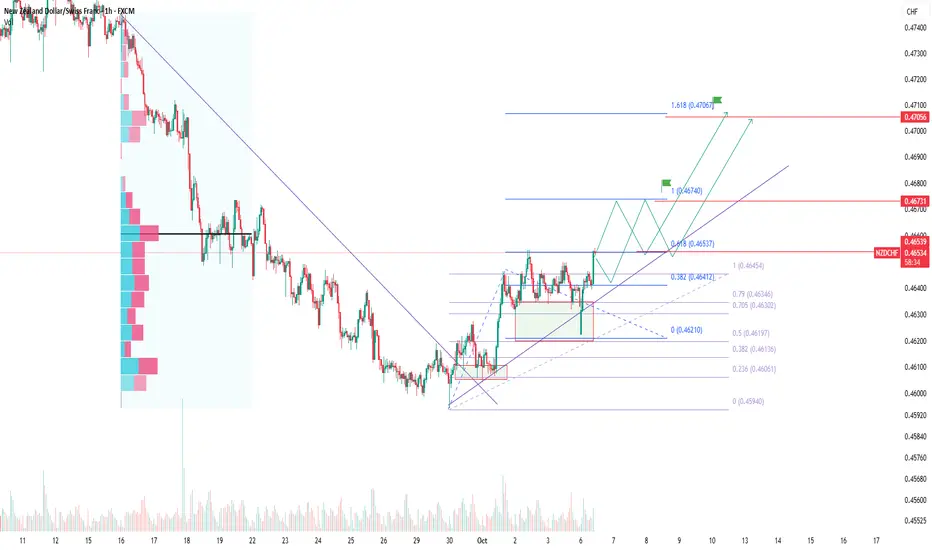
NZDCHF: rebound after downtrend with Fibonacci targetsNZDCHF has found support after a prolonged decline and broke through the local descending trendline. The price is now holding above the 0.4650–0.4660 area, aligning with key Fibonacci retracement levels, which strengthens the bullish outlook.
Technically, if the pair stays above 0.4650, a retest could follow before the next push toward 0.4674 and 0.4706, which aligns with the 1.618 Fibonacci extension. Some consolidation around 0.4660–0.4670 is possible before continuation higher.
From a fundamental view, the New Zealand dollar benefits from commodity price resilience and Asian market optimism, while the Swiss franc remains a safe haven. As global risk appetite improves, investors tend to rotate into higher-yielding currencies, supporting NZD.
This is a classic reversal setup: a base after oversold conditions, with confirmation needed before further entries. As always, wait for signals and avoid emotional trading.
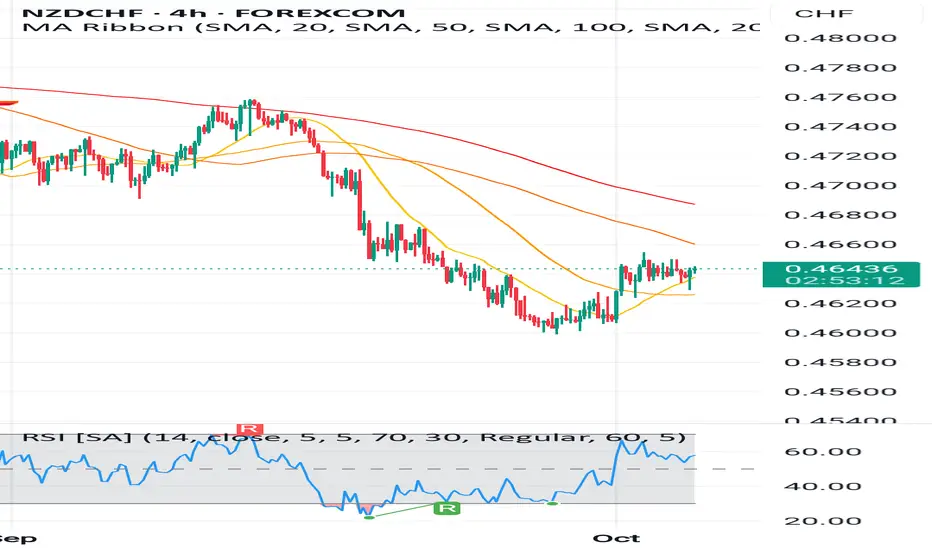
Technical analysis for NZD/CHF (4H chart)Market recently bounced from below 0.4600, showing short-term recovery.
However, price is still trading below the 50, 100, and 200 SMAs, meaning the overall trend remains bearish.
🔹 Moving Averages (SMA Ribbon)
Price is testing the 20 SMA (yellow line).
The 50 SMA (orange) and 100 SMA (brown) above are acting as strong resistance.
The 200 SMA (red) is far above – unless price breaks 0.4700–0.4720, the downtrend is intact.
🔹 RSI (Relative Strength Index)
RSI is around 60.
Indicates some short-term bullish momentum.
If RSI pushes above 70, it enters overbought zone.
A bullish divergence had formed earlier, which explains the recent bounce.
🔹 Key Levels
Resistance: 0.4660 – 0.4680 (50 & 100 SMA zone), then 0.4720 – 0.4740
Support: 0.4620 – 0.4600 (recent swing low), then 0.4560
🔹 Possible Scenarios
1. Bullish Case (Short-term bounce)
If price sustains above 0.4660, next upside targets are 0.4680–0.4720.
2. Bearish Case (Trend continuation)
If price closes below 0.4620, decline towards 0.4600 and 0.4560 is likely.
📌 Summary:
Short-term: Some bullish recovery.
Medium-term: Still in a bearish trend unless it breaks above 0.4720.
Best approach: Intraday traders can look for selling opportunities near 0.4660–0.4680. If a breakout above 0.4720 happens, then buyers may step in.
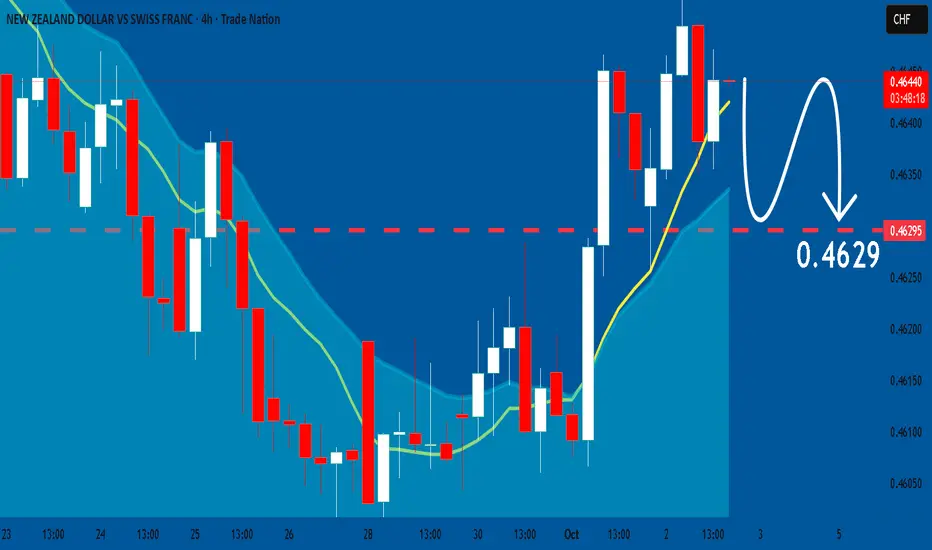
NZDCHF: Will Start Falling! Here is Why:
Balance of buyers and sellers on the NZDCHF pair, that is best felt when all the timeframes are analyzed properly is shifting in favor of the sellers, therefore is it only natural that we go short on the pair.
Disclosure: I am part of Trade Nation's Influencer program and receive a monthly fee for using their TradingView charts in my analysis.
❤️ Please, support our work with like & comment! ❤️
Bullish rise?NZD/CHF has bounced off the pivot and oculd rise to the 50% Fibonacci resistance.
Pivot: 0.46183
1st Support: 0.45888
1st Resistance: 0.46786
Disclaimer:
The above opinions given constitute general market commentary, and do not constitute the opinion or advice of IC Markets or any form of personal or investment advice.
Any opinions, news, research, analyses, prices, other information, or links to third-party sites contained on this website are provided on an "as-is" basis, are intended only to be informative, is not an advice nor a recommendation, nor research, or a record of our trading prices, or an offer of, or solicitation for a transaction in any financial instrument and thus should not be treated as such. The information provided does not involve any specific investment objectives, financial situation and needs of any specific person who may receive it. Please be aware, that past performance is not a reliable indicator of future performance and/or results. Past Performance or Forward-looking scenarios based upon the reasonable beliefs of the third-party provider are not a guarantee of future performance. Actual results may differ materially from those anticipated in forward-looking or past performance statements. IC Markets makes no representation or warranty and assumes no liability as to the accuracy or completeness of the information provided, nor any loss arising from any investment based on a recommendation, forecast or any information supplied by any third-party.

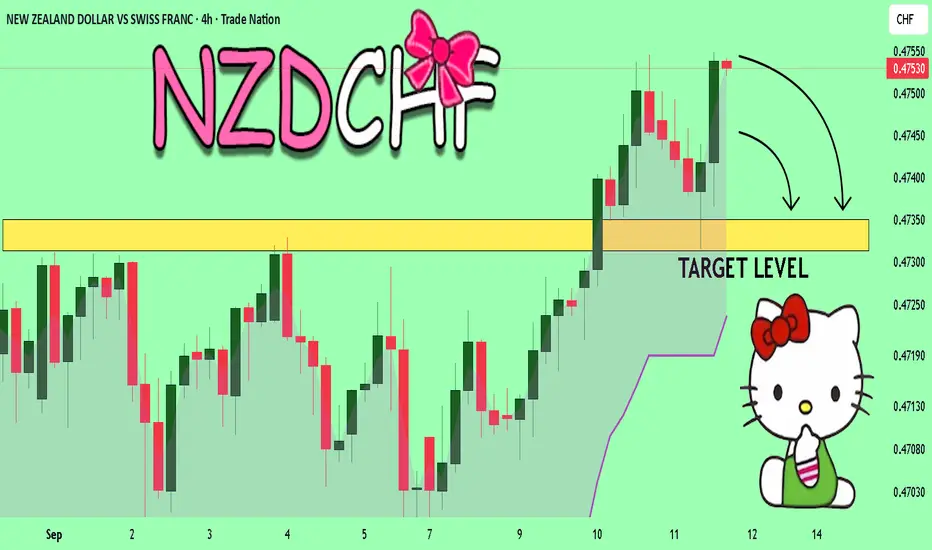
NZD/CHF BULLS WILL DOMINATE THE MARKET|LONG
Hello, Friends!
The BB lower band is nearby so NZD-CHF is in the oversold territory. Thus, despite the downtrend on the 1W timeframe I think that we will see a bullish reaction from the support line below and a move up towards the target at around 0.467.
Disclosure: I am part of Trade Nation's Influencer program and receive a monthly fee for using their TradingView charts in my analysis.
✅LIKE AND COMMENT MY IDEAS✅

NZDCHF is in the Bearish SidedHello Traders
In This Chart NZDCHF HOURLY Forex Forecast By FOREX PLANET
today NZDCHF analysis 👆
🟢This Chart includes_ (NZDCHF market update)
🟢What is The Next Opportunity on NZDCHF Market
🟢how to Enter to the Valid Entry With Assurance Profit
This CHART is For Trader's that Want to Improve Their Technical Analysis Skills and Their Trading By Understanding How To Analyze The Market Using Multiple Timeframes and Understanding The Bigger Picture on the Chart

NZD_CHF SWING BEARISH BREAKOUT|SHORT|
✅NZD_CHF broke the key
Structure level of 0.4640
While trading in an local
Downtrend, which makes me
Bearish biased, and and I think
That after the retest of the
Broken level is complete,
A bearish continuation will follow
SHORT🔥
✅Like and subscribe to never miss a new idea!✅

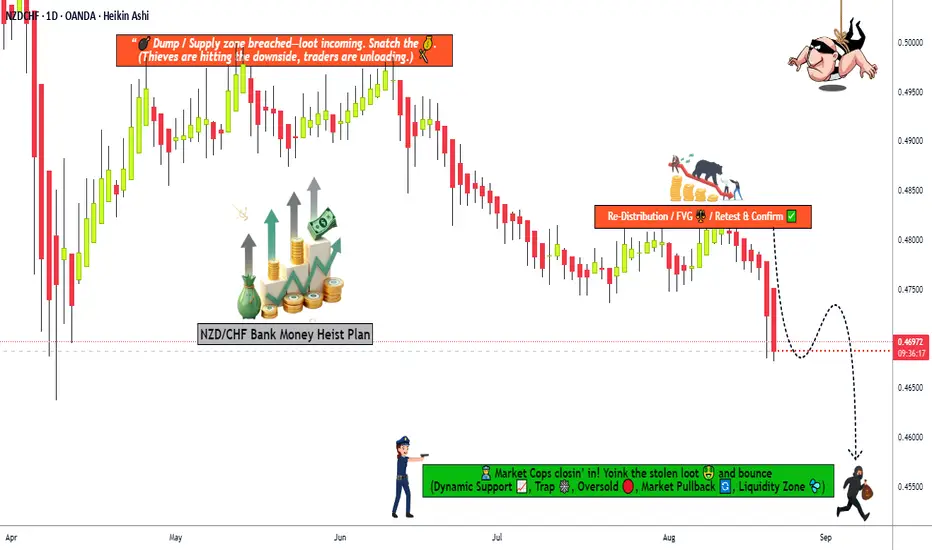
Loot the Forex Vault: NZD/CHF Bearish Layer Entry Plan🔥 NZD/CHF "Kiwi vs Swissy" Forex Bank Heist Plan (Swing/Scalping Trade) 🤑💰
🌟 Dear Thief Traders & Money Bandits 🌟Get ready to pull off the ultimate heist on the NZD/CHF market! 📉 Our Thief Trading Style is locked and loaded with a bearish plan to swipe profits. Follow the strategy below, execute with precision, and escape before the market cops catch up! 🚨💸
📝 Heist Plan Overview
Asset: NZD/CHF (Kiwi vs Swissy) 🥝🇨🇭
Direction: Bearish 📉
Style: Swing/Scalping Trade 🕒
Strategy: Thief Layering (Multiple Limit Orders) 🎯
🚪 Entry: Crack the Vault Wide Open!
Entry Levels: Place sell limit orders at these key levels to layer your entries like a pro thief:
📍 0.47400
📍 0.47200
📍 0.47100
Flexibility: Add more layers based on your risk appetite and market conditions. Stack those orders to maximize your loot! 💰
Thief Tip: Enter at any price level if you spot a swing high or pullback on a 15M/30M timeframe. The vault is open—strike fast! ⚡
🛑 Stop Loss: Secure Your Getaway Car
Thief SL: Set at 0.48000 on the 4H timeframe for swing/scalping trades. 🚗
Risk Management: Adjust SL based on your strategy, lot size, and number of layered orders. Stay sharp, OG Thieves! 🕵️♂️
🎯 Target: Grab the Loot & Escape!
Police Barricade: Market resistance at 0.45500—watch out for the cops! 🚔
Thief Target: Take profits at 0.45700 to slip away with the cash before the barricade closes in. 💵
📰 Market Intel: Know Before You Steal
Fundamental Analysis: Check COT reports, macroeconomic data, and sentiment outlook for NZD/CHF. 📊
Intermarket Analysis: Monitor correlated pairs and global market trends. 🗺️
News Alert: Avoid trading during high-impact news releases to dodge volatility traps. Use trailing stops to lock in profits on open positions. 🚫
💡 Thief Trading Tips
Layering Strategy: Use multiple sell limit orders to average into the trade (DCA style). Spread your entries to reduce risk and increase reward. 📈
Stay Updated: Market conditions shift fast. Keep an eye on real-time data and adjust your plan. 🕵️
Boost the Heist: Smash the Boost Button to power up our robbery squad and make stealing profits easier! 💪🚀
🏆 Why Thief Trading Style?
Precise, calculated entries with layered orders. 🎯
Risk-managed SL to protect your stash. 🛡️
Clear profit targets to escape with max loot. 💰
Backed by technical and fundamental analysis for a clean getaway. 📉
💥 Join the Heist! 💥 Hit the Boost Button, share the plan, and let’s rob the NZD/CHF market together! Stay tuned for the next heist, Money Bandits! 🤑🐱👤🎉
NZD/CHF BEARISH BIAS RIGHT NOW| SHORT
NZD/CHF SIGNAL
Trade Direction: short
Entry Level: 0.466
Target Level: 0.464
Stop Loss: 0.468
RISK PROFILE
Risk level: medium
Suggested risk: 1%
Timeframe: 1h
Disclosure: I am part of Trade Nation's Influencer program and receive a monthly fee for using their TradingView charts in my analysis.
✅LIKE AND COMMENT MY IDEAS✅

NZD_CHF REBOUND AHEAD|LONG|
✅NZD_CHF is falling in a
Strong downtrend and the pair
Seems to be locally oversold
So as the pair is approaching
A strong horizontal support
Of 0.4640 price growth
Is to be expected
LONG🚀
✅Like and subscribe to never miss a new idea!✅

Bullish bounce off?NZD/CHF is reacting off the support level, which his a pullback support that aligns with the 38.2% Fibonacci retracement and could bounce from this level to our take profit.
Entry: 0.47298
Why we like it:
There is a pullback support that aligns with the 38.2% Fibonacci retracement.
Stop loss: 0.46902
Why we like it:
There is a pullback support level.
Take profit: 0.47941
Why we like it:
There is a pullback resistance that aligns with the 78.6% Fibonacci retracement.
Enjoying your TradingView experience? Review us!
Please be advised that the information presented on TradingView is provided to Vantage (‘Vantage Global Limited’, ‘we’) by a third-party provider (‘Everest Fortune Group’). Please be reminded that you are solely responsible for the trading decisions on your account. There is a very high degree of risk involved in trading. Any information and/or content is intended entirely for research, educational and informational purposes only and does not constitute investment or consultation advice or investment strategy. The information is not tailored to the investment needs of any specific person and therefore does not involve a consideration of any of the investment objectives, financial situation or needs of any viewer that may receive it. Kindly also note that past performance is not a reliable indicator of future results. Actual results may differ materially from those anticipated in forward-looking or past performance statements. We assume no liability as to the accuracy or completeness of any of the information and/or content provided herein and the Company cannot be held responsible for any omission, mistake nor for any loss or damage including without limitation to any loss of profit which may arise from reliance on any information supplied by Everest Fortune Group.

NZDCHF Technical Analysis! SELL!
My dear friends,
Please, find my technical outlook for NZDCHF below:
The price is coiling around a solid key level - 0.4352
Bias - Bearish
Technical Indicators: Pivot Points High anticipates a potential price reversal.
Super trend shows a clear sell, giving a perfect indicators' convergence.
Goal - 0.4735
About Used Indicators:
The pivot point itself is simply the average of the high, low and closing prices from the previous trading day.
Disclosure: I am part of Trade Nation's Influencer program and receive a monthly fee for using their TradingView charts in my analysis.
———————————
WISH YOU ALL LUCK
NZDCHF SENDS CLEAR BEARISH SIGNALS|SHORT
Hello, Friends!
It makes sense for us to go short on NZD/CHF right now from the resistance line above with the target of 0.471 because of the confluence of the two strong factors which are the general downtrend on the previous 1W candle and the overbought situation on the lower TF determined by it’s proximity to the upper BB band.
Disclosure: I am part of Trade Nation's Influencer program and receive a monthly fee for using their TradingView charts in my analysis.
✅LIKE AND COMMENT MY IDEAS✅

Breakout signals bullish rise?NZD/CHF has broken out of the resistance level, which is a pullback resistance, and could potentially rise from this level to our take profit.
Entry: 0.4729
Why we like it:
There is a pullback resistance level.
Stop loss: 0.4690
Why we like it:
There is a pullback support level.
Take profit: 0.4794
Why we like it:
There is an overlap resistance that aligns with the 78.6% Fibonacci retracement.
Enjoying your TradingView experience? Review us!
Please be advised that the information presented on TradingView is provided to Vantage (‘Vantage Global Limited’, ‘we’) by a third-party provider (‘Everest Fortune Group’). Please be reminded that you are solely responsible for the trading decisions on your account. There is a very high degree of risk involved in trading. Any information and/or content is intended entirely for research, educational and informational purposes only and does not constitute investment or consultation advice or investment strategy. The information is not tailored to the investment needs of any specific person and therefore does not involve a consideration of any of the investment objectives, financial situation or needs of any viewer that may receive it. Kindly also note that past performance is not a reliable indicator of future results. Actual results may differ materially from those anticipated in forward-looking or past performance statements. We assume no liability as to the accuracy or completeness of any of the information and/or content provided herein and the Company cannot be held responsible for any omission, mistake nor for any loss or damage including without limitation to any loss of profit which may arise from reliance on any information supplied by Everest Fortune Group.

NZD/CHF SHORT FROM RESISTANCE
Hello, Friends!
NZD/CHF pair is trading in a local uptrend which we know by looking at the previous 1W candle which is green. On the 12H timeframe the pair is going up too. The pair is overbought because the price is close to the upper band of the BB indicator. So we are looking to sell the pair with the upper BB line acting as resistance. The next target is 0.473 area.
Disclosure: I am part of Trade Nation's Influencer program and receive a monthly fee for using their TradingView charts in my analysis.
✅LIKE AND COMMENT MY IDEAS✅

NZD-CAD Will Keep Falling! Sell!
Hello,Traders!
NZD-CAD has formed a
Bearish flag pattern
And the pair is trying
To breakout of the flag
So IF we the breakout
Is confirmed on Monday
We will be expecting
A further bearish move down
Sell!
Comment and subscribe to help us grow!
Check out other forecasts below too!
Disclosure: I am part of Trade Nation's Influencer program and receive a monthly fee for using their TradingView charts in my analysis.

NZD_CHF BEARISH FLAG|SHORT|
✅NZD_CHF is trading in a
Downtrend and the pair formed
A bearish flag pattern so IF we
See a bearish breakout then we
Will be expecting a further
Bearish continuation and
A move down
SHORT🔥
✅Like and subscribe to never miss a new idea!✅

Bullish reversal in play?NZD/CHF is reacting off the pivot, which is a pullback support and could potentially rise to the 1st resistance.
Pivot: 0.47161
1st Support: 0.46757
1st Resistance: 0.47972
Risk Warning:
Trading Forex and CFDs carries a high level of risk to your capital and you should only trade with money you can afford to lose. Trading Forex and CFDs may not be suitable for all investors, so please ensure that you fully understand the risks involved and seek independent advice if necessary.
Disclaimer:
The above opinions given constitute general market commentary, and do not constitute the opinion or advice of IC Markets or any form of personal or investment advice.
Any opinions, news, research, analyses, prices, other information, or links to third-party sites contained on this website are provided on an "as-is" basis, are intended only to be informative, is not an advice nor a recommendation, nor research, or a record of our trading prices, or an offer of, or solicitation for a transaction in any financial instrument and thus should not be treated as such. The information provided does not involve any specific investment objectives, financial situation and needs of any specific person who may receive it. Please be aware, that past performance is not a reliable indicator of future performance and/or results. Past Performance or Forward-looking scenarios based upon the reasonable beliefs of the third-party provider are not a guarantee of future performance. Actual results may differ materially from those anticipated in forward-looking or past performance statements. IC Markets makes no representation or warranty and assumes no liability as to the accuracy or completeness of the information provided, nor any loss arising from any investment based on a recommendation, forecast or any information supplied by any third-party.

NZD/CHF SELLERS WILL DOMINATE THE MARKET|SHORT
Hello, Friends!
NZD/CHF pair is trading in a local uptrend which we know by looking at the previous 1W candle which is green. On the 9H timeframe the pair is going up too. The pair is overbought because the price is close to the upper band of the BB indicator. So we are looking to sell the pair with the upper BB line acting as resistance. The next target is 0.468 area.
Disclosure: I am part of Trade Nation's Influencer program and receive a monthly fee for using their TradingView charts in my analysis.
✅LIKE AND COMMENT MY IDEAS✅

Bearish reversal off pullback resistance?NZD/CHF is rising towards the pivot, which is a pullback resistance that lines up with the 61.8% Fibonacci retracement and could reverse to the 1st support.
Pivot: 0.47599
1st Support: 0.46757
1st Resistance: 0.48168
Risk Warning:
Trading Forex and CFDs carries a high level of risk to your capital and you should only trade with money you can afford to lose. Trading Forex and CFDs may not be suitable for all investors, so please ensure that you fully understand the risks involved and seek independent advice if necessary.
Disclaimer:
The above opinions given constitute general market commentary, and do not constitute the opinion or advice of IC Markets or any form of personal or investment advice.
Any opinions, news, research, analyses, prices, other information, or links to third-party sites contained on this website are provided on an "as-is" basis, are intended only to be informative, is not an advice nor a recommendation, nor research, or a record of our trading prices, or an offer of, or solicitation for a transaction in any financial instrument and thus should not be treated as such. The information provided does not involve any specific investment objectives, financial situation and needs of any specific person who may receive it. Please be aware, that past performance is not a reliable indicator of future performance and/or results. Past Performance or Forward-looking scenarios based upon the reasonable beliefs of the third-party provider are not a guarantee of future performance. Actual results may differ materially from those anticipated in forward-looking or past performance statements. IC Markets makes no representation or warranty and assumes no liability as to the accuracy or completeness of the information provided, nor any loss arising from any investment based on a recommendation, forecast or any information supplied by any third-party.

NZDCHF Trading Opportunity! BUY!
My dear followers,
I analysed this chart on NZDCHF and concluded the following:
The market is trading on 0.4695 pivot level.
Bias - Bullish
Technical Indicators: Both Super Trend & Pivot HL indicate a highly probable Bullish continuation.
Target - 0.4703
Safe Stop Loss - 0.4690
About Used Indicators:
A super-trend indicator is plotted on either above or below the closing price to signal a buy or sell. The indicator changes color, based on whether or not you should be buying. If the super-trend indicator moves below the closing price, the indicator turns green, and it signals an entry point or points to buy.
Disclosure: I am part of Trade Nation's Influencer program and receive a monthly fee for using their TradingView charts in my analysis.
———————————
WISH YOU ALL LUCK

NZDCHF: Downtrend MomentumSimilar to NZDCAD, there's a very similar signal on NZDCHF.
Daily Timeframe:
Unlike with NZDCAD, price broke through support very cleanly. It is currently holding below with no indication of a fakeout.
Likewise, EMA20 remains firmly below EMA60, which is the other indication that this is a downtrend.
Hourly Timeframe:
I use an ascending intraday trendline to indicate when the counter-trend movement is coming to an end. As price breaks below the intraday trendline, that's a good indication of confluence in the overall trend direction.
The EMA crossover is not great, which is a little bit of a concern to me. Will need to reduce risk and potential scale into a position depending on how this trade goes.
