GOLD M15 Bullish Continuation From LTF FVG📝 Description
TVC:GOLD on the 15-minute timeframe remains in a bullish structure after a strong impulsive move. Price has retraced into a 15m Fair Value Gap while holding above a valid 30m bullish Order Block, signaling continuation rather than reversal.
________________________________________
📈 Signal / Analysis
Primary Bias: Bullish
Preferred Setup:
• Entry: 4,931.8
• Stop Loss: Below 4,919
• TP1: 4,947
• TP2: 4,958
• TP3: 4,967 (Buy-Side Liquidity)
________________________________________
🧠 ICT & SMC Notes
• Clean bullish displacement confirms intent
• Pullback remains corrective
• Entry aligned with LTF FVG inside bullish leg
• Targets positioned at external Buy-Side Liquidity (BSL)
________________________________________
📌 Summary
Gold is showing healthy bullish continuation behavior. Holding above the 15m FVG keeps the bullish scenario valid with a draw toward higher liquidity levels.
________________________________________
🌍 Fundamental Notes / Sentiment
Gold remains supported under risk-hedging demand and dollar sensitivity, reinforcing bullish technical continuation in the short term.
________________________________________
⚠️ Risk Disclosure
Trading involves substantial risk and may result in capital loss. This analysis is for educational purposes only and does not constitute financial advice. Always apply proper risk management, predefined stop-loss levels, and disciplined position sizing aligned with your trading plan.
OB

OCT 2: S/R FLIP + 1H+15M FVGOCT 2: S/R FLIP + 1H+15M FVG
My original long idea after the sweep was not revisited, and I happened to also put a short trade on this S/r flip + 1H+15M FVG in expectation of a pull back.
Price nearly hit my stoploss though before hitting TP. I think it was a coincidence that the TP point is right in an SSL area.
Like, idk man... this isn't part of my trading strategy anymore.. but i guess this win is a good one because there's a lot of confluence(SR FLIP + 1H+15m FVG) on this trade.
Can't help but feel the TP point was based on luck though, as I don't remember setting it here specifically because it's an SSL area.

EURUSD 15M FVG LongThis is EURUSD in 15M there is bearish candle that makes FVG/IMB, we can take TP there, put your SL at your own risk

BTCUSD Short Scalp 15MThis is for BTCUSD because the trend is bearish, there is FVG that not mitigated yet. We wait the price tap the FVG then entry

PUMP | #4h #long — Watching for Breakout Confirmation Early signals for a reversal, but not rushing in.
Some clear bullish divergence on the 4h RSI — first positive sign after an extended downtrend. Price can pop from here, but my plan is to wait for a break and hold above the 4h Order Block + MSS zone (red box) before taking any long entry.
Confirmation is key — I only want to get involved if we reclaim this area with momentum.
Scenario:
If we get a strong breakout and close above the red OB + MSS zone, that’s the first entry trigger for a potential trend reversal.
Until then — standing aside, letting the setup prove itself.
Reasoning:
Bullish RSI divergence often marks the beginning of a reversal, but without a structural breakout, the move can easily fail.
Patience pays off in these high-risk, low-liquidity coins.

BTC – Still looking heavy below key resistanceDespite a short-term relief bounce after Monday’s drop, BTC remains below the critical 1D MSS + S/R (red box). Structure is weak until this level is reclaimed. Bears remain in control as long as price can’t close above 115.7k.
Plan:
Maintain bearish bias while below the red box — expecting new lows, targeting the green demand/OB cluster around 108.3k.
Flip the red box (close above 115.7k) and the outlook shifts to neutral or bullish.

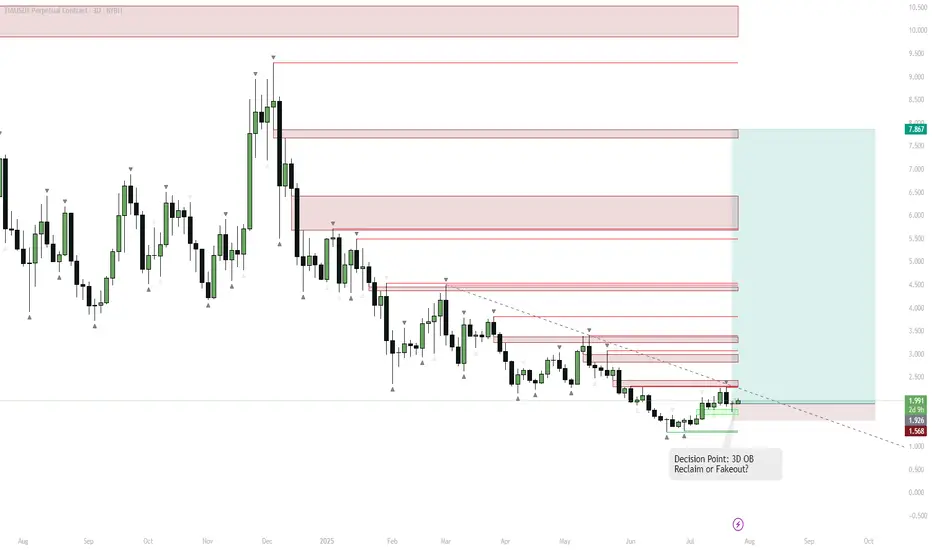
TIA — Pivot Point: 3D Order Block Reclaim or One More Breakdown?Key Observation
LSE:TIA has been in a prolonged downtrend, with a recent strong bounce from multi-month support (highlighted green).
Multiple supply zones (red) are stacked above, representing resistance.
Swing Short Context
Despite the bounce, the asset has a history of fakeouts and failed breakouts ("cursed asset").
A classic "10/10 top/bottom" pattern appears, suggesting a possible short-term top is forming.
However, a 3D bullish order block (OB) has been reclaimed on this candle.
Trigger Confirmation
If this 3D candle closes green and holds above the OB, momentum may flip bullish rapidly.
This reclaim would invalidate the bearish thesis and open up quick moves toward the next supply zones ($2.5–$3.5).
Bearish Alternative
If price fails to hold above the OB, or closes the candle red, the risk of a fakeout and move back to the lower support remains.
The downtrend line is a key resistance; rejection here can trigger another sweep of the lows ($1.56).
Swing Strategy
Short bias as long as price is below the OB and trendline, targeting a move back to $1.56–$1.92.
Flip to long/bullish bias only on a 3D close above the OB zone and trendline — this could trigger a rapid run to $2.5, $3.2, and higher.
Reasoning
The setup is a classic "pivot point" — either a breakdown from resistance for another leg down, or a confirmed breakout above the OB for a strong bullish reversal.
With stacked supply zones overhead, any breakout will likely see aggressive moves as shorts cover and new buyers chase.
Momentum traders should wait for the 3D close for confirmation.
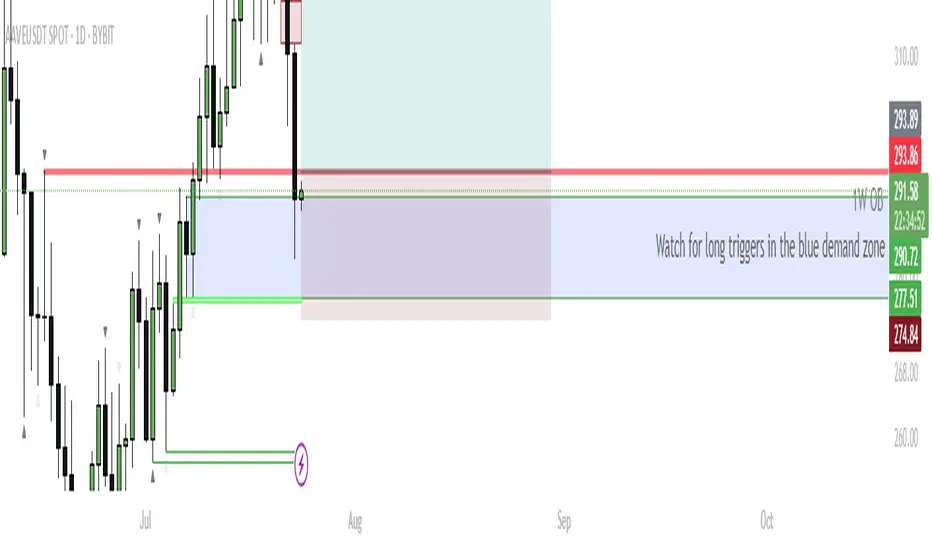
AAVE – Eyeing Reversal From Daily Demand for $400 TargetCurrent Structure:
AAVE recently rejected from 1M S/R at $332.54 and pulled back into a confluence support zone—overlapping 1W order block (OB), 1D OB, and previous resistance now flipped support ($277–$290 zone, marked blue).
Buy Zone:
Watching the blue box area for bullish reversal triggers. This is a high-probability demand zone due to multiple timeframe confluence.
Trigger:
Wait for a bullish reaction/candle confirmation inside the blue zone. Ideal scenario: bullish engulfing, sweep of the low and reclaim, or a strong bounce with rising volume.
Targets:
Primary upside target: retest of the 1M S/R at $332, then continuation toward $400 if momentum sustains.
Invalidation:
If price closes below the 1D OB ($274.84), long setup is invalidated—risk of further downside increases.
AAVE is testing a major support confluence zone, combining weekly and daily order blocks. This area previously acted as resistance and now presents a strong demand zone. If bulls defend this zone and trigger a reversal, there’s a clear runway back to previous highs and potentially $400. This setup offers a favorable risk/reward profile with tight invalidation.
FET Setup: Reclaim, Retest, RallyScenario:
Price reclaimed the 1W order block (OB), confirming strong support in the $0.60–$0.70 area.
If price consolidates above this weekly OB, expect continuation toward the $0.96 equilibrium/resistance zone.
A pullback to retest the 1W OB as support (especially in August) is possible and would be a high-probability entry zone for longs.
Failure to hold the 1W OB would invalidate the bullish setup, so stops should be placed below this level.
Reasoning:
The successful reclaim of the weekly order block signals a structural shift from bearish to bullish. Holding above this area invites further upside, as demand is confirmed. A retest and bounce from the 1W OB would provide a strong confirmation for additional upside, while failure to hold would indicate the move was a deviation. Patience for a clean retest is likely to reward, with targets toward the equilibrium near $0.96.

ETH — 3D OB + FVG Swing Long | #3D | BULLISH1️⃣ Buy zone: 2,500–2,600
2️⃣ TP: 3,280–3,495
Stop: < 2,500
Alert: FVG fill

BTC — Long from Support Box (#4h) | BULLISH1. Buy: Limit order 115.5k–116.6k
2. Alert: If close < 113k, scenario invalid
3. Target: 125k

Squeeze Building in BTC – Targeting 100,500 ShortPrice is coiling between interest zones above and a heap of liquidity below. Expecting an impulsive break—looking to short down to ~100,500.

XAUUSD (CONFIRMATION + OB + OTE)Hello traders!
From our previous analysis we expected reversal in 705 zone, now we have confirmation already and our target to close imbalance. Last open zone for interest is OB and mitigation(possible pullback with LG)
Have a profitable day and don't forget to subscribe for updates!

EU Long IdeaWe are looking at the final stage of accumulation and waiting for FED rate to trigger it. All short sellers have been absorbed and longs are clearly taking place now.

GBPUSD AnalysisGBP could potentially start its next bearish leg from the current level.
Price has reacted off a lower timeframe IFVG, which is currently acting as support.
If we get a clean close below this IFVG, along with proper short confirmation,
I'll be looking for bearish setups to target lower levels

EURUSD Bearish Price is likely to return to a strong rejection area, which is significant due to the presence of both an Order Block (OB) and a Breaker Block. This confluence makes it a key supply zone. Additionally, this area may potentially form the right shoulder of a developing Head and Shoulders pattern, suggesting a possible bearish reversal from that zone."

Bullish BiasPrice broke above the minor resistance at ~189.50 and appears to pull back to OB for a bullish continuation toward the next significant resistance zone (~195).

What is ICT Order Block and How to Trade it
👉🏻 ICT order block is basically an area on the price chart which indicates the huge institutional orders and signals the strong reversal or continuation of price.
You can use the order block as a confirmation of your trade entry or for the reversal of price.
In this article, we will teach you all about order block trading strategy from definition to its identification and to use along with examples.
You can jump to the part of this guide, you are most interested in or you can continue reading the whole article :
Table of Contents 👇🏻
1 : What is ICT Order Block?
2 : Types of Order Block
3 : Bullish Order Block
4 : Bearish Order Block
5 : Bullish Order Block Trading Strategy
6 : Bearish Order Block Trading Strategy
7 : Final Thoughts
What is ICT Order Block? ⚡️
ICT Order block is the area in the price chart, where a large number of orders are executed by institutional traders in the market and market shows sudden strong move from that area.
Retail traders follow institutional foot prints, so they wait for these order block zones to buy or sell in the market & make profit along with big institutions like banks.
You can see the example of order blocks in the picture given below :
Types of Order Block
As you know market has two price moves bullish & bearish. So on the basis of price moves, order block is divided into two types.
(I) Bullish Order Block
(II) Bearish Order Block
Bullish Order Block
A bullish order block is the last bearish candle before the bullish impulse (strong sudden) move, it typically consist of two candles, with the first candlestick being a bearish and the second candlestick being a bullish one.
How to Identify a Bullish Order Block? ⚡️
To identify a valid bullish order block you need to check following things.
(I) Second candle being a bullish candle, should grab the low of previous bearish candle. Price should go below the low of previous bearish candle.
(II) Second candle being a Bullish candle should close above the high of previous bearish candle.
(III) Imbalance in lower time frame in the order block zone.
(IV) Structure shift in lower timeframe.
To sum it up we can say, second candle should completely engulf the first candle – body to body & wick to wick.
You can see the example of bullish order block in the picture below :
Bearish Order Block ⚡️
A bearish order block is the last bullish candle before the bearish impulse move, it typically consist of two candles, with the first candlestick being a bullish and the second candlestick being a bearish one.
How to Identify a Bearish Order Block? ⚡️
To identify a valid bearish order block you need to check following things.
(I) Second candle being a bearish candle, should grab the high of previous bullish candle. Price should go above the high of previous bearish candle.
(II) Second candle being a bearish candle should close below the low of previous bullish candle.
(III) Imbalance in lower timeframe in the order block zone.
(IV) ICT Market Structure Shift in lower timeframe.
To sum it up we can say second candle should completely engulf the first candle – body to body & wick to wick.
You can see the example of bearish order block in the picture below :
Bullish Order Block Trading Strategy ⚡️
In bullish order block trading strategy you would look for shift of price delivery from bearish to bullish and then execute a buy trade utilizing a bullish order block.
When the trend is bearish and it approaches a demand zone where you would seek reversal of price and at that area price shifts its structure to the buy-side.
Then you will be looking for the order block at the bottom of the impulse move which changed market trend.
When you find the bullish order block in that move, it means it was a move involving institutions so you need to wait for the price to test the bullish order block zone to execute a buy trade.
When price retraces back and tests the bullish order block zone you can execute a buy trade as shown in the picture below :
When tradin bullish Order block trading strategy your stop loss will be 10/20 pips below the low of order block zone.
Bearish Order Block Trading Strategy ⚡️
In bearish order block trading strategy you would be looking for the shift of trend from bullish to bearish and then execute a sell trade utilizing a bearish order block.
When market trend is bullish and it approaches a supply zone where you seek reversal of price and at that area price shifts its structure to the sell-side.
Then you would look for the order block at the bottom of the impulse move which changed price trend.
When you find a bearish order block in that move it means it was a move involving institutions so you need to wait for the price to test the bearish order block zone to execute a sell trade.
When price retrace back and tests the bearish order block zone you can execute a sell trade.
A real market example of bearish order block trading strategy is shown below in the picture.
Final Thoughts⚡️
When trading using bearish Order block trading strategy our stop loss will be 10/20 pips above the high of order block zone.
Order blocks can also be found in a trend after a pull back and these order blocks confirm the strength of trend. We can use these order blocks to trade the trend or to add new positions in the trend.
Like in a bearish trend after a bullish pullback a bearish order block may form, which confirms the strength of bearish trend and we can add a new sell order to enjoy the bearish trend.
Likewise in a bullish trend after a bearish pullback a bullish Order block may form which confirms the strength of bullish trend and we can add a new buy order to enjoy the bullish trend ❤️ .

Ethereum Analysis - Bull Trap - Don't Buy!COINBASE:ETHUSD recently tapped into the 1,800$ order block, but rather than signaling a bullish reversal, this level appears to be pure inducement. There is no fair value gap above this zone, meaning there’s no true imbalance that price needs to mitigate. This suggests that smart money is not positioning for higher prices here, but instead using this level to lure in retail longs before engineering a deeper move to the downside.
The broader market structure remains bearish, with price continuously making lower highs and lower lows. While many traders may see the 1,800 order block as a support level, the absence of a fair value gap indicates that this area lacks real institutional interest. Instead, it serves as a liquidity pool where market makers can absorb buy orders before driving price lower. The true liquidity targets lie below, particularly around the 600$ levels, where a significant number of stop losses and liquidation points are resting. These levels act as magnets, and until they are taken, the probability of a sustained bullish move remains low.
Additionally, the inefficiencies left in the previous sharp upward move suggest that price still has unfinished business to the downside. Smart money thrives on liquidity, and the clean lows below 600$ offer an attractive area for a deeper sweep before any meaningful bullish expansion can take place. This is a classic case of market manipulation, where early longs are baited into the market just before a significant downside move clears out weaker hands.
Once liquidity has been swept from the 600$ regions, the probability of a true reversal increases. At that point, institutional players will have accumulated enough liquidity to justify a move higher. The most logical upside target following this sweep is the 2,700 order block, which aligns with a previous imbalance and a major area of institutional interest. However, until the sell-side liquidity is fully taken out, any attempt at longs is premature and likely to result in being used as exit liquidity for smart money.
In conclusion, the current price action is a textbook example of liquidity engineering. The move down into 1,800$ was a carefully orchestrated inducement to trap buyers before a deeper price correction. The most probable scenario is a continued decline to sweep liquidity below 600$, at which point smart money will begin repositioning for a true bullish move toward 2,700. Until then, every attempt to push higher is likely just part of a larger manipulation cycle designed to fuel the next major market move.

$TRUMP ─ @realDonaldTrump Long Trade SETUP$TRUMP ─ @realDonaldTrump Long Trade SETUP 👀
Looking for another long trade entry.
⚠️If the Twin OB fails, then a new low is on the table.
ENTRY = TwinOB + FibFan + nPOC + Fib Golden Pocket + WO + DO
SL = below VAL + TwinOB
------------
------------
As always, my play is:
✅ 50% out at TP1
✅ Move SL to entry
✅ Pre-set the rest of the position across remaining TPs
It's important to take profits along the way and not turn a winning trade into a losing trade.

Tesla (SHORT)I am thinking its going down to the Strong pressure area under it and also with the negative and controversial things going around with Tesla its not impossible and probably good idea. Give me some of your ideas

XAU/USD SellClarification : If the price forms an accumulation below an OB/FVG, it could be a potential selling area. Ensure that the price makes lower lows for confirmation before entering the trade. Also, manage your money wisely.

A lot of green signals in my eyes.Here i have placed 4 Fair value gap's (Purple rectangle) where 1 is already hit pefectly by that way it dip in to Equilibrium and bought at a premium price and it has responded just perfect of that for the rest of my prediction.
Now, there are three pretty good Fair value gap's above, that market want's to reach so it can fill orders / Price ranges where it lacks liquidiy.
Also we can se 6 Liquidity spots (Blue lines), where as 1 is under current market position (Will talk about that one soon). So market is obviously atracted to those prices so it can get some good liquidiy.
And so when there is some decent looking Fair value gap's and there even is liquidty to get at those levels it is almost inevidable in my eyes that prices doesn't go up there.
So even if the market would want to dip to a price of 2,550 perhaps because of the liquidity laying there it would firstly need to get all the liquidity laying above plus the fair value gaps that the market wants to fullfill.
And the order blocks (red circle's) shows prices were filled at that level previously and just adds to the reason of price wanting to go up.
(Daily chart)
I am not the best at frasing myself, so sorry if it is a bit messy.
Would love to hear feedback! Even just a thumbs down or up!
