US OilCrude Oil
- Completed " 12345 " Impulsive Waves
- Break of Structure
- RSI - Divergence
- Double Bottom as an corrective pattern in Short Time Frame
- Fibonacci Level - 61.80% / 78.60%
Oilanalysis

Middle East Risks Keep Brent Oil Bullish — Higher TargetsAs I expected in the previous idea , Brent Crude OIL( BLACKBULL:BRENT ) has risen and reached its targets, with a Risk-To-Reward: 2:01 (full target).
Brent Crude OIL is currently trading near the support zone($63.30-$62.00) and the support lines.
From an Elliott Wave perspective, it appears that Brent Crude OIL has completed main wave 4, and we can now expect the next impulsive wave for the main wave 5.
Additionally, news from the Middle East does not indicate a reduction in tensions, and we can expect potential surprises in the region. Therefore, I prefer to maintain long positions in Brent Crude OIL rather than short positions, and I’m looking for triggers to enter long.
I expect that Brent Crude OIL will once again target the resistance zone($66.80-$65.00) and potentially rise to around $66.47. The next target could be the yearly pivot point($67.30).
First Target: $66.47
Second Target: $67.30
Stop Loss(SL): $62.60
Points may shift as the market evolves
💡 Please respect each other's opinions and express agreement or disagreement politely.
📌U.S. Dollar/Brent Crude OIL Analysis (USDCAD), 4-hour time frame.
🛑 Always set a Stop Loss(SL) for every position you open.
✅ This is just my idea; I’d love to see your thoughts too!
🔥 If you find it helpful, please BOOST this post and share it with your friends.

Oil is Boiling! 1/23/2026
After CRYPTOCAP:BTC ’s big run to $126K (now cooling off in corrective mode), Silver and Gold are pushing into new highs and closing in on their projected targets. Meanwhile, Oil popped +2.45% today and the chart is heating up — technically it looks primed for a major upside move.
With rising geopolitical tensions in the Middle East, the energy market is getting extra fuel.
Historically, geopolitical shocks have been one of the strongest catalysts for sharp Oil price swings — more than almost any other factor.
Momentum is shifting fast across the board… the next big rotation could be explosive!
Happy Trading!

Brent Oil Breaks Resistance as Middle East Tensions EscalateWith the start of the new week, Brent Oil( BLACKBULL:BRENT ) has continued its bullish trend.
Given the escalating tensions in the Middle East, a region that is crucial for global oil production, oil prices have risen accordingly.
Brent Oil has successfully broken through the resistance zone($63.30-$62.00) and resistance lines and is currently completing a pullback to these levels.
I expect that, given the potential for renewed tensions in the Middle East in the coming days and hours, the bullish trend in oil will continue, supported by both fundamental and technical analysis, and it will reach the targets set in the chart.
First Target: $64.91
Second Target: $65.77
Stop Loss(SL): $62.07
Points may shift as the market evolves
💡 Please respect each other's opinions and express agreement or disagreement politely.
📌U.S. Dollar/Brent Crude OIL Analysis (USDCAD), 4-hour time frame.
🛑 Always set a Stop Loss(SL) for every position you open.
✅ This is just my idea; I’d love to see your thoughts too!
🔥 If you find it helpful, please BOOST this post and share it with your friends.

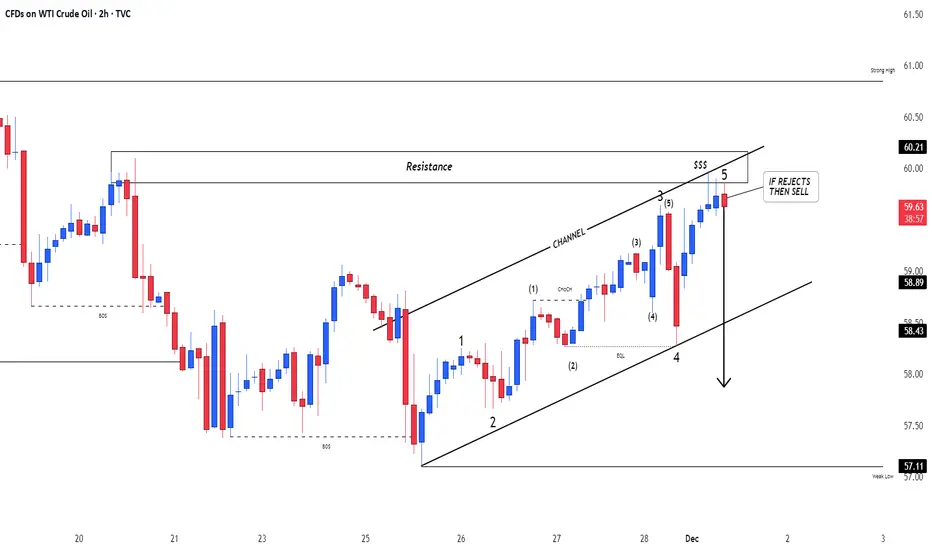
Crude Oil – Sell around 58.60, target 56.00-55.00Crude Oil Market Analysis:
The fundamentals have had a significant impact on crude oil over the past two days, but crude oil seems to have become desensitized to these fundamentals, showing little reaction. The market is maintaining a relatively calm, small-scale consolidation. Our strategy for today remains bearish; sell on rallies. The daily moving averages are starting to diverge. For buying opportunities, pay attention to the 55.00 level. If it breaks, we expect a significant sell-off.
Fundamental Analysis:
Today, we will focus on the ADP employment data and the EIA crude oil inventory data.
Trading Recommendation:
Crude Oil – Sell around 58.60, target 56.00-55.00

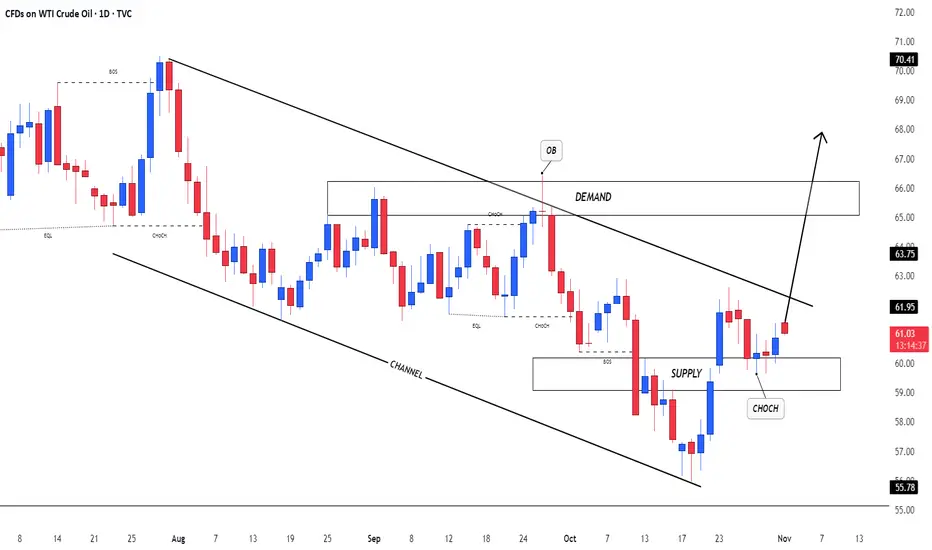
Crude OilU.S Oil
- Sell Side Liquidity
- Break of Structure
- Bearish Channel as an corrective pattern in Short Time Frame
- Fair Value Gap
- IDM
- Order Block

Crude OilU.S Oil
- Symmetrical Triangle as an corrective pattern in Long Time Frame
- Break of Structure
- Impulse Correction
- Demand Zone
- Change of Characteristics

Crude OilU.S Oil
- Completed " 13245 " Impulsive Waves
- Break of Structure
- RSI - Divergence
- Order Block
- Bearish Channel as an corrective pattern in Short Time Frame

US OilCrude Oil
- Double Bottom in Long Time Frame
- RSI - Divergence
- Fair Value Gap
- SSL
- Bearish Channel as an corrective pattern in Short Time Frame

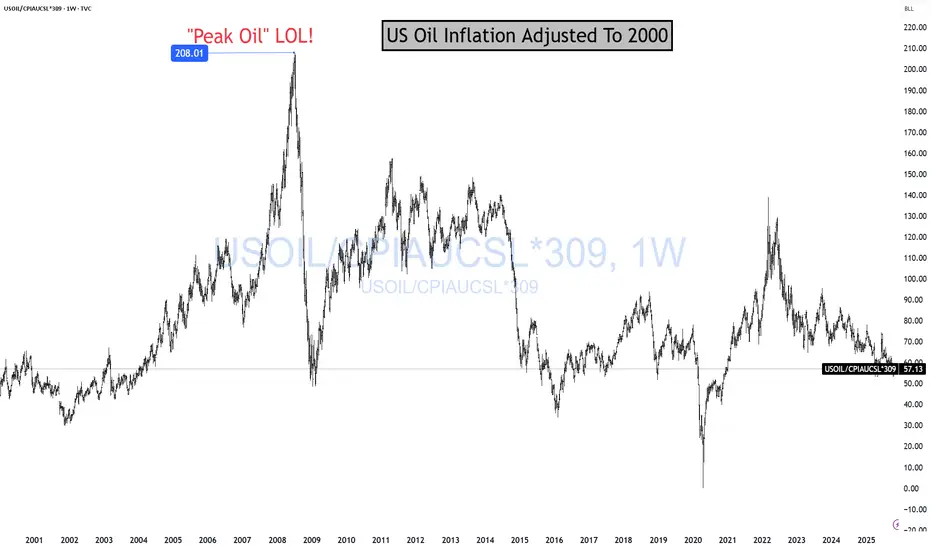
OIL Is Cheap For A ReasonOil is cheap because the global economy sucks! And it is "sucking" more and more every day. That's why Oil is on sale! Cheap! Cheap! And likely going to get more "cheap! cheap!" Me love you long time! Before I continue, story time.
In 2008, I could not convince anyone for the life of me that "PEAK OIL" was a scam! CNBC had T. Boone Pickens on twice a day, telling people we needed 238948735765374 barrels of oil to extract 1 barrel out of the ground.
Today, I can't convince anyone to skip EV, TSLA, AI, Crypto, the money has been made, GTFO. LOL!
As you can see, Oil is a much better long-term investment than all the hyped up trades pushed on to you daily.
Energy stocks make up about 3% of the S&P 500.
The Magnificent Seven circus? Roughly 36% of the entire index. LOL!
What are energy stocks going to do? Go to 1.5% of the SP500? Let it! Buy more!
BTW, you notice how they keep telling you AI will need all this energy? LOL! Wouldn't energy stocks reflect all that demand? LOL! SUCKA!
Anyway! Just look at the chart. If this makes sense to you and it fits your portfolio to BUILD a position long term, let me know in the comments. ;)
I have more on Oil here
THANK YOU for getting me to 5,000 followers! 🙏🔥
Let’s keep climbing.
If you enjoy the work:
👉 Drop a solid comment
Let’s push it to 6,000 and keep building a community grounded in truth, not hype.
Crude OilU.S Oil
- Bullish Channel as an corrective pattern in Short Time Frame
- Resistance Level
- Change of Characteristics
- Completed " 12345 " Impulsive Waves
- Order Block
US OilCrude Oil
- Order Block
- Falling Wedge as an corrective pattern in Long Time Frame
- RSI -Divergence
- Demand Zone
- Completed " 1234 " Impulsive Waves

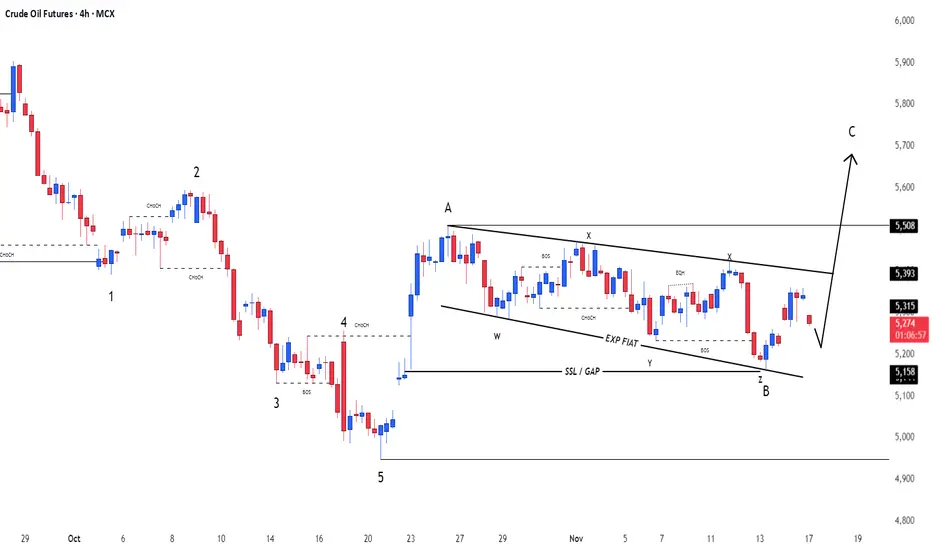
Crude OilU.S Oil Index
- Exp Fiat as an corrective pattern in Short Time Frame
- Break of Structure
- Completed " 12345 " Impulsive Waves and " AB " Corrective Waves
- Sell Side Liquidity
- Order Block
Oil - Expecting Bullish Continuation In The Short TermH1 - Downtrend line breakout.
Higher highs.
No opposite signs.
Until the two strong support zones hold I expect the price to move higher further.
If you enjoy this idea, don’t forget to LIKE 👍, FOLLOW ✅, SHARE 🙌, and COMMENT ✍! Drop your thoughts and charts below to keep the discussion going. Your support helps keep this content free and reach more people! 🚀
--------------------------------------------------------------------------------------------------------------------

US OilCrude Oil Index
- Bearish Channel as an corrective pattern in Short Time Frame
- RSI - Divergence
- Supply Zone
- Change of Characteristics
- Order Block
Oil - Expecting Bullish Continuation In The Short TermM15 - Strong bullish momentum.
No opposite signs.
Until the two Fibonacci support zones hold I expect the price to move higher further.
If you enjoy this idea, don’t forget to LIKE 👍, FOLLOW ✅, SHARE 🙌, and COMMENT ✍! Drop your thoughts and charts below to keep the discussion going. Your support helps keep this content free and reach more people! 🚀
--------------------------------------------------------------------------------------------------------------------

Crude oil - Sell around 61.00, target 58.00-56.00Crude Oil Market Analysis:
Crude oil previously started to decline on the daily chart. Yesterday's daily chart rebounded due to the EIA crude oil inventory data. Today's crude oil strategy remains bearish. Continue selling on rebounds. There's no chance of a reversal in crude oil sales, and the data-induced rebound is only temporary. Focus on sell opportunities at 61.00 today.
Fundamental Analysis:
The alarming crude oil inventory data is supporting crude oil buying prices. Furthermore, whether Federal Reserve officials have signaled further interest rate cuts will support gold buying.
Trading Recommendations:
Crude oil - Sell around 61.00, target 58.00-56.00
US OilCrude Oil
- Consolidation Phase
- Break of Structure
- Bearish Channel as an corrective pattern in Short Time Frame
- Order Block
- Resistance Level
Crude Oil: Bullish Momentum Builds Above $62.13FenzoFx—Crude Oil tapped into the liquidity below the equal lows at $62.13. However, the cumulative volume profile did not form new lower lows. This means the market could be bullish, at least in the short term.
Therefore, we expect Oil to rise higher. The immediate resistance is at $62.74. From a technical perspective, the price could target the bearish FVG with resistance at $64.84 if bulls close and stabilize the price above $62.74.

USOIL: Breaks $64.75 — Is a retest of $66 and higher level?This is my previous analysis — feel free to take a look for reference.
* Trend: assessed using at least three trend indicators, with market structure as the primary guide.
** Weak or Reversal Signals: Assessed based on one of our criteria for trend reversal signals.
*** Support/Resistance: Selected from multiple factors – static (Swing High, Swing Low, etc.), dynamic (EMA, MA, etc.), psychological (Fibonacci, RSI, etc.) – and determined based on the trader’s discretion.
**** Our advice takes into account all factors, including both fundamental and technical analysis. It is not intended as a profit target. We hope it can serve as a reference to help you trade more effectively. This advice is for informational purposes only and we assume no responsibility for any trading results based on it.
Please like and comment below to support our traders. Your reactions will motivate us to do more analysis in the future 🙏✨
USOIL: Range-bound setup with upside test before downside risk
* Trend: assessed using at least three trend indicators, with market structure as the primary guide.
** Weak or Reversal Signals: Assessed based on one of our criteria for trend reversal signals.
*** Support/Resistance: Selected from multiple factors – static (Swing High, Swing Low, etc.), dynamic (EMA, MA, etc.), psychological (Fibonacci, RSI, etc.) – and determined based on the trader’s discretion.
**** Our advice takes into account all factors, including both fundamental and technical analysis. It is not intended as a profit target. We hope it can serve as a reference to help you trade more effectively. This advice is for informational purposes only and we assume no responsibility for any trading results based on it.
Please like and comment below to support our traders. Your reactions will motivate us to do more analysis in the future 🙏✨
Oil gains amid geopolitical risks, supply outlookOil gains amid geopolitical risks, supply outlook
Oil rose in early trade as markets weighed rising geopolitical tensions against forecasts of oversupply. Trump warned of major sanctions on Russia and urged allies to impose steep tariffs on China and India for buying its crude, while Ukraine’s drone strikes on Russian refineries added to risks.
Goldman Sachs expects oil to trend lower next year on strong supply growth but says prices may rebound sooner if inventories peak or OPEC cuts output. The bank now sees Brent in the low $50s and WTI near $50 by end-2026.

Oil Prices Drop on Russia-Ukraine Talks HopeOil prices decline in anticipation of potential negotiations between Russia and Ukraine
U.S. President Donald Trump announced plans to facilitate a meeting between Ukrainian President Volodymyr Zelenskiy and Russian President Vladimir Putin, following his Monday summit with Zelenskiy and European leaders. Zelenskiy called the talks with Trump “very productive,” highlighting discussions on U.S. security assurances for Ukraine. A resolution to the Russia-Ukraine conflict could lift sanctions on Russian energy exports, freeing up crude oil trade. Oil prices have dropped around 10% this month due to trade tensions and increased OPEC+ production.
Technically the price consolidates below the intermediate 6,300.00, forming the bearish pennant. Price is getting ready to decline. Here, the first target will be the major level of 6,000.00.
