SinnSeed | ROSNEFT (ROSN) | Overview - 15.02.2026🛢 #SinnSeed | ROSNEFT (ROSN) | Overview: News, Financials, Forecast 🔗
🖥 Latest Developments & Impact on Stock Price
⚠️ Sanctions & Exports . In October 2025, the US included #Rosneft (along with #Lukoil ) in a new sanctions package. The consequences are already being felt:
🔴 Exports plunged ~32% by December 2025 — the Urals discount widened to 25 USD/bbl 🔴 Oil volumes stuck on tankers at sea — shares dropped 3.8–5.6% depending on the exchange 🔴 India's imports of Russian oil fell to the lowest since 2022 — ~1.1M bbl/day in January 2026
⚠️ The PCK Schwedt Problem. The German refinery, held under trust management, remains a point of tension. Sanctions threaten fuel supplies to Berlin. Rosneft has officially warned of the risks — deadline April 29, 2026.
💥 Incidents & Production. A series of #drone attacks in November–December 2025 damaged oil depots and #refineries . The result — a loss of 350K bbl/day in January 2026. No major new contracts. The company is pivoting to the domestic market and counting on tax incentives of ~10B RUB/year for 2026–2030.
📉 Combined effect: shares have lost 12–15% since October 2025. Financial crisis. H1 2025 profit collapsed by 68%. #CEO Sechin publicly blames Western restrictions. 🤥
📊 Financial Analysis | 9M 2025 (IFRS)
🔻 Revenue → 6,288B RUB (−17.8% YoY) 🔻 EBITDA → 1,641B RUB (−29.3% YoY) 🔻 Net Income → 277B RUB (−70.1% YoY) ▪️ Free Cash Flow → 591B RUB 🔻 Net Debt / EBITDA → 1.3x ▪️ Total Debt → ~36B USD
Quarterly Profit Dynamics: Q1 → 170B ▸ Q2 → 74B ▸ Q3 → 32B RUB The trend is clear — an accelerating decline. 🔽
Key Pressure Drivers:
🔻 Low oil prices + market surplus (~2.6M bbl/day) 🔻 Ruble appreciation eating into RUB-denominated revenue (thanks to the NWF and the fiscal rule) 🔻 High CBR key rate → debt servicing costs +2.5–3.8B USD 🔻 Declining gas production (−13.1%) and refining (−7.8%)
🔮 Forecast Through August 2026
The base case assumes continued sanctions pressure and a market surplus of ~2.4M bbl/day in 2026.
Выручка: −10–15% YoY → ~8T RUB/year, assuming Urals doesn't hold above 50 USD Net Income: stabilization or −20% → ~300–350B RUB/year
🔸 Upside support — tax incentives and the Vostok Oil project (launch in 2026, target capacity up to 2M bbl/day by 2030)
Debt load: Net Debt / EBITDA → 1.5–1.7x, with risk of increased borrowings
Stock: — if oil > 60 USD → rebound potential +5–10% — if oil < 60 USD → further decline likely −5–10%
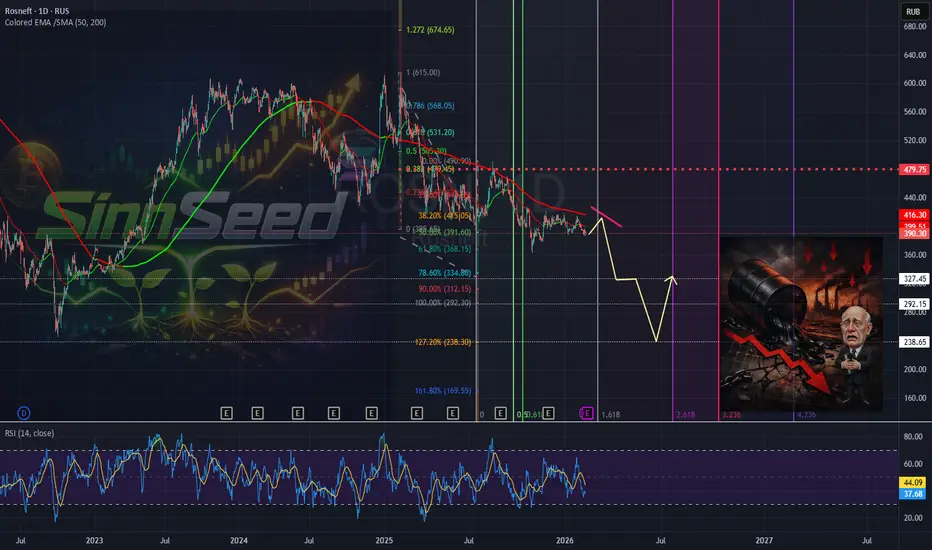
Technical Picture 👨💻
📉 A correction to the 38.2% level indicates a strong downtrend.
By 20.03.2026, I expect a drop to 325 RUB. Followed by a continuation to 290 RUB. A potential impulse move toward the 260–240 RUB zone is possible, after which a local reversal could be considered.
No buying before 260 RUB .
What do you think about the forecast? Share in the comments.
Oilprice
New Analysis – West Texas Oil (WTI)Those who follow my work know that we have posted multiple oil analyses in a row,
all of them successful, closed with high reward ratios ✅
But let me be very clear:
❌ I’m not part of OPEC
❌ I’m not a politician
❌ I don’t have access to political or economic decisions
No one knows what’s really going on in Powell’s mind,
what Trump plans to do with Iran,
or what the future holds for Venezuela, Cuba, or others.
📌 These are market drivers,
but we have zero access to policymakers’ decision rooms.
We are simply small traders,
trying to extract profits from opportunities — nothing more.
🔎 In this analysis, after making solid profits,
I’m willing to risk a small portion of those gains.
This setup carries higher risk, and that’s fully intentional.
📉 At the moment,
we are sitting at a good area to sell oil.
🔁 If this level breaks,
as always,
I’ll wait for a pullback and look for a long position.
🎯 No bias, no predictions — just following the market.
🌹 Stay safe & stay profitable

Crude Oil (USOIL) OutlookTechnical Analysis: USOIL (Crude Oil)
Feb 11, 2026
Pivot Point: 63.85 The price is currently trading and stabilizing above the 63.85 level, which maintains a positive outlook for the session.
Bullish Scenario (Primary)
As long as the price remains sustained above the pivot point of 63.85, the momentum is bullish:
First Target: Reaching the resistance level at 64.90.
Second Target: A successful breakout above this level will clear the path toward 65.20.
Bearish Scenario (Alternative)
If the price pulls back and closes firmly below the 63.85 pivot point (specifically on the hourly timeframe):
The trend will shift to negative/bearish.
Downside Target: A break below the pivot will target the next support level at 62.65.
Summary:
Above 63.85: Momentum is strongly Bullish.
Below 63.85: Trend shifts to Bearish.

USOIL Daily Update: Primary Targets and Key Pivot LevelsTechnical Analysis: USOIL (Crude Oil) – 10/2/2026
Pivot Point: 63.85 Based on current price action, the price has successfully stabilized above this level. This indicates buying pressure and a directional shift toward a bullish trend.
Bullish Scenario (Primary)
As long as the price remains and trades above the pivot point of 63.85, the trend is upward:
First Target: Reaching the resistance level at 64.65.
Second Target: If the price breaks above this resistance, it is expected to advance toward 65.20.
Bearish Scenario (Alternative)
If the price pulls back and closes firmly below the 63.85 pivot point (specifically on the hourly timeframe):
The outlook will turn negative, with the first target being 62.40.
If this support is broken, the price may drop further toward 61.40.
Summary:
Above 63.85: Momentum is strongly Bullish.
Below 63.85: Trend shifts to Bearish.

Oil Price at a Crossroads: Will the 63.45 Support Hold ?
📊 USOIL (WTI) Technical Analysis - Feb 6, 2026
📍 Pivot Point: 63.45 The price is currently hovering around the pivot level, which serves as the decisive zone for the next market trend.
📉 Bearish Scenario (Primary Outlook)
As long as the price remains below the pivot point of 63.45, the bearish momentum is expected to dominate:
🎯 Target 1: A drop toward the first support at 62.40.
🎯 Target 2: A breakout below 62.40 will push the price further down to the 61.40 zone.
📈 Bullish Scenario (Alternative Outlook)
If the price manages to break above the 63.45 pivot and stabilizes, the trend will shift to bullish:
🚀 Target 1: A recovery toward the resistance level at 64.65.
🚀 Target 2: Breaking above 64.65 will pave the way for 65.20 and potentially 65.95.
🔍 Key Takeaways:
Below 63.45: The trend remains Bearish.
Above 63.45: The trend shifts to Bullish.

This oil does not show a good outlook...This oil does not show a good outlook???
It may be due to the policies of seizure (you read theft) of oil wells, and after the seizure of oil, we had up to 3 times the price in history, which has become expensive to cover the costs of shameless war by killing children and men and of course women in certain parts of the world.
In the meantime: a number of countries played the role of executioners (they are still killing)
A number of countries played the role of supplying goods for the world after high oil prices (China)
And a number of countries played the role of sellers of expensive oil and small amounts of goods supplied with expensive oil to some people! (Oil well owners)
With the great theft of Venezuelan oil, this behavior will probably be repeated again!
We will have to spend a lot of time on the road to realize this scenario again
We hope for God's justice to eliminate the corrupt and those who participate in corruption, whether on earth or activists and participants in Ep/stein's personal island
Introduce me to your friends so we can build a bigger community together.

USOIL (WTI Crude Oil)–Daily Timeframe Analysis - Strong Bullish📉📈 Key Structure & Price Action
WTI is currently trading near 64.7, after a strong bounce from the major demand zone (56–58). Price has now reached a critical supply & decision area, where sellers have previously defended aggressively.
🔍 Market Structure
Overall structure remains range-bound on higher timeframes
Price respected HTF demand (56–58) and formed a higher low
Recent rally shows short-term bullish momentum, but price is now entering heavy supply
🔴 Major Supply / Resistance Zones
64.5 – 66.0 → Strong daily supply (previous bearish rejections & bear wicks)
69.0 – 70.5 → Upper range resistance
Sellers are active in the current zone, making it a sell-reaction area, not a breakout yet
🔵 Demand / Support Zones
60.0 – 61.5 → First intraday / short-term support
56.0 – 58.0 → Strong HTF demand & accumulation zone
As long as 56 holds, downside risk remains limited
📊 Scenario Planning
✅ Bullish Continuation:
A daily close above 66.0 with acceptance can trigger continuation toward
➡️ 69.0 → 72.0
❌ Bearish Rejection:
If price rejects from 65–66, expect a pullback toward
➡️ 61.5 → 60.0, and possibly 58.0 if momentum weakens

US OilCrude Oil
- Completed " 12345 " Impulsive Waves
- Break of Structure
- RSI - Divergence
- Double Bottom as an corrective pattern in Short Time Frame
- Fibonacci Level - 61.80% / 78.60%

Possible Bullish Uptrend channel OIL Price Next Months According to Fundamental Geopolitics events
According to Risk of World War
According to technical analysis, the end of the corrective wave is at the 50-60% Fibonacci retracement.
Convergence on CCI

Will #USOIL (WTI Crude) Falling Channel Rise? –Weekly Timeframe Will #USOIL USOIL (WTI Crude) Falling Channel Rise? – Weekly Timeframe Technical Analysis
Current Price: 61.1
Market Structure
WTI remains in a long-term corrective phase following the 2022 peak - Over 50% Retracement. Price action is clearly contained within a well-defined descending channel (red), characterised by lower highs and lower lows. This confirms that, structurally, the market is still bearish on a primary timeframe. However, price is now trading very close to the lower boundary of the channel with a double bottom, where downside momentum historically weakens.
Key Support & Demand Zone
Major support is between 56.00 – 61.00
This zone has acted as a multi-year demand area, repeatedly absorbing selling pressure.
The most recent weekly candles show **rejection wicks and reduced downside follow-through**, suggesting seller exhaustion rather than aggressive distribution.
A sustained weekly close **below 56** would invalidate this current recovery and expose the low-40s.
Resistance & Upside Levels
If price holds above support and breaks channel resistance, the following upside levels come into focus:
73.96 Prior structural resistance and midpoint reaction zone
91.95 Major range resistance from previous distribution
111.65: Upper macro resistance
127.95: Long-term target aligned with prior highs. These levels align well with historical supply zones and would likely trigger profit-taking on any rally.
Momentum, Bias and Invalidation
Momentum remains neutral-to-bearish but losing downside strength
A weekly close above the descending channel would signal a structural shift from bearish continuation to bullish recovery. Until that breakout occurs, rallies should still be treated as corrective within a broader downtrend.
Invalidation and Bearish Continuation lives below 56 (A weekly close below)
Conclusion
WTI is at a critical inflection point. While the dominant trend remains bearish, price location favours a potential upside reaction due to strong historical demand and channel compression. Confirmation, not anticipation, is key.
Not Financial Advice!!

Oil is Boiling! 1/23/2026
After CRYPTOCAP:BTC ’s big run to $126K (now cooling off in corrective mode), Silver and Gold are pushing into new highs and closing in on their projected targets. Meanwhile, Oil popped +2.45% today and the chart is heating up — technically it looks primed for a major upside move.
With rising geopolitical tensions in the Middle East, the energy market is getting extra fuel.
Historically, geopolitical shocks have been one of the strongest catalysts for sharp Oil price swings — more than almost any other factor.
Momentum is shifting fast across the board… the next big rotation could be explosive!
Happy Trading!

Risk premium on Oil unwinding?A Reuters report yesterday suggested a US attack on Iran was imminent, pushing oil to its highest level since October.
“Iranian Patriots, KEEP PROTESTING, TAKE OVER YOUR INSTITUTIONS!!! HELP IS ON ITS WAY,” Trump posted on Truth Social.
Today, that risk premium is fading as no military action has materialised. WTI is down, erasing two of the last four days of rallies.
The outlook can shift to the upside again quickly if tensions escalate, but traders should weigh the geopolitical risk against the reality of an oversupplied oil market.

Where Is Oil Heading To ? - /CL Analysis 1) Technical Perspective: Support & Resistance
~$65 was a support zone earlier (2021–2024). In 2025–26, that $65 area now often acts as resistance. Prices have come down toward $55
2) Fundamental Drivers Behind the Downtrend
Oil has been in a multi-year decline from the highs seen in 2022 after the Russia–Ukraine war spike. A combination of oversupply and weaker demand has kept price pressure on:
• 2025 saw a large annual price drop due to persistent oversupply and slow demand.
• EIA and IEA reports project global oil supply continuing to exceed demand into 2026.
This structural oversupply (positive global inventories) pushes the short-term bias lower unless demand surprises on the upside.
3) Geopolitical Drivers — Including Venezuela
Recent news confirms that geopolitics remain a key wild card: The U.S. has taken actions around Venezuelan oil assets and plans to export Venezuelan crude, which could add supply and weigh on prices, especially if revitalisation occurs. Oil prices did tick up short-term on inventory draws and Venezuela focus, but long-term gains from Venezuelan production may be limited because infrastructure will take years to rebuild. Geopolitical tensions can spike oil temporarily, but unless supply physically tightens, the structure stays bearish.
4) OPEC / OPEC+ Decisions
OPEC’s recent behaviour has been a big driver:
In 2025, OPEC+ unwound production cuts, which contributed to oversupply and lower prices.
For 2026: The OPEC+ view has shifted toward equilibrium, but global supply growth still challenges prices. If OPEC+ cuts output further or extends cuts, prices could find stronger support around current levels ($55–$65). If OPEC+ maintains or increases production while demand stays soft, that supports a drop toward $45–$50. So OPEC policy is one of the most important catalysts, it fundamentally shifts supply.
5) Demand Risks & Macro Conditions
Global demand remains under pressure: Chinese economic weakness and slower global growth reduce oil demand. And EIA forecasts oversupply growth in 2026.
Lower demand growth + abundant supply = structural downside risk.
6) Link to US Dollar, Inflation & Rates
Higher real rates / stronger USD → oil tends to weaken:
Oil is USD-denominated. A stronger dollar makes oil more expensive for holders of other currencies. Tight monetary policy (higher rates) can slow economic growth and demand for oil.
Lower real rates / weaker USD → oil tends to strengthen: Cheaper USD can support crude prices if demand fundamentals improve.
Right now, with US economic strength and mixed inflation data elsewhere, it’s not certain the Fed will aggressively cut. If inflation re-accelerates and the Fed resists rate cuts or even raises, that could strengthen the USD and pressure oil lower.
However, if the Fed eases later, weaker real rates could help commodities broadly, but oil’s supply/demand story still matters more.
Disclaimer:
This analysis is for informational and educational purposes only and does not constitute financial advice, investment recommendation, or an offer to buy or sell any securities. Asset prices, valuations, and performance metrics are subject to change and may be outdated. Always conduct your own due diligence and consult with a licensed financial advisor before making investment decisions. The information presented may contain inaccuracies and should not be solely relied upon for financial decisions. I am not a licensed financial advisor or professional trader. I am not personally liable for your own losses; this is not financial advice.

Crude Oil – Sell around 58.50, with a target of 56.00-55.00Crude Oil Market Analysis:
Recent crude oil buying has been largely ineffective. Despite support from fundamentals and data, there has been little upward movement, only small fluctuations. Sell crude oil at 58.50 today. The chart pattern indicates short-term consolidation, with resistance around 60.00. A break above 62 might open new buying opportunities; otherwise, the outlook remains bearish.
Fundamental Analysis:
The previous ADP employment data has reassured the market, and expectations for the non-farm payrolls report have largely been priced in.
Trading Recommendation:
Crude Oil – Sell around 58.50, with a target of 56.00-55.00.

Sell crude oil around 58.50, with a target of 57.00-55.00Crude Oil Market Analysis:
Recent crude oil data and fundamentals support buying opportunities, but crude oil is still slowly declining. The outlook remains bearish today; sell on rallies. Watch the minor resistance level at 58.50. A break below 55.00 would open up further downside potential. If this level is broken, consider selling.
Fundamental Analysis:
Yesterday's ADP employment data was -2.9, compared to an expected 4.7 and a result of 4.1. While this appears bullish in the short term, it actually signals a sell opportunity. Good employment data tends to cause gold to fall. Crude oil's EIA inventory data also fell to -338, compared to an expected 44.
Trading Recommendation:
Sell crude oil around 58.50, with a target of 57.00-55.00.

Crude OilU.S Oil
- Sell Side Liquidity
- Break of Structure
- Bearish Channel as an corrective pattern in Short Time Frame
- Fair Value Gap
- IDM
- Order Block

Venezuela regime change could mean more barrels, not fewerHeadline risk would indicate that there will be chaos in the oil market after the invasion of Venezuela and the extraction of its dictator to the US over the weekend.
But markets had already begun pricing in Venezuela related disruption. And estimates put Venezuelan output at roughly around one million barrels per day, which is under 1 percent of global production, and exports have been closer to about half of that in recent weeks.
That helps explain why the oil move could be limited to the upside.
There is also a scenario where prices ease rather than surge. A regime change raises the possibility of higher Venezuelan production over time if sanctions and investment constraints are relaxed. Trump has said major U.S. oil companies will begin to invest billions to restore output. At present, Chevron is the only major U.S. company operating in Venezuela under a special license.

XOM: Winners of the Venezuelan Oil-Poker!Hello There,
in the past days we have witnessed spectacular events that will be historically determining for the oil market and oil company stocks. One of the largest oil reserves country Venezuela changed from a socialist government to a state under U.S. influence. Since the government changed the plan is that oil companies can take up their business again, which was not possible before. As Venezuela has one of the largest oil reserves, this could mean massive changes for those companies.
One of those companies is ExxonMobil (XOM). The company already had big plans to expand their oil production before 2007. Since 1999, the Venezuelan government has begun expropriating private businesses and, in the majority, oil companies. This also led to the seizure of ExxonMobil in 2007, where thousands of millions of barrels of oil were expropriated into government control. The company has had no ability to get their reserves and continue their businesses in Venezuela since then.
As a government change happens in Venezuela, this will create major bullish foundations for XOM. The price already gained over 300% in a continuous uptrend since the corona pandemic in 2020. A potential continuation of their business will likely expand their revenues by up to 40% more. Such factors will have tremendous effects on the price action. As seen in my chart, XOM will likely complete this gigantic bull flag in the next time.
Already before this major event, XOM could complete this gigantic broadening wedge formation. The targets of this formation were already confirmed by the breakout. Now the bull flag formation forming above the upper boundary offers the next double confirmational formation. From this point of view this creates a fundamentally and technically bullish perspective for XOM. The targets marked in my chart are already active. When there are massive news in the oil industry there is a high likelihood for major price moves.
With this being said, it is great to consider the important trades upcoming.
We will watch out for the main market evolutions.
Thank you very much for watching!

Crude OilU.S Oil
- Symmetrical Triangle as an corrective pattern in Long Time Frame
- Break of Structure
- Impulse Correction
- Demand Zone
- Change of Characteristics

Wti on high time frame
1. **Fundamental Analysis**: Given the current economic situation and tensions, particularly the conflict between the USA and Venezuela, I expect oil prices to rise.
2. **Technical Signals**: Technical analysis supports my expectations, indicating a favorable outlook for price movement.
3. **Price Target**: I anticipate that WTI could break through the $64 level.
4. **Risk Management**: Emphasizing the importance of good risk management while trading.
If you need further insights or a specific aspect analyzed, feel free to ask!

Crude Oil – Sell around 58.90, target 57.00-56.00Crude Oil Market Analysis:
The recommended strategy for today is to sell crude oil. Recent crude oil price fluctuations have been relatively small, and the fluctuations are mostly within a consolidation phase. The recommended strategy is to sell, as chasing this range-bound market is not advisable. Wait for a rebound to a higher point before considering selling. Today, pay attention to the levels around 58.90 and 59.50.
Fundamental Analysis:
These past few days have been a holiday, with few major data releases. However, the escalating US-Venezuela relations and the worsening Russia-Ukraine situation are providing short-term geopolitical support, significantly benefiting gold prices.
Trading Recommendation:
Crude Oil – Sell around 58.90, target 57.00-56.00

Crude Oil – Sell around 59.20, target 56.00-55.00Crude Oil Market Analysis:
Crude oil has started a slight rebound, but it hasn't broken through the 55 level effectively. Today's strategy remains to sell on rallies and be bearish. Continue selling on rallies. Resistance for crude oil is around 59.20; consider selling near that level. If crude oil breaks above 59, it indicates a return to a consolidation phase. The recent escalation of the Russia-Ukraine conflict is supporting buying opportunities in crude oil.
Fundamental Analysis:
The Russia-Ukraine conflict shows signs of escalation again, providing some support for gold. Pay attention to the holiday situation in the next few days.
Trading Recommendation:
Crude Oil – Sell around 59.20, target 56.00-55.00

Crude Oil – Sell around 58.40, target 56.00-55.00Crude Oil Market Analysis:
The daily chart for crude oil continues to show a bearish trend. Sell on rallies. In the Asian session, watch for a short position around 58.40, which acts as minor resistance. A stronger resistance level is around 59.60. The overall trend for crude oil is bearish, with short-term consolidation expected. Recent data releases have had limited impact on crude oil.
Fundamental Analysis:
The recent rise in gold prices is no longer significantly related to data releases. It's essentially a long-awaited breakout from a high level after a period of consolidation. The previously released bullish data was merely a catalyst, and the upcoming days are filled with European and American holidays.
Trading Recommendation:
Crude Oil – Sell around 58.40, target 56.00-55.00
