New Analysis – West Texas Oil (WTI)Those who follow my work know that we have posted multiple oil analyses in a row,
all of them successful, closed with high reward ratios ✅
But let me be very clear:
❌ I’m not part of OPEC
❌ I’m not a politician
❌ I don’t have access to political or economic decisions
No one knows what’s really going on in Powell’s mind,
what Trump plans to do with Iran,
or what the future holds for Venezuela, Cuba, or others.
📌 These are market drivers,
but we have zero access to policymakers’ decision rooms.
We are simply small traders,
trying to extract profits from opportunities — nothing more.
🔎 In this analysis, after making solid profits,
I’m willing to risk a small portion of those gains.
This setup carries higher risk, and that’s fully intentional.
📉 At the moment,
we are sitting at a good area to sell oil.
🔁 If this level breaks,
as always,
I’ll wait for a pullback and look for a long position.
🎯 No bias, no predictions — just following the market.
🌹 Stay safe & stay profitable
Oiltrading

Crude Oil (USOIL) OutlookTechnical Analysis: USOIL (Crude Oil)
Feb 11, 2026
Pivot Point: 63.85 The price is currently trading and stabilizing above the 63.85 level, which maintains a positive outlook for the session.
Bullish Scenario (Primary)
As long as the price remains sustained above the pivot point of 63.85, the momentum is bullish:
First Target: Reaching the resistance level at 64.90.
Second Target: A successful breakout above this level will clear the path toward 65.20.
Bearish Scenario (Alternative)
If the price pulls back and closes firmly below the 63.85 pivot point (specifically on the hourly timeframe):
The trend will shift to negative/bearish.
Downside Target: A break below the pivot will target the next support level at 62.65.
Summary:
Above 63.85: Momentum is strongly Bullish.
Below 63.85: Trend shifts to Bearish.

USOIL Daily Update: Primary Targets and Key Pivot LevelsTechnical Analysis: USOIL (Crude Oil) – 10/2/2026
Pivot Point: 63.85 Based on current price action, the price has successfully stabilized above this level. This indicates buying pressure and a directional shift toward a bullish trend.
Bullish Scenario (Primary)
As long as the price remains and trades above the pivot point of 63.85, the trend is upward:
First Target: Reaching the resistance level at 64.65.
Second Target: If the price breaks above this resistance, it is expected to advance toward 65.20.
Bearish Scenario (Alternative)
If the price pulls back and closes firmly below the 63.85 pivot point (specifically on the hourly timeframe):
The outlook will turn negative, with the first target being 62.40.
If this support is broken, the price may drop further toward 61.40.
Summary:
Above 63.85: Momentum is strongly Bullish.
Below 63.85: Trend shifts to Bearish.

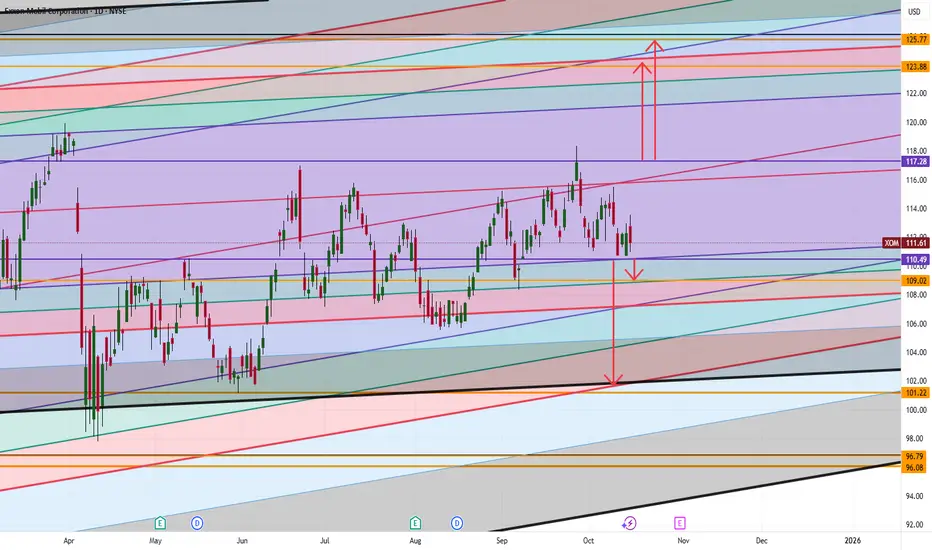
Exxon Mobil (XOM) Simple Market Breakdown!XOM’s sitting at a key level right now; momentum could go either way depending on the next breakout ⚡
Here’s what I’m watching:
📈 If we break above 117.28, that could open the door for a push up toward 123–125; that’s our next major target zone.
📉 But if we drop below 110.49, then we could see a move down toward 109, and possibly even 101 if selling pressure continues.
💡 So, short-term watch those breakout and breakdown levels closely.
Long-term ; whichever side breaks first will likely set the direction for the next big move.
Want to see how I’m tracking these levels and the signals I’m using to confirm the breakout?
💬 DM me “XOM” and I’ll share my private chart breakdown directly.
Oil Price at a Crossroads: Will the 63.45 Support Hold ?
📊 USOIL (WTI) Technical Analysis - Feb 6, 2026
📍 Pivot Point: 63.45 The price is currently hovering around the pivot level, which serves as the decisive zone for the next market trend.
📉 Bearish Scenario (Primary Outlook)
As long as the price remains below the pivot point of 63.45, the bearish momentum is expected to dominate:
🎯 Target 1: A drop toward the first support at 62.40.
🎯 Target 2: A breakout below 62.40 will push the price further down to the 61.40 zone.
📈 Bullish Scenario (Alternative Outlook)
If the price manages to break above the 63.45 pivot and stabilizes, the trend will shift to bullish:
🚀 Target 1: A recovery toward the resistance level at 64.65.
🚀 Target 2: Breaking above 64.65 will pave the way for 65.20 and potentially 65.95.
🔍 Key Takeaways:
Below 63.45: The trend remains Bearish.
Above 63.45: The trend shifts to Bullish.

Brent Oil Setup: Pre-Talks Correction ScenarioBrent Crude OIL ( FX_IDC:USDBRO ), over the past two months, has been rising due to escalating tensions in the Middle East and the potential for conflict between Iran and the U.S. If these tensions materialize, global oil supply could be impacted—especially given the significance of the Strait of Hormuz.
In the past 48 hours, however, news emerged that Iran-U.S. negotiations are set for Friday at 10 a.m. local time in Muscat, Oman, rather than Istanbul. If these talks yield positive results, oil prices may fall due to reduced tensions. Conversely, if talks fail, oil could spike again. Until then, we can rely on technicals for short-term opportunities.
Let’s quickly check Brent oil’s 4-hour chart. Brent has been in an ascending channel over the past 60 days and is currently near a resistance zone($71.30-$68.00).
From an Elliott Wave perspective, Brent seems to have completed a 5-wave impulse within the ascending channel. We can now anticipate a corrective wave.
I expect Brent oil to decline before the talks, potentially dropping to around $66.40. If agreement is reached, we could see a break of the lower channel line, with prices heading toward $63.64.
First Target: $66.40
Second Target: $63.64
Stop Loss(SL): $61.00(Worst)
Points may shift as the market evolves
💡 Please respect each other's opinions and express agreement or disagreement politely.
📌U.S. Dollar/Brent Crude OIL Analysis (USDBRO), 4-hour time frame.
🛑 Always set a Stop Loss(SL) for every position you open.
✅ This is just my idea; I’d love to see your thoughts too!
🔥 If you find it helpful, please BOOST this post and share it with your friends.

USOIL at the Edge: The 63.45 Battleground USOIL (WTI)
Date: February 5, 2026
💵 Current Status: Neutral / Testing Pivot
Pivot Point: 63.45
The price is currently hovering directly on the 63.45 pivot level. This is a "Make or Break" zone. We are waiting for a decisive candle close to confirm the next direction.
📉 Bearish Outlook (Current Pressure)
The overall sentiment has shifted toward the downside due to easing geopolitical tensions.
Condition: A sustained trade below 63.45.
Target 1: 62.90 (Immediate Support).
Target 2: 62.10 (Major Support / Extension).
📈 Bullish Outlook (Recovery)
For the bulls to regain control, the price must reclaim the pivot and stabilize.
Condition: A 1-hour candle close above 64.00.
Target 1: 64.65 (Previous Resistance).
Target 2: 65.20 - 65.95.
📰 Market Drivers (The Why?)
Diplomatic Breakthrough: Reports of direct U.S.-Iran talks in Oman have significantly reduced the "Risk Premium." Traders are less worried about supply disruptions in the Middle East.
EIA Inventory Data: While U.S. crude stocks fell by 3.5M barrels (typically bullish), the market is ignoring this data in favor of the bearish political news and the strong U.S. Dollar.
Fed Caution: A stronger Dollar, fueled by the Federal Reserve's cautious stance on rate cuts, continues to weigh on oil prices.
🔍 Conclusion
We are in a "Wait and See" phase. If the price fails to bounce from 63.45 within the next few hours, we expect the bearish momentum to accelerate toward 62.10.
Trade safe and watch for the breakout.

US OIL: Bullish! Buy The Dip!In this Weekly Market Forecast, we will analyze the US OIL for the week of Feb. 2-6th
US Crude Oil had a bullish close last week, sweeping the Sept high. I am expecting the bullish momentum to continue into this week.
Expect a pullback into discount of the range before the market pushes higher.
Enjoy!
May profits be upon you.
Leave any questions or comments in the comment section.
I appreciate any feedback from my viewers!
Like and/or subscribe if you want more accurate analysis.
Thank you so much!
Disclaimer:
I do not provide personal investment advice and I am not a qualified licensed investment advisor.
All information found here, including any ideas, opinions, views, predictions, forecasts, commentaries, suggestions, expressed or implied herein, are for informational, entertainment or educational purposes only and should not be construed as personal investment advice. While the information provided is believed to be accurate, it may include errors or inaccuracies.
I will not and cannot be held liable for any actions you take as a result of anything you read here.
Conduct your own due diligence, or consult a licensed financial advisor or broker before making any and all investment decisions. Any investments, trades, speculations, or decisions made on the basis of any information found on this channel, expressed or implied herein, are committed at your own risk, financial or otherwise.

US OilCrude Oil
- Completed " 12345 " Impulsive Waves
- Break of Structure
- RSI - Divergence
- Double Bottom as an corrective pattern in Short Time Frame
- Fibonacci Level - 61.80% / 78.60%

Possible Bullish Uptrend channel OIL Price Next Months According to Fundamental Geopolitics events
According to Risk of World War
According to technical analysis, the end of the corrective wave is at the 50-60% Fibonacci retracement.
Convergence on CCI

Middle East Risks Keep Brent Oil Bullish — Higher TargetsAs I expected in the previous idea , Brent Crude OIL( BLACKBULL:BRENT ) has risen and reached its targets, with a Risk-To-Reward: 2:01 (full target).
Brent Crude OIL is currently trading near the support zone($63.30-$62.00) and the support lines.
From an Elliott Wave perspective, it appears that Brent Crude OIL has completed main wave 4, and we can now expect the next impulsive wave for the main wave 5.
Additionally, news from the Middle East does not indicate a reduction in tensions, and we can expect potential surprises in the region. Therefore, I prefer to maintain long positions in Brent Crude OIL rather than short positions, and I’m looking for triggers to enter long.
I expect that Brent Crude OIL will once again target the resistance zone($66.80-$65.00) and potentially rise to around $66.47. The next target could be the yearly pivot point($67.30).
First Target: $66.47
Second Target: $67.30
Stop Loss(SL): $62.60
Points may shift as the market evolves
💡 Please respect each other's opinions and express agreement or disagreement politely.
📌U.S. Dollar/Brent Crude OIL Analysis (USDCAD), 4-hour time frame.
🛑 Always set a Stop Loss(SL) for every position you open.
✅ This is just my idea; I’d love to see your thoughts too!
🔥 If you find it helpful, please BOOST this post and share it with your friends.

Crude Oil (WTI): Short-Term Bullish Correction Before BearishHI!
Looking at the 4H chart for US Crude Oil (WTI), the price action suggests a short-term corrective rally before a continuation of the bearish trend. Below are the key levels and potential scenarios:
Key Levels:
Resistance Area (Green Zone): Currently, oil is approaching a key resistance level near the green zone. This area is expected to act as a strong resistance, potentially halting the recent bullish move and triggering a retracement. A rejection here could lead to a decline back toward lower levels, aligning with the overall bearish trend.
Magnet Area (Blue Zone): The blue zone represents the next critical support level, where price could be "magnetically" pulled towards after testing the resistance area. This zone marks a significant support region, aligning with the ascending trendline, which indicates further downside potential should the price break lower.
Target: $57.4
Geopolitical Considerations:
Ongoing geopolitical concerns, such as tensions in the Middle East, could introduce volatility and affect the price action in the short term. Any sudden shifts in supply expectations could influence the bullish or bearish potential around these key levels.
Disclaimer: As part of ThinkMarkets’ Influencer Program, I am sponsored to share and publish their charts in my analysis.

Oil is Boiling! 1/23/2026
After CRYPTOCAP:BTC ’s big run to $126K (now cooling off in corrective mode), Silver and Gold are pushing into new highs and closing in on their projected targets. Meanwhile, Oil popped +2.45% today and the chart is heating up — technically it looks primed for a major upside move.
With rising geopolitical tensions in the Middle East, the energy market is getting extra fuel.
Historically, geopolitical shocks have been one of the strongest catalysts for sharp Oil price swings — more than almost any other factor.
Momentum is shifting fast across the board… the next big rotation could be explosive!
Happy Trading!

OILUSD : Higher Timeframe Bias vs Short-Term ReactionMonthly & Weekly structure remain bearish.
The current upside move appears driven by short-term geopolitical narratives, not a structural shift
I’m not chasing price
Key area of interest:
Daily FVG
4H FVG
iFVG
If price trades into this premium zone I’ll look for sell confirmation aligned with HTF bias

Bullish momentum to extend?WTI Oil (XTI/USD) could make a short-term pullback to the pivot, which acts as an overlap support and could bounce to hr 1st resistance.
Pivot: 58.70
1st Support: 56.94
1st Resistance: 61.58
Disclaimer:
The opinions given above constitute general market commentary and do not constitute the opinion or advice of IC Markets or any form of personal or investment advice.
Any opinions, news, research, analyses, prices, other information, or links to third-party sites contained on this website are provided on an "as-is" basis, are intended to be informative only, and are not advice, a recommendation, research, a record of our trading prices, an offer of, or solicitation for, a transaction in any financial instrument and thus should not be treated as such. The information provided does not involve any specific investment objectives, financial situation, or needs of any specific person who may receive it. Please be aware that past performance is not a reliable indicator of future performance and/or results. Past performance or forward-looking scenarios based upon the reasonable beliefs of the third-party provider are not a guarantee of future performance. Actual results may differ materially from those anticipated in forward-looking or past performance statements. IC Markets makes no representation or warranty and assumes no liability as to the accuracy or completeness of the information provided, nor any loss arising from any investment based on a recommendation, forecast, or any information supplied by any third party

Brent Oil Breaks Resistance as Middle East Tensions EscalateWith the start of the new week, Brent Oil( BLACKBULL:BRENT ) has continued its bullish trend.
Given the escalating tensions in the Middle East, a region that is crucial for global oil production, oil prices have risen accordingly.
Brent Oil has successfully broken through the resistance zone($63.30-$62.00) and resistance lines and is currently completing a pullback to these levels.
I expect that, given the potential for renewed tensions in the Middle East in the coming days and hours, the bullish trend in oil will continue, supported by both fundamental and technical analysis, and it will reach the targets set in the chart.
First Target: $64.91
Second Target: $65.77
Stop Loss(SL): $62.07
Points may shift as the market evolves
💡 Please respect each other's opinions and express agreement or disagreement politely.
📌U.S. Dollar/Brent Crude OIL Analysis (USDCAD), 4-hour time frame.
🛑 Always set a Stop Loss(SL) for every position you open.
✅ This is just my idea; I’d love to see your thoughts too!
🔥 If you find it helpful, please BOOST this post and share it with your friends.

Where Is Oil Heading To ? - /CL Analysis 1) Technical Perspective: Support & Resistance
~$65 was a support zone earlier (2021–2024). In 2025–26, that $65 area now often acts as resistance. Prices have come down toward $55
2) Fundamental Drivers Behind the Downtrend
Oil has been in a multi-year decline from the highs seen in 2022 after the Russia–Ukraine war spike. A combination of oversupply and weaker demand has kept price pressure on:
• 2025 saw a large annual price drop due to persistent oversupply and slow demand.
• EIA and IEA reports project global oil supply continuing to exceed demand into 2026.
This structural oversupply (positive global inventories) pushes the short-term bias lower unless demand surprises on the upside.
3) Geopolitical Drivers — Including Venezuela
Recent news confirms that geopolitics remain a key wild card: The U.S. has taken actions around Venezuelan oil assets and plans to export Venezuelan crude, which could add supply and weigh on prices, especially if revitalisation occurs. Oil prices did tick up short-term on inventory draws and Venezuela focus, but long-term gains from Venezuelan production may be limited because infrastructure will take years to rebuild. Geopolitical tensions can spike oil temporarily, but unless supply physically tightens, the structure stays bearish.
4) OPEC / OPEC+ Decisions
OPEC’s recent behaviour has been a big driver:
In 2025, OPEC+ unwound production cuts, which contributed to oversupply and lower prices.
For 2026: The OPEC+ view has shifted toward equilibrium, but global supply growth still challenges prices. If OPEC+ cuts output further or extends cuts, prices could find stronger support around current levels ($55–$65). If OPEC+ maintains or increases production while demand stays soft, that supports a drop toward $45–$50. So OPEC policy is one of the most important catalysts, it fundamentally shifts supply.
5) Demand Risks & Macro Conditions
Global demand remains under pressure: Chinese economic weakness and slower global growth reduce oil demand. And EIA forecasts oversupply growth in 2026.
Lower demand growth + abundant supply = structural downside risk.
6) Link to US Dollar, Inflation & Rates
Higher real rates / stronger USD → oil tends to weaken:
Oil is USD-denominated. A stronger dollar makes oil more expensive for holders of other currencies. Tight monetary policy (higher rates) can slow economic growth and demand for oil.
Lower real rates / weaker USD → oil tends to strengthen: Cheaper USD can support crude prices if demand fundamentals improve.
Right now, with US economic strength and mixed inflation data elsewhere, it’s not certain the Fed will aggressively cut. If inflation re-accelerates and the Fed resists rate cuts or even raises, that could strengthen the USD and pressure oil lower.
However, if the Fed eases later, weaker real rates could help commodities broadly, but oil’s supply/demand story still matters more.
Disclaimer:
This analysis is for informational and educational purposes only and does not constitute financial advice, investment recommendation, or an offer to buy or sell any securities. Asset prices, valuations, and performance metrics are subject to change and may be outdated. Always conduct your own due diligence and consult with a licensed financial advisor before making investment decisions. The information presented may contain inaccuracies and should not be solely relied upon for financial decisions. I am not a licensed financial advisor or professional trader. I am not personally liable for your own losses; this is not financial advice.

WTI M15 Bullish Continuation After H1 FVG Hold📝 Description
WTI crude remains in a strong short-term bullish structure on M15 after an impulsive expansion. Price has pulled back in a controlled manner and is holding above the H1 FVG / BPR zone, suggesting this move is a healthy retracement, not distribution. The higher lows indicate continuation potential rather than exhaustion.
________________________________________
📈 Signal / Analysis
Primary Bias: Bullish
Preferred Setup:
• Entry (Buy): 58.03
• Stop Loss: Below 57.8
• TP1: 58.36
• TP2: 58.60
• TP3: 58.75
Acceptance below the H1 FVG invalidates the bullish continuation idea.
________________________________________
🎯 ICT & SMC Notes
• Clean impulsive leg followed by corrective pullback
• Price respecting H1 FVG + BPR as demand
• No bearish CHOCH on LTF
________________________________________
🧩 Summary
WTI is consolidating above a key HTF demand zone after a strong markup. As long as price holds above the H1 FVG, the market favors continuation toward upside liquidity rather than deeper retracement.
________________________________________
🌍 Fundamental Notes / Sentiment
Oil sentiment remains supported by steady demand expectations and ongoing geopolitical sensitivity. With no immediate bearish catalyst and technical structure aligned, price action favors trend continuation, especially according to geopolitical situation in in Iran and Venezuela.
________________________________________
⚠️ Risk Disclosure
Trading involves substantial risk and may result in capital loss. This analysis is for educational purposes only and does not constitute financial advice. Always apply proper risk management, predefined stop-loss levels, and disciplined position sizing aligned with your trading plan.

Crude Oil – Sell around 58.50, with a target of 56.00-55.00Crude Oil Market Analysis:
Recent crude oil buying has been largely ineffective. Despite support from fundamentals and data, there has been little upward movement, only small fluctuations. Sell crude oil at 58.50 today. The chart pattern indicates short-term consolidation, with resistance around 60.00. A break above 62 might open new buying opportunities; otherwise, the outlook remains bearish.
Fundamental Analysis:
The previous ADP employment data has reassured the market, and expectations for the non-farm payrolls report have largely been priced in.
Trading Recommendation:
Crude Oil – Sell around 58.50, with a target of 56.00-55.00.

Sell crude oil around 58.50, with a target of 57.00-55.00Crude Oil Market Analysis:
Recent crude oil data and fundamentals support buying opportunities, but crude oil is still slowly declining. The outlook remains bearish today; sell on rallies. Watch the minor resistance level at 58.50. A break below 55.00 would open up further downside potential. If this level is broken, consider selling.
Fundamental Analysis:
Yesterday's ADP employment data was -2.9, compared to an expected 4.7 and a result of 4.1. While this appears bullish in the short term, it actually signals a sell opportunity. Good employment data tends to cause gold to fall. Crude oil's EIA inventory data also fell to -338, compared to an expected 44.
Trading Recommendation:
Sell crude oil around 58.50, with a target of 57.00-55.00.

Crude Oil – Sell around 58.60, target 56.00-55.00Crude Oil Market Analysis:
The fundamentals have had a significant impact on crude oil over the past two days, but crude oil seems to have become desensitized to these fundamentals, showing little reaction. The market is maintaining a relatively calm, small-scale consolidation. Our strategy for today remains bearish; sell on rallies. The daily moving averages are starting to diverge. For buying opportunities, pay attention to the 55.00 level. If it breaks, we expect a significant sell-off.
Fundamental Analysis:
Today, we will focus on the ADP employment data and the EIA crude oil inventory data.
Trading Recommendation:
Crude Oil – Sell around 58.60, target 56.00-55.00

Potential bearish drop?USO/USD is reacting off the support level, which is an overlap support and could drop from this level to our take profit.
Entry: 57.89
Why we like it:
There is an overlap support level.
Stop loss: 58.43
Why we like it:
There is a pullback resistance level.
Take profit: 56.82
Why we like it:
There is a multi-swing low support level.
Enjoying your TradingView experience? Review us!
Please be advised that the information presented on TradingView is provided to Vantage (‘Vantage Global Limited’, ‘we’) by a third-party provider (‘Everest Fortune Group’). Please be reminded that you are solely responsible for the trading decisions on your account. There is a very high degree of risk involved in trading. Any information and/or content is intended entirely for research, educational and informational purposes only and does not constitute investment or consultation advice or investment strategy. The information is not tailored to the investment needs of any specific person and therefore does not involve a consideration of any of the investment objectives, financial situation or needs of any viewer that may receive it. Kindly also note that past performance is not a reliable indicator of future results. Actual results may differ materially from those anticipated in forward-looking or past performance statements. We assume no liability as to the accuracy or completeness of any of the information and/or content provided herein and the Company cannot be held responsible for any omission, mistake nor for any loss or damage including without limitation to any loss of profit which may arise from reliance on any information supplied by Everest Fortune Group.

WTI: Politics Just Entered the ChartLadies and gentlemen, if you're trading oil (WTI) right now, you're probably in one of the most sensitive periods of your trading life. Why? Trump just arrested Venezuela's leader a few days ago :) Odds of a strike on Iran are sky-high, Israel could jump in too + a ton of other factors that could spike massive volatility in the oil market over the next few weeks and make trading it brutal.
Let's break it down together.
Daily timeframe
We've got a super strong downward channel for ages, with most action hugging the upper side and midline—barely touching the channel floor in forever. Today's candle is straight-up engulfing the last three weak bearish ones to the upside, and with all the tension building, expect a sharp uptrend move soon.
Drop to 4H for real long/short triggers.
Short side: Killer trigger on break of support 56.463—it's held with strong reactions before. If it snaps, look for midline retest first, then channel floor test.
Long side: Riskier trigger at 58.731 break—could kick off the upside correction of this bearish channel. But since it'd be the first uptrend leg, keep risk low.
By the way, I’m Skeptic , founder of Skeptic Lab.
I focus on long-term performance through psychology, data-driven thinking, and tested processes.
Thanks for riding this idea—if it delivered value, hit that boost to keep the momentum rolling and follow to build the squad. Toss any symbol you want dissected in the comments, I'll handle it. 🩵
Now get outta here.
