CRCL Top 10 Pick for 2026: Positioned for the Digital Dollar EraCRCL has been on my radar as one of my top 10 picks for 2026, and recent market activity only strengthens my conviction.
Toward year-end expirations, I observed fairly aggressive out-of-the-money call buying on CRCL. This isn’t random speculation—it suggests that traders are positioning for a potential catalyst, and it aligns with my long-term view of the company.
CRCL is closely associated with USDC, and there are strong indications that the company could play a role in the development of a blockchain-based digital dollar.
The implications of such a development are enormous!
A digital dollar wouldn’t just be a novel financial product—it could serve as a tool for inflation stabilization, monetary efficiency, and global transactional utility.
Over time, such an innovation may evolve from optional curiosity into a global necessity.
The aggressive positioning in calls, particularly out-of-the-money, reflects the market’s anticipation of a significant event or series of events.
Traders are effectively expressing confidence that CRCL’s narrative could materialize in a meaningful way over the next few quarters.
For investors, this creates a favorable risk/reward dynamic, especially considering the broader structural trends in digital currencies, blockchain adoption, and the push for a regulated digital dollar.
Of course, execution remains critical. CRCL must navigate regulatory hurdles, competition, and technological complexity.
But when you combine these risks with the potential upside of being a first-mover in the digital dollar ecosystem, the reward profile becomes compelling.
In my view, CRCL represents a rare convergence of market timing, structural trends, and optionality.
With bullish sentiment already showing up in the options market, and the broader narrative of a blockchain-based dollar gaining traction, CRCL is a stock that could surprise materially in 2026.
Optionstrader

CLOV: Heavy Put Activity Suggests Possible Downside by FridayClover Health (CLOV) has seen unusually heavy bearish options flow in the past week, with traders aggressively loading up on put options expiring this Friday (January 23, 2026).
Volume on the $2 and $2.50 strikes alone exceeded 132,000 contracts on January 16 – a +240% surge over average daily levels – indicating strong conviction for downside pressure in the very short term.
At current levels around $2.54, the stock is already showing signs of weakness after a recent pullback from $2.81.
With these massive put positions piling up, many traders appear to be hedging or outright betting on a drop below $2.50 (or even lower) before weekly expiration.
If momentum continues to fade or if no positive catalyst emerges, we could easily see a sharp selloff into Friday, potentially driving CLOV toward $2.20–$2.30 or lower as these puts go in-the-money and gamma works against the bulls.
I expect increased selling pressure and possible downside volatility on CLOV through the end of this week.

$SPY Broken Structure or Just a Retest before Continuation?AMEX:SPY Daily loss Support after gap down with 2-2-2d reveresal.
Please see recording for details.

DIXON | Weekly Bearish Options Setup | Jan ExpiryTrade Idea
• Sell 12,500 CE
• Buy 13,000 CE
• Defined-risk bear call spread
Why this setup works
DIXON NSE:DIXON has broken below the mid-band and is trading under key short-term moving averages. The recent bounce attempt near the upper band was sold into, confirming supply at higher levels.
Momentum is weak, RSI is slipping below the mid-zone, and price is now making lower highs on the weekly chart. As long as DIXON stays below the 12,600–12,700 resistance zone, upside looks capped.
With steady IV, call spreads offer a clean risk-defined way to express this view.
View
Moderately bearish — expecting DIXON to stay below resistance and drift sideways to lower levels.
This post is for education only. It’s not financial advice or a recommendation to trade.
#WeeklyOptions
#BearishSetup
#DIXON
#OptionsTradingIndia
#BearCallSpread
#ThetaDecay
#NSEOptions

KBH KB Home Options Ahead of EarningsIf you haven`t sold KBH before the previous earnings:
Now analyzing the options chain and the chart patterns of KBH KB Home prior to the earnings report this week,
I would consider purchasing the 45usd strike price Puts with
an expiration date of 2026-12-18,
for a premium of approximately $2.00.
If these options prove to be profitable prior to the earnings release, I would sell at least half of them.

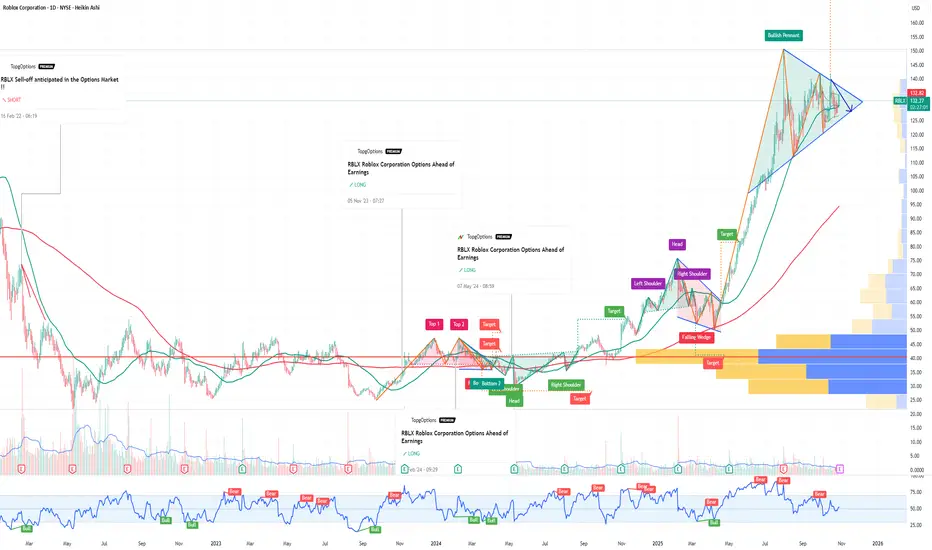
RBLX Roblox Corporation Options Ahead of EarningsIf you haven`t bought RBLX before the rally:
Now analyzing the options chain and the chart patterns of RBLX Roblox Corporation prior to the earnings report this week,
I would consider purchasing the 130usd strike price Puts with
an expiration date of 2026-1-16,
for a premium of approximately $13.80.
If these options prove to be profitable prior to the earnings release, I would sell at least half of them.
EH EHang Holdings Limited Options Ahead of EarningsAnalyzing the options chain and the chart patterns of EH EHang Holdings Limited prior to the earnings report this week,
I would consider purchasing the 22usd strike price Calls with
an expiration date of 2026-4-17,
for a premium of approximately $0.48.
If these options prove to be profitable prior to the earnings release, I would sell at least half of them.

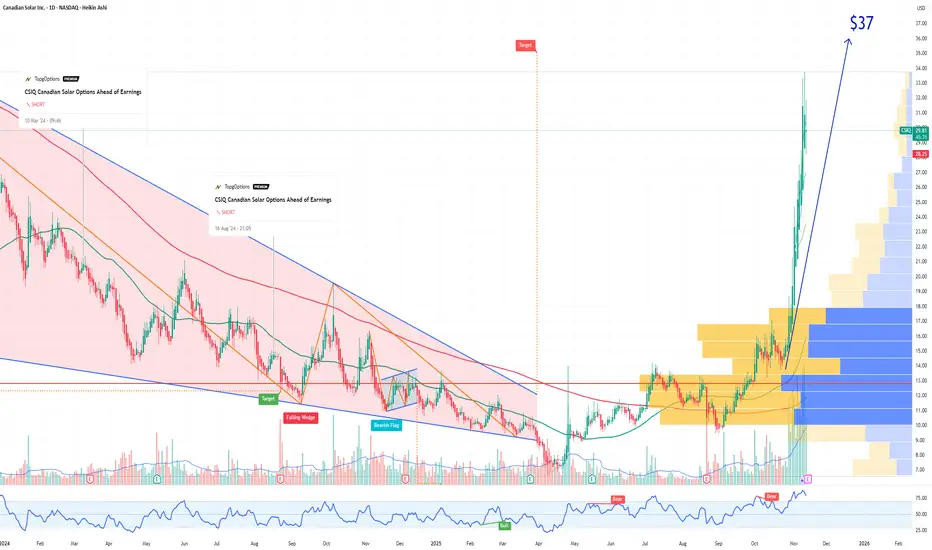
CSIQ Canadian Solar Options Ahead of EarningsIf you haven`t sold CSIQ before the previous earnings:
Now analyzing the options chain and the chart patterns of CSIQ Canadian Solar prior to the earnings report this week,
I would consider purchasing the 37usd strike price Calls with
an expiration date of 2026-4-17,
for a premium of approximately $4.75.
If these options prove to be profitable prior to the earnings release, I would sell at least half of them.
SLS SELLAS Life Sciences Group Options Ahead of EarningsAnalyzing the options chain and the chart patterns of SLS SELLAS Life Sciences Group prior to the earnings report this week,
I would consider purchasing the 3.50usd strike price Calls with
an expiration date of 2027-1-15,
for a premium of approximately $0.52.
If these options prove to be profitable prior to the earnings release, I would sell at least half of them.

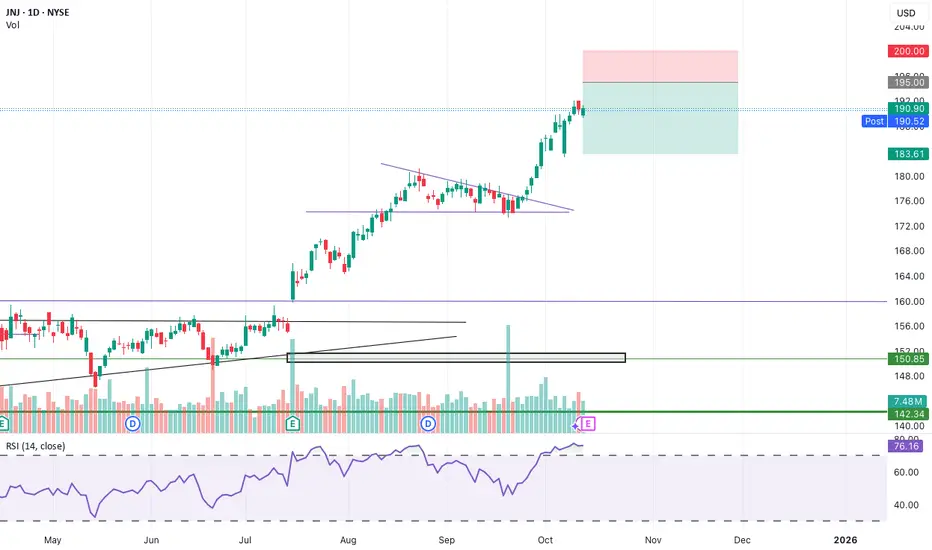
Bear Call Spread on JNJBear Call Spread Sell 195 Call strike and Buy 200 Call Strike, Exp: Nov 28 (45 DTE) for no less than $1.55
Trade has about 67% probability of profit
Taking advantage of high IV rank of 40
Credit received = $155
BP Effect = $345
Max Loss = (5 - 1.55) * 100 = $345
Breakeven = 195 + 1.55 = $196.55
Percentage return: (155 / 345) * 100 =44.928%
Exit Target: 40% - 70% of Credit received ($62 - $108.50)
Stop-loss: close if price threatens the short strike and cost to buy back exceeds 50% of max loss or predefined dollar loss,
Exit no later than 7 days before expiration
JNJ has seen a significant rise and it at ATH, RSI indicator also shows JNJ being overbought
Trade is just for educational purposes and willing to learn consistent option trading
VKTX Viking Therapeutics Options Ahead of EarningsIf you haven`t bought VKTX before the rally:
Now analyzing the options chain and the chart patterns of VKTX Viking Therapeutics prior to the earnings report this week,
I would consider purchasing the 60usd strike price Calls with
an expiration date of 2027-12-17,
for a premium of approximately $11.05.
If these options prove to be profitable prior to the earnings release, I would sell at least half of them.

NOK Nokia Options Ahead of EarningsAnalyzing the options chain and the chart patterns of NOK Nokia prior to the earnings report this week,
I would consider purchasing the 5.50usd strike price Calls with
an expiration date of 2025-11-21,
for a premium of approximately $0.34.
If these options prove to be profitable prior to the earnings release, I would sell at least half of them.

The Options Mirage: The Jackpot That’s Rigged Against YouMost retail traders fall in love with options because they seem to offer the impossible: with just a few hundred dollars you can dream of outsized returns. Fast money, easy money—at least that’s the story. With the right broker account and a handful of trades, the dream of becoming rich feels just around the corner.
What you’re not told—and what few truly understand given the complexity of the product—is that the “explosive payout” is not an opportunity. It’s a price. A very high one. And often inflated by the industry itself, knowing that the average investor (or rather, gambler) has no real way to calculate what they’re actually paying for. What you’re really buying is access to an extremely low probability of success, dressed up as a sophisticated strategy.
Yes, it’s the same psychology that drives lotteries and sports betting. And in finance, the odds aren’t any kinder.
The Baseline: the Where
At its simplest, speculation is about anticipating an up or down move in price.
Think it’s going up? Buy and aim to sell higher.
Think it’s going down? Sell and aim to buy back lower.
It sounds simple, but anyone with more than a month of trading experience can tell you it’s anything but. No one can predict the future with certainty. Still, this is at least a binary game: two mutually exclusive outcomes, like flipping a coin.
In technical terms, the market starts as a 50/50 distribution. With skill, analysis, and discipline, you might bias those odds slightly—say, 60/40 in your favor. That bias, repeated consistently, is what we call an edge. And with an edge, the path to long-term success is paved.
The Illusion of Acceleration
But let’s be honest: who wants to grind out a 60/40 edge slowly? We’re here for the Lamborghini, right? And the sooner the better.
That’s where the industry steps in with its “solution”: options. The promise is seductive—leverage the process, accelerate the outcome. With little money down, you can aim for massive returns. What’s not to like?
The problem is that the acceleration doesn’t come for free. To deliver those explosive payouts, the game adds layers of complexity.
From Where… to How and When
In options, you don’t just need to be right about where price is going.
You also need to be right about how it moves. That’s volatility—the speed and amplitude of the move. Even if you guess the direction correctly, if the move isn’t strong enough to beat strike + premium, you lose.
And then comes the when. Options expire. Time works against you. With the rise of 0DTE options, this window has shrunk to a single day. You might be perfectly right on direction and volatility—but if it happens tomorrow instead of today, your trade is worthless.
Now here’s the key point: this isn’t additive complexity. It’s multiplicative. Each layer collapses your probability of success exponentially. Even though the mathematical proof could be enlightening, I have promised not to use heavy math in this blog. All you need to know is this: in the majority of cases, that collapse in probability is not evenly compensated by the outsized payout. And this is exactly what most retail traders fail to perceive.
It’s not just that you’re playing a harder game—it’s that you’re playing a biased one, where the odds are stacked even further against you.
The Lottery Bias: The Cognitive Trap
Here’s where psychology plays its cruelest trick. The lower the probability of success, the higher the payout offered. In fact, it’s not even the full payout you deserve—it’s a discounted, haircut payout, cleverly packaged so you don’t notice because the potential number is so large. And that number lights up the brain like a jackpot.
The industry knows this. It builds its business on the fact that humans systematically overestimate tiny probabilities and underestimate the certainty of losing. Retail traders convince themselves they’re being clever: risking little for the chance at something huge. But the math is merciless—the expected value is brutally negative.
The market is not handing you an edge. It’s dismantling any possibility you had of one. That giant payout you see? It’s not a gift—it’s a warning label.
And yes, I know you can point to stories about the guy who hit the jackpot, who “proved the math wrong.” But let me ask you this: do you know what survivorship bias is? If you don’t, and you’re trading options, here’s some professional advice for free—go and read about it before you place your next trade.
The Real Path to the Lambo
What gets sold as “smart leverage” is, in truth, just a lottery ticket wearing a suit. The Lambo doesn’t come from hitting jackpots. It comes from consistency—from repeating disciplined decisions with positive expectancy until compounding does its quiet but powerful work.
And yes, I know most traders are in a hurry. The good news? The process can be accelerated—but not by gambling on options with negative expectancy. It can be accelerated using technical, rational tools. Once an edge is established, leverage makes sense. That’s where concepts like the Kelly criterion come in: scaling growth aggressively, but without walking straight into ruin. (I’ve already written about Kelly earlier in this blog: here.)
Conclusion
We’ve stripped the illusion bare: more conditions don’t make you smarter, they make you less likely to succeed. What feels like a shortcut is nothing more than a statistical mirage—the financial equivalent of a lottery ticket, marketed to you as a “highway to riches,” exploiting your belief that complexity equals intelligence.
Unfortunately, the narrative is powerful, because it preys directly on cognitive bias. I know I’m swimming against the tide here. I know this post won’t go viral. I don’t expect many to believe what the math has to say about options trading.
But maybe, just maybe, a small number of traders reading this will see beneath the surface and save their time, energy, and money for better pursuits. If that’s you, then this post has already done its job.
If you can resist the mirage and stick to building real edges, you’ve already won a key battle—and most likely saved yourself a costly trading lesson.

Why IonQ (IONQ) Could Be the NVDA of Quantum ComputingIf you haven`t bought IONQ before the rally:
Now you need to know that IonQ isn’t just another speculative quantum stock — The company is building a robust ecosystem around its best‑in‑class trapped‑ion architecture and targeting fault‑tolerant, networked quantum systems. With record bookings, major acquisitions, and a strong balance sheet, IonQ could emerge as the NVIDIA equivalent for quantum infrastructure.
Key Bullish Arguments
1) Superior Quantum Tech – Trapped‑Ion Advantage
IonQ’s trapped-ion processors boast 99.9% two-qubit fidelity, demonstrating higher accuracy and scalability than superconducting alternatives
These systems also operate at room temperature, meaning simpler deployment and lower costs
2) Ecosystem Strategy & Acquisitions
The $1.08B acquisition of Oxford Ionics (expected close in 2025) expands IonQ’s qubit control tech, pushing toward planned 80,000 logical‑qubit systems by decade’s end
Combined with ID Quantique and Lightsynq, IonQ is building a full-stack quantum and networking offering
3) Strong Revenue Growth & Cash Runway
Revenue soared from $22M in 2023 to $43.1M in 2024, with bookings of $95.6M
. Q1 2025 saw $7.6M revenue and EPS –$0.14, beating expectations; cash reserves near $697M provide years of runway
4) Real Commercial Deployments
IonQ sold its Forte Enterprise quantum system to EPB ($22M deal) for hybrid compute and networking, marking real-world commercial applications
5) AI & Quantum Synergy
Involvement in NVIDIA’s Quantum Day and hybrid quantum‑classical AI demos (e.g., blood pump simulation with Ansys, ~12 % faster) indicates strategic synergy and positions IonQ as a critical piece in the future AI stack
Recent Catalysts:
Texas Quantum Initiative passes – positions IonQ at forefront of U.S. state-backed innovation
Oxford Ionics acquisition pending – major expansion in qubit scale & tech
Barron’s analyst buys – industry analysts see long-term potential; IonQ among top quantum picks
Broader quantum optimism – McKinsey & Morgan Stanley forecasts highlight synergy between quantum and AI, benefiting IonQ

NTNX Nutanix Options Ahead of EarningsIf you haven`t bought NTNX before the rally:
nor sold the top:
Now analyzing the options chain and the chart patterns of NTNX Nutanix prior to the earnings report this week,
I would consider purchasing the 72.5usd strike price Calls with
an expiration date of 2025-9-19,
for a premium of approximately $3.70.
If these options prove to be profitable prior to the earnings release, I would sell at least half of them.

KMX CarMax Options Ahead of EarningsIf you haven`t sold KMX before the previous earnings:
Now analyzing the options chain and the chart patterns of KMX CarMax prior to the earnings report this week,
I would consider purchasing the 90usd strike price in the money Calls with
an expiration date of 2027-1-15,
for a premium of approximately $4.25.
If these options prove to be profitable prior to the earnings release, I would sell at least half of them.
Disclosure: I am part of Trade Nation's Influencer program and receive a monthly fee for using their TradingView charts in my analysis.

TOP 3 for 9.9.2025 - $IWM, $TJX, $MPCTOP 3 for 9.9.2025 - AMEX:IWM , NYSE:TJX , NYSE:MPC
Great setups, has momentum and ready to take off.

PLTR Bear Play! $145 Put Poised for Big Weekly Move!
# ⚡ PLTR Weekly Put Play – \$145 Strike for 50-100% Gains 💹🔥
### 🔎 Quick Market Snapshot
* **📉 Daily RSI:** 33.8 → Oversold & accelerating downward momentum
* **📊 Weekly RSI:** 56.8 → Falling, weakening bullish momentum
* **💵 Price Action:** -15.65% drop, bearish engulfing pattern
* **📈 Volume:** 1.5x previous week → Institutional selling confirmed
* **📊 Options Flow:** Call/Put ratio 1.00, but heavy put volume @ key strikes
* **🌡️ VIX:** 15.8 → Low volatility environment, ideal for directional trading
---
### 🎯 Trade Setup (High Conviction Put Play)
* **Ticker:** PLTR
* **Direction:** 📉 PUT
* **Strike:** \$145.00
* **Entry Price:** \$1.70
* **Profit Target:** \$2.52 (50% gain), secondary \$3.36 (100% gain)
* **Stop Loss:** \$0.84 (50% of premium)
* **Expiry:** 2025-08-22
* **Confidence:** 🟢 75% Bearish
* **Timing:** Enter **market open Thursday**
---
### 📝 Trade Thesis
Strong institutional selling + oversold technicals + bearish price action = **high-probability short-term put trade**.
⚡ **Play: \$145 Put targeting 50-100% gains before Friday expiration.**

MNSO Earnings Bull Play – \$22.50C Targeting 2X+ Gains
# 🚀 MNSO Earnings Bull Play – \$22.50C Targeting 2X+ Gains 💹🔥
### 🔎 Quick Earnings Snapshot
* **📈 Revenue Growth:** Strong **TTM 18.9%**, EPS growth projected **37.3%**
* **💰 Margins:** Gross 45.1%, Operating 16.0%, Profit 13.9%
* **📊 Analyst Sentiment:** “Buy” with \~9.5% upside from current levels
* **⚖️ Options Flow:** Call interest building @ \$22.50 strike, slight bullish skew
* **📉 Technicals:** Above 20-day MA, RSI supports upward momentum, accumulation evident
---
### 🎯 Trade Setup (High Conviction Call Play)
* **Ticker:** MNSO
* **Direction:** 📈 CALL
* **Strike:** \$22.50
* **Entry Price:** \$0.85
* **Profit Target:** \$1.70 (200% gain)
* **Stop Loss:** \$0.42 (50% of premium)
* **Expiry:** 2025-09-19
* **Confidence:** 🟢 75% Bullish
* **Timing:** Enter **pre-earnings close**
---
### 📝 Thesis
Strong fundamentals + positive pre-earnings technical trends = favorable asymmetric **risk/reward profile**.
⚡ **Play: \$22.50 Call for 2X+ upside post-earnings.**

OUST Ouster Options Ahead of EarningsAnalyzing the options chain and the chart patterns of OUST Ouster prior to the earnings report this week,
I would consider purchasing the 20usd strike price Calls with
an expiration date of 2026-1-16,
for a premium of approximately $0.75.
If these options prove to be profitable prior to the earnings release, I would sell at least half of them.

JD Options Ahead of EarningsIf you haven`t bought JD before the recent rally:
Now analyzing the options chain and the chart patterns of JD prior to the earnings report this week,
I would consider purchasing the 32.50usd strike price Calls with
an expiration date of 2026-1-16,
for a premium of approximately $3.10.
If these options prove to be profitable prior to the earnings release, I would sell at least half of them.
Disclosure: I am part of Trade Nation's Influencer program and receive a monthly fee for using their TradingView charts in my analysis.

MNDY Earnings Play — Strong Bullish Momentum Ahead of AMC**🚀 MNDY Earnings Play — Strong Bullish Momentum Ahead of AMC**
Monday.com (MNDY) shows powerful fundamentals with 30% revenue growth and a perfect 8-quarter earnings beat streak. Options flow and technicals align for a potential explosive move post-earnings on **2025-08-08 (After Market Close)**.
**🔥 Key Stats:**
* Revenue growth: 30.1% TTM
* EPS consensus: \$3.70 (85% confidence in a beat)
* IV Rank: 75% (watch for IV crush post-earnings)
* RSI near 25 → oversold, setup for bounce
* Strong call volume at \$250 strike
**🛠 Trade Setup:**
* **Instrument:** MNDY
* **Direction:** CALL (LONG)
* **Strike:** \$250
* **Entry Price:** \$17.40
* **Profit Target:** \$52.00 (200-400% gain)
* **Stop Loss:** \$8.70 (50% premium cut)
* **Expiry:** 2025-08-15
* **Size:** 1 contract
* **Entry Timing:** Pre-earnings close
**⚠ Risk Management:**
* Position size max 2% portfolio
* Exit within 2 hours post-earnings to avoid IV crush and theta decay
---
**#MNDY #MondayDotCom #EarningsTrade #OptionsTrading #CallOptions #BullishSetup #PreEarnings #TechnicalAnalysis #RSI #IVRank #SwingTrade #TradingView #StockMarket #HighReward #RiskManagement**

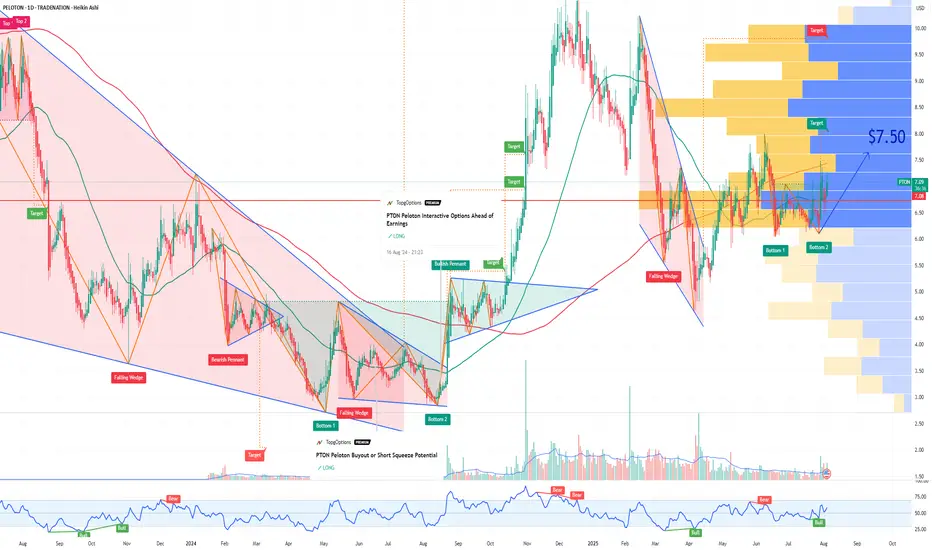
PTON Peloton Interactive Options Ahead of EarningsIf you haven`t bought the dip on PTON:
Now analyzing the options chain and the chart patterns of PTON Peloton Interactive prior to the earnings report this week,
I would consider purchasing the 7.50usd strike price Calls with
an expiration date of 2025-8-8,
for a premium of approximately $0.46.
If these options prove to be profitable prior to the earnings release, I would sell at least half of them.
Disclosure: I am part of Trade Nation's Influencer program and receive a monthly fee for using their TradingView charts in my analysis.