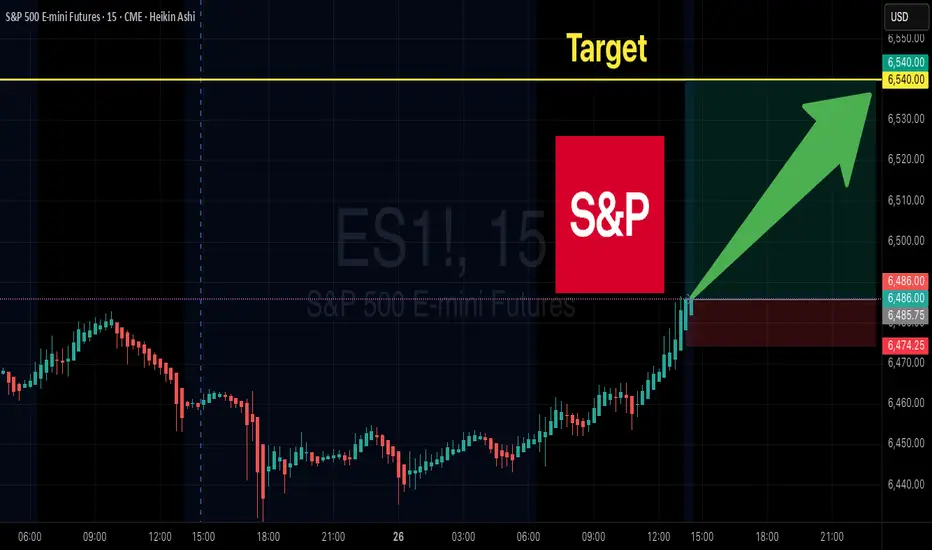
ES Futures LONG Setup | 6462 → 6556
# 🚀 ES Futures LONG Setup | 6462 → 6556 🎯 (1:2 R\:R)
### 📝 Market Bias
* **Conditional Bullish** into US open.
* Higher-timeframe trend strong (price > 10/20/50/200 SMAs).
* **BUT** intraday momentum still mixed (MACD bearish) + thin overnight liquidity.
👉 **Trade ONLY if liquidity & momentum confirm at open.**
---
### 🎯 Trade Idea
**Setup:** Conditional LONG (market open only)
* 📍 **Entry:** 6462.25 (acceptable range 6455 – 6475)
* 🛑 **Stop Loss:** 6415.15 (0.75 × ATR = 47.10 pts)
* 💰 **Take Profit:** 6556.45 (2 × stop = 94.20 pts)
* ⚖️ **Risk/Reward:** 1 : 2
* 💪 **Confidence:** 60%
**Risk/Reward per Contract:**
* ❌ Risk = \$2,355
* ✅ Reward = \$4,710
---
### 📊 Position Sizing
* Formula: `contracts = floor((account_size × risk%) / (stop_pts × $50))`
* Example:
* \$100k acct @ 2% risk → 0 contracts (use micro/mini).
* \$200k acct → 1 contract.
* \$250k acct → 2 contracts.
---
### 📈 Scale & Exits
* Take **50% profit @ 6509.35** (1× stop).
* Hold rest to **6556.45 TP**.
* Move stop to breakeven after scaling.
---
### ⚠️ Key Risks
* Very thin overnight liquidity → slippage risk.
* MACD still bearish; must improve at open.
* Price near 20-day highs → upside limited.
* Event/headline risk at open.
---
### ✅ Pre-Conditions (MUST at Open)
* Strong liquidity/volume vs overnight.
* Price holds above SMA10 & SMA20.
* Preferable: MACD histogram improves in 15–30 mins.
❌ If conditions fail → NO TRADE.
---
### 📌 Trade JSON (For Algo/Notes)
```json
{
"instrument": "ES",
"direction": "long",
"entry_price": 6462.25,
"stop_loss": 6415.15,
"take_profit": 6556.45,
"size": 1,
"confidence": 0.60,
"entry_timing": "market_open",
"point_value": 50,
"signal_publish_time": "2025-08-25 15:47:27"
}
```
---
### 🔖 Hashtags
\#ES #SP500 #FuturesTrading #OptionsTrading #SwingTrade #DayTrading #TradeSetup #MarketOpen #RiskReward #PriceAction #TechnicalAnalysis #SmartMoney #StockMarket #TradingSignals #ScalpSetup
Optionstrading
Setting up for a Long Swing TradeHi Traders!
I've been keeping an eye on CHEWY for a few weeks now. Chewy dipped into the 78% fib, and set up for a reversal. I'd like to see a possible retest at a Daily Breaker Order Block at around $39.50. If that can verify that the Daily CHOCH is valid, I'm planning to swing this Options trade for a few weeks. My first target would be around $42. In addition, the monthly IMO is bullish and could give us another long term swing.
Alerts are set for now.
*DISCLAIMER: I am not a financial advisor. The ideas and trades I take on my page are for educational and entertainment purposes only. I'm just showing you guys how I trade. Remember, trading of any kind involves risk. Your investments are solely your responsibility and not mine.*

MRVL $80 Call: Balanced Risk, High-Reward LEAP Trade!
## 💎 MRVL \$80 LEAP – Long-Term Semiconductor Bullish Play! (Sep 2026 Expiry) 💎
### 🔑 Market Summary
* 📊 **Momentum:** Weekly RSI shows short-term bullish recovery; monthly chart signals caution → mixed to moderately bullish
* ⚖️ **Options Flow:** Favorable volatility environment supports LEAP strategy
* 🏦 **Institutional Sentiment:** Mixed; some accumulation noted, but bearish long-term trend remains a caution
* 🌐 **Sector Context:** Semiconductor market recovery potential, but watch for broader bearish drivers
---
### 📈 Trade Setup
* 🟢 **Direction:** LONG CALL
* 🎯 **Strike:** \$80.00
* 💵 **Entry Price:** \~\$15.50
* 📅 **Expiry:** Sep 18, 2026 (\~13 months)
* 📊 **Size:** 1 contract
* ⏰ **Entry Timing:** Market open
* 📈 **Confidence Level:** 75%
---
### 💥 Risk & Reward
* 🏆 **Profit Target:** \$31.00 (100%+ potential upside; aggressive target \~\$46.00)
* 🛑 **Stop Loss:** \$10.50 (30–40% of entry price)
* ⚡ **Key Risks:** Bearish monthly momentum, semiconductor sector headwinds, potential bull trap
* 🔄 **Recommendation:** Enter cautiously, monitor weekly momentum for continuation signals
---
### 🔥 Hashtags for Viral Sharing
\#MRVLLEAP #MRVLOptions #Semiconductors #LongTermCall #LEAPs #BullishPlay #TradingViewAlerts #WallStreet

VARUN BEVERAGES 1D TIMEFRAMEWATCH VBL on daily timeframe, entry after trendline break(525)
2% stop loss and 1target 6% and 2target 12%
add in your watchlist
this is for education purpose only.
do your analysis first.

MNSO Earnings Bull Play – \$22.50C Targeting 2X+ Gains
# 🚀 MNSO Earnings Bull Play – \$22.50C Targeting 2X+ Gains 💹🔥
### 🔎 Quick Earnings Snapshot
* **📈 Revenue Growth:** Strong **TTM 18.9%**, EPS growth projected **37.3%**
* **💰 Margins:** Gross 45.1%, Operating 16.0%, Profit 13.9%
* **📊 Analyst Sentiment:** “Buy” with \~9.5% upside from current levels
* **⚖️ Options Flow:** Call interest building @ \$22.50 strike, slight bullish skew
* **📉 Technicals:** Above 20-day MA, RSI supports upward momentum, accumulation evident
---
### 🎯 Trade Setup (High Conviction Call Play)
* **Ticker:** MNSO
* **Direction:** 📈 CALL
* **Strike:** \$22.50
* **Entry Price:** \$0.85
* **Profit Target:** \$1.70 (200% gain)
* **Stop Loss:** \$0.42 (50% of premium)
* **Expiry:** 2025-09-19
* **Confidence:** 🟢 75% Bullish
* **Timing:** Enter **pre-earnings close**
---
### 📝 Thesis
Strong fundamentals + positive pre-earnings technical trends = favorable asymmetric **risk/reward profile**.
⚡ **Play: \$22.50 Call for 2X+ upside post-earnings.**

Weekly Watchlist - 8/18 - 8/22 Top 3 - $CHWY, $LYFT, $YUM+BONUSThis is my weekly watchlist - solid setups going into this week.

META Calls on Fire– Don’t Miss Out 🚀 META Bulls Eye \$805 – One-Day Call Sprint Before Expiry
**Sentiment:** 🟢 *Strong Bullish*
* **Daily RSI:** Rising 📈
* **Weekly RSI:** Rising 📈
* **C/P Ratio:** 1.82 → heavy call buying
* **Volume:** Weak (0.5× last week) → watch for hesitation
* **Gamma Risk:** HIGH — expiry in 1 day ⚡
---
### 📊 **Consensus Snapshot**
✅ All models agree: bullish momentum + strong options flow
⚠️ Weak volume + high gamma = manage risk tightly
---
### 🎯 **Trade Setup**
* **Type:** CALL (Single-Leg)
* **Strike:** \$805.00
* **Expiry:** 2025-08-15
* **Entry:** \$0.57
* **Profit Target:** \$0.85 (+49%)
* **Stop Loss:** \$0.34 (–40%)
* **Confidence:** 75%
* **Entry Timing:** Market open
---
💬 *High-momentum, high-risk expiry play — eyes on the tape all day.*
📌 *Not financial advice. DYOR.*
---
**#META #OptionsTrading #GammaSqueeze #DayTrading #StocksToWatch #TradingSignals #OptionsFlow**

$SCHW - Trade Idea for 8/15DAILY - 3-1 SETUP
WEEKLY - 3-1-2U REV
MONTH - INSIDE CANDLE
QUARTER 3-2U
This is something you could scale into as well depending on the risk you are willing to take.

CAVA Earnings Options Play (Aug 12, 2025⚠️ CAVA Earnings Options Play (Aug 12, 2025)**
**Bias:** 🐻 Moderate Bearish (65% Confidence) — Mixed fundamentals + bearish technicals
📊 **Fundamentals:**
* Revenue growth strong (+28.1% TTM) but EPS expected to plunge -58.3%
* Margins tight; cost pressures looming
* Forward P/E sky-high at 168.7 — pricey expectations
* Sector exposed to consumer spending risks
📈 **Technicals:**
* Trading below 50 & 200 DMA → bearish momentum
* RSI near oversold at 40.08 — possible short-term bounce but downtrend intact
* Key support: \$82.00 — breach signals more downside
💡 **Options Flow:**
* Heavy open interest on \$80 puts and \$85 calls — mixed sentiment but bearish tilt
* IV Rank 60% with expected move \~ \$5.00 → priced for volatility
---
### 💣 Trade Setup:
* **Instrument:** CAVA
* **Trade:** Buy PUT
* **Strike:** \$82.00
* **Entry Price:** \$4.05 (bid side, conservative)
* **Expiry:** Aug 15, 2025
* **Profit Target:** \$12.15 (+200%)
* **Stop Loss:** \$2.025 (50% premium decay)
* **Size:** 2 contracts
* **Entry Timing:** Pre-earnings close
* **Earnings Date:** Aug 14, AMC
⚠️ **Risk:** Close position within 2 hours post-earnings if no target hit
---
**TL;DR:**
Price action and fundamentals suggest downside risk post-earnings. Buying puts at \$82 strike targets a big move down, but manage your risk tightly around earnings volatility.
\#CAVA #EarningsPlay #OptionsTrading #PutOptions #BearishSetup #VolatilityTrading #OptionsFlow #StockMarket #TechnicalAnalysis #EarningsSeason

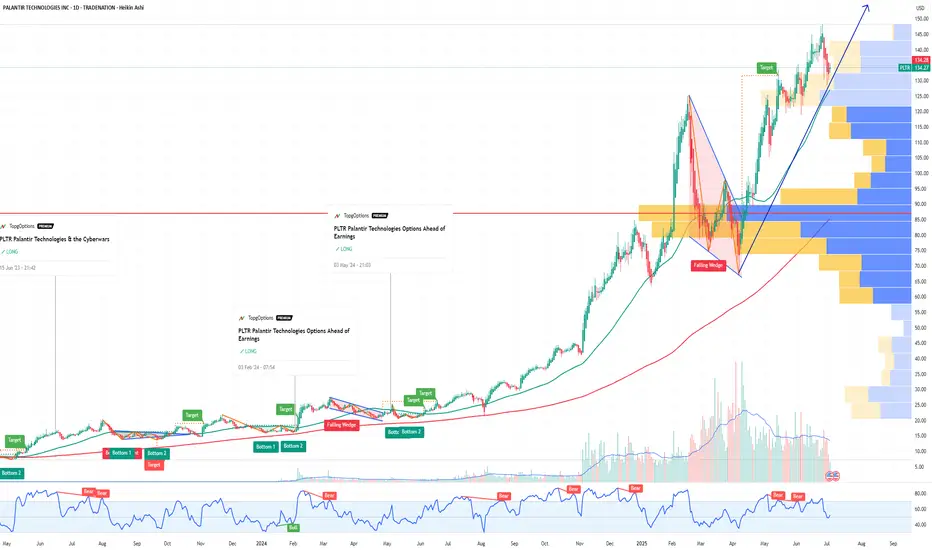
Why Palantir (PLTR) Could Be the NVDA of Government AI If you haven`t bought PLTR before the massive rally:
Palantir Technologies (PLTR) is proving it’s more than just another AI hype play — it’s becoming a core piece of the secure AI infrastructure for governments and large enterprises worldwide.
Key Bullish Arguments
1) Strong Government Moat
PLTR’s deep relationship with the U.S. government, NATO, and allies provides sticky, long-term revenue streams. In an age of geopolitical tension, this is exactly the type of mission-critical AI spending that stays funded.
2) Expanding Commercial Footprint
The commercial segment is no longer a side project. Palantir’s Foundry and Apollo platforms help enterprises deploy AI at scale — securely, in-house, and without sending sensitive data to open systems. Recent deals in healthcare, energy, and critical infrastructure show they’re broadening their customer base.
3) Profitability & Balance Sheet
Palantir is GAAP profitable for six consecutive quarters, with strong free cash flow and zero debt. For a growth stock in AI, this gives it rare staying power if macro conditions tighten.
4) Technical Strength
The stock broke out above ~$125–$130 support and is now testing key resistance in the $140–$148 range. Weekly momentum remains bullish, and institutional accumulation (A/D line) remains strong.
5) AI Tailwinds Remain
While the general AI trade has cooled for some names, PLTR’s unique moat in secure and domain-specific AI makes it more defensible than generic “AI SaaS” stocks. New contracts or AI platform updates could reignite momentum this summer.
Possible Summer Catalysts
New multi-year government deals — especially in defense and cybersecurity.
Major commercial partnerships — especially in healthcare or energy.
AI platform upgrades — more integrations with LLMs or domain-specific AI.
Inclusion in AI-focused ETFs — or further index rebalancing inflows.
Disclosure: I am part of Trade Nation's Influencer program and receive a monthly fee for using their TradingView charts in my analysis.
$EXPE — Friday Intraday Alert Breakdown: Entry, Exit & Stop LossOne of my traders held an NASDAQ:EXPE intraday alert from Friday a bit longer than planned. In this video, I break down exactly why I called the trade, the timeframe I was watching, my entry level, profit target, and stop loss. Clear trade plan → clean execution.
For more trade breakdowns and market insight, check out StockOptionSavages.

JD Options Ahead of EarningsIf you haven`t bought JD before the recent rally:
Now analyzing the options chain and the chart patterns of JD prior to the earnings report this week,
I would consider purchasing the 32.50usd strike price Calls with
an expiration date of 2026-1-16,
for a premium of approximately $3.10.
If these options prove to be profitable prior to the earnings release, I would sell at least half of them.
Disclosure: I am part of Trade Nation's Influencer program and receive a monthly fee for using their TradingView charts in my analysis.

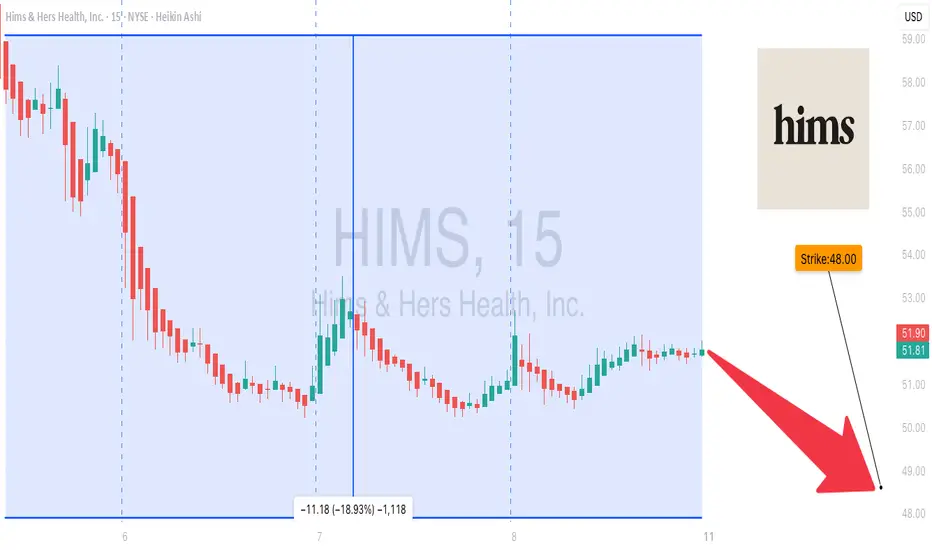
HIMS Bearish Breakdown — Weekly Put Option Setup🚨 HIMS Bearish Breakdown — Weekly Put Option Setup**
Hims & Hers (HIMS) shows strong institutional selling pressure with a clear breakdown below key support levels. Multiple models (Google Gemini, DeepSeek, Claude) confirm bearish momentum fueled by heavy volume, insider selling, and ongoing legal concerns. While a short-term bounce is possible, the bias remains firmly bearish into next week.
**🛠 Trade Setup:**
* **Instrument:** HIMS
* **Direction:** PUT (SHORT)
* **Strike:** \$48.00
* **Expiry:** 2025-08-15
* **Entry Price:** \$0.94
* **Profit Target:** \$1.35 (50% gain)
* **Stop Loss:** \$0.40
* **Size:** 1 contract
* **Entry Timing:** Market open
* **Confidence:** 75%
**📊 Key Factors:**
* Heavy institutional distribution
* Breakdown of weekly support
* High selling volume with low VIX environment (favorable for directional trades)
* Lawsuits + insider selling adding downside risk
**⚠ Risks:**
* Rising daily RSI could spark a temporary bounce
* Event-driven volatility could shift trade direction quickly
---
**#HIMS #OptionsTrading #PutOptions #WeeklyOptions #BearishSetup #SupportBreakdown #TechnicalAnalysis #TradingView #InstitutionalSelling #VolatilityPlay #SwingTrade #OptionsStrategy**
CORZ Earnings Alert — Bearish Setup Ahead of BMO Report****⚠️ CORZ Earnings Alert — Bearish Setup Ahead of BMO Report**
Core Scientific (CORZ) faces heavy fundamental headwinds with declining revenue (-55.6%) and negative margins, despite some bullish options flow and technical support near \$14.
**📉 Market Sentiment:**
* Moderate bearish conviction (75%)
* Mixed signals: cautious optimism from options flow vs. weak fundamentals
* Watch M\&A uncertainty and regulatory risks
**🛠 Trade Setup:**
* **Instrument:** CORZ
* **Direction:** PUT (SHORT)
* **Strike:** \$14
* **Entry Price:** \$0.16
* **Profit Target:** \$0.48 (200-300% gain)
* **Stop Loss:** \$0.08
* **Expiry:** 2025-08-08
* **Size:** 1 contract
* **Entry Timing:** Pre-earnings close
**🔑 Key Levels:**
* Support near \$14
* Resistance at \$15
* Expected Move: -\$2.50
**⚠ Risk Management:**
* Cut losses at 50% premium decline (\$0.08)
* Exit by market open next day if no target hit
---
**#CORZ #CoreScientific #EarningsTrade #PutOptions #BearishSetup #OptionsTrading #CryptoStocks #MAndA #RiskManagement #TechnicalAnalysis #TradingView #StockMarket #Volatility #ShortSetup**

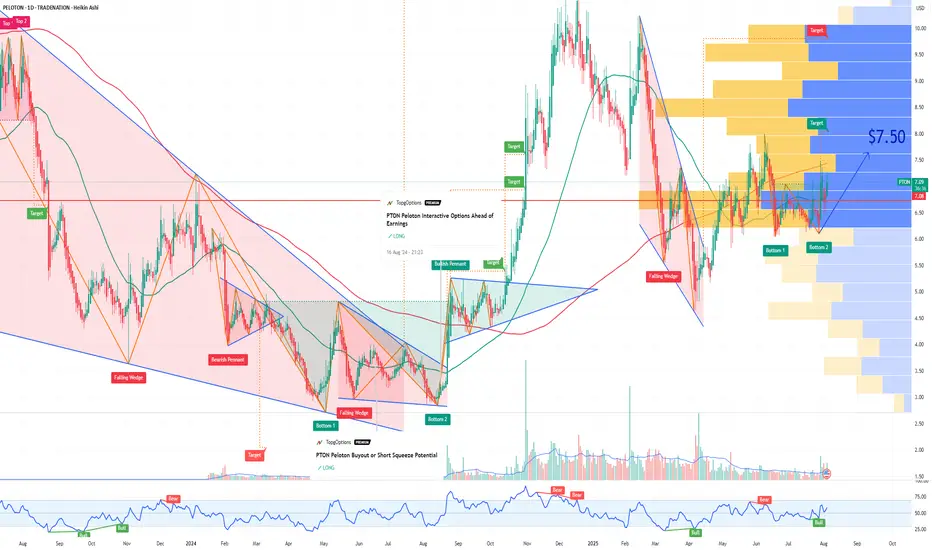
PTON Peloton Interactive Options Ahead of EarningsIf you haven`t bought the dip on PTON:
Now analyzing the options chain and the chart patterns of PTON Peloton Interactive prior to the earnings report this week,
I would consider purchasing the 7.50usd strike price Calls with
an expiration date of 2025-8-8,
for a premium of approximately $0.46.
If these options prove to be profitable prior to the earnings release, I would sell at least half of them.
Disclosure: I am part of Trade Nation's Influencer program and receive a monthly fee for using their TradingView charts in my analysis.
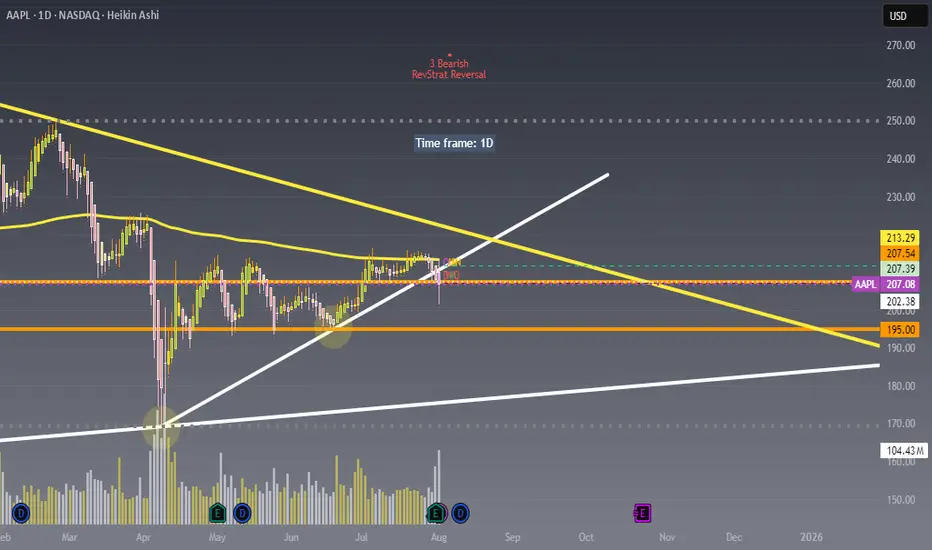
Watching AAPL closely here !!!Not financial advice – just sharing my outlook. 📉📈
Price is currently rejecting the upper trendline resistance around $213 and struggling to hold above the $207-$208 zone.
Looking for potential puts as long as price remains under this key resistance area.
Will be buying the dip near the $195 or $185 zone where strong demand and trendline support intersect.
Key levels :
Resistance: $213.29 / $207.54
Support: $202.38 / $195.00
Watching for Pullback Below $84 in Citigroup (C)Over the past month, Citigroup shares have appreciated 8.58%, outperforming both the Finance sector's 1.91% gain and the S&P 500's 3.92% increase. This relative outperformance may signal strength, but short-term positioning and market structure suggest a potential shift.
Expecting a Sharp Move Below $84 – Option Flow Insight
Despite the recent strength, I anticipate a significant downward move below the $84 level in the upcoming week. This expectation is based on notable option activity detected in the Times & Sales feed, specifically large put orders suggesting bearish positioning.
In response to this setup, I plan to execute a bearish vertical spread, specifically:
Buying the $84 puts
Selling the $80 puts
This strategy limits downside risk while still profiting from a potential retracement.
Fundamental Picture Ahead of Earnings
Citigroup's next earnings release is scheduled for July 15, 2025. The company is expected to report:
EPS of $1.70 (+11.84% YoY)
Revenue of $20.85B (+3.51% YoY)
For the full year, the Zacks Consensus Estimate forecasts:
EPS of $7.38 (+24.03%)
Revenue of $83.84B (+3.33%)
While these figures suggest healthy growth, it's important to note that recent analyst estimate revisions have been modestly negative, with the EPS estimate decreasing 0.27% over the last 30 days. Citigroup currently holds a Zacks Rank #3 (Hold), reflecting a neutral sentiment from analysts.
Valuation Metrics
From a valuation standpoint:
Forward P/E: 10.75, notably below the industry average of 15.02
PEG ratio: 0.61, versus the industry average of 1.26
This indicates that Citigroup is undervalued relative to its peers, especially when considering growth prospects, which could provide some support. However, short-term bearish flows may dominate price action heading into earnings.
Industry Outlook
The Financial - Investment Bank industry, which includes Citigroup, currently has a Zacks Industry Rank of 96, placing it in the top 40% of over 250 industry groups. Historically, industries in the top half outperform those in the bottom half by a factor of 2 to 1.

MSFT Microsoft Corporation Options Ahead of EarningsIf you haven`t bought MSFT when they announced the 49% stake in OpenAI:
Now analyzing the options chain and the chart patterns of MSFT Microsoft Corporation prior to the earnings report this week,
I would consider purchasing the 550usd strike price Calls with
an expiration date of 2025-12-19,
for a premium of approximately $14.75.
If these options prove to be profitable prior to the earnings release, I would sell at least half of them.
Disclosure: I am part of Trade Nation's Influencer program and receive a monthly fee for using their TradingView charts in my analysis.

LC EARNINGS PLAY – STRIKE WHILE IT'S HOT!**
🚨 **LC EARNINGS PLAY – STRIKE WHILE IT'S HOT!** 🚨
📅 **Earnings Season Heat Check: LC | Jul 29**
💰 **Positioning for a Post-Earnings POP!**
---
🔥 **The Setup:**
LC’s earnings momentum is real –
📈 TTM Rev Growth: **+13.1%**
💹 EPS Surprise Rate: **150% avg**
📊 75% Beat Rate History
💵 Analyst Consensus: **Strong Buy (1.8/5)**
---
📉 **Technical Tailwind:**
✅ Price above 20D + 200D MA
✅ RSI: **60.07** – room to run
📈 Volume Spike: **+61% above 10-day avg**
🚀 Options flow targeting **\$14 CALLS** w/ OI: **864** / Vol: **737**
---
📌 **TRADE IDEA**
🎯 Buy: **\$14.00 Call @ \$0.70**
📆 Exp: **Aug 15, 2025**
🎯 Target: **\$2.10** (Risk/Reward = 1:3)
🛑 Stop: **\$0.35**
---
⚠️ **Earnings Risk:** IV crush real.
🎯 Exit within 2 hours **post-EPS** if no move.
Macro tailwinds + financial sector rotation = 🚀 fuel.
**Beta = 2.45** → Big move potential incoming!
---
🧠 Confidence Level: **75%**
⏰ Timing: Pre-Earnings Close
🧾 Model-Driven Strategy | No Hype, Just Edge.
---
💥 Let’s ride the LC earnings wave – \$15+ in sight! 💥
\#LendingClub #LC #EarningsPlay #OptionsTrading #TradingView #StocksToWatch #CallOption #Fintech #SwingTrade #EarningsHustle #BullishSetup #IVCrush #EarningsGamma #ShortTermTrade

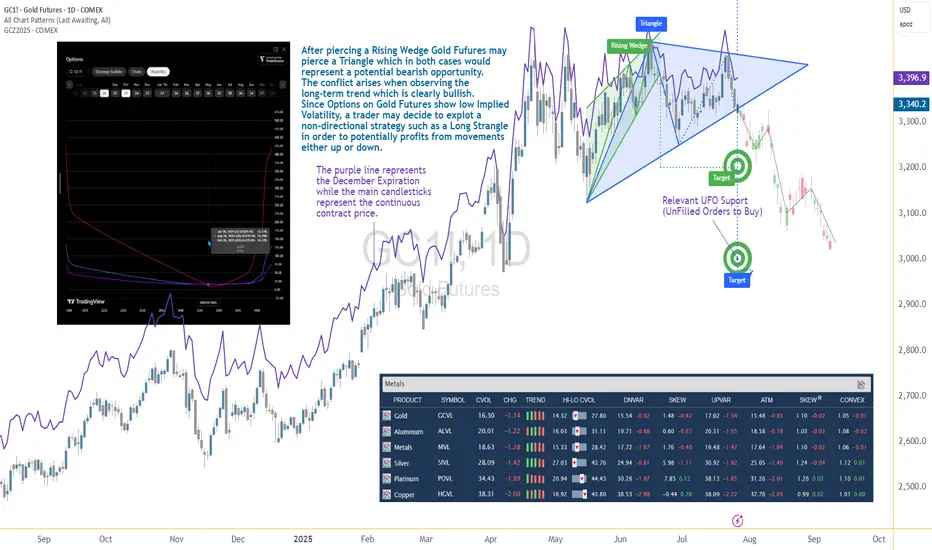
Options Blueprint Series [Intermediate]: Gold Triangle Trap PlayGold’s Volatility Decline Meets a Classic Chart Setup
Gold Futures have been steadily declining after piercing a Rising Wedge on June 20. Now, the market structure reveals the formation of a Triangle pattern nearing its apex — a point often associated with imminent breakouts. While this setup typically signals a continuation or reversal, the direction remains uncertain, and the conflict grows when juxtaposed with the longer-term bullish trajectory Gold has displayed since 2022.
The resulting dilemma for traders is clear: follow the short-term bearish patterns, or respect the dominant uptrend? In situations like these, a non-directional approach may help tackle the uncertainty while defining the risk. This is where a Long Strangle options strategy becomes highly relevant.
Low Volatility Sets the Stage for an Options Play
According to the CME Group’s CVOL Index, Gold’s implied volatility currently trades near the bottom of its 1-year range — hovering just above 14.32, with a 12-month high around 27.80. Historically, such low readings in implied volatility are uncommon and often precede sharp price movements. For options traders, this backdrop suggests one thing: options are potentially underpriced.
Additionally, an IV analysis on the December options chain reveals even more favorable pricing conditions for longer-dated expirations. This creates a compelling opportunity to position using a strategy that benefits from volatility expansion and directional movement.
Structuring the Long Strangle on Gold Futures
A Long Strangle involves buying an Out-of-the-Money (OTM) Call and an OTM Put with the same expiration. The trader benefits if the underlying asset makes a sizable move in either direction before expiration — ideal for a breakout scenario from a compressing Triangle pattern.
In this case, the trade setup uses:
Long 3345 Put (Oct 28 expiration)
Long 3440 Call (Oct 28 expiration)
With Gold Futures (Futures December Expiration) currently trading near $3,392.5, this strangle places both legs approximately 45–50 points away from the current price. The total cost of the strangle is 173.73 points, which defines the maximum risk on the trade.
This structure allows participation in a directional move while remaining neutral on which direction that move may be.
Technical Backdrop and Support Zones
The confluence of chart patterns adds weight to this setup. The initial breakdown from the Rising Wedge in June signaled weakness, and now the Triangle’s potential imminent resolution may extend that move. However, technical traders must remain alert to a false breakdown scenario — especially in trending assets like Gold.
Buy Orders below current price levels show significant buying interest near 3,037.9 (UFO Support), suggesting that if price drops, it may find support and rebound sharply. This adds further justification for a Long Strangle — the market may fall quickly toward that zone or fail and reverse just as violently.
Gold Futures and Micro Gold Futures Contract Specs and Margin Details
Understanding the product’s specifications is crucial before engaging in any options strategy:
🔸 Gold Futures (GC)
Contract Size: 100 troy ounces
Tick Size: 0.10 = $10 per tick
Initial Margin: ~$15,000 (varies by broker and volatility)
🔸 Micro Gold Futures (MGC)
Contract Size: 10 troy ounces
Tick Size: 0.10 = $1 per tick
Initial Margin: ~$1,500
The options strategy discussed here is based on the standard Gold Futures (GC), but micro-sized versions could be explored by traders with lower capital exposure preferences.
The Trade Plan: Long Strangle on Gold Futures
Here's how the trade comes together:
Strategy: Long Strangle using Gold Futures options
Direction: Non-directional
Instruments:
Buy 3440 Call (Oct 28)
Buy 3345 Put (Oct 28)
Premium Paid: $173.73 (per full-size GC contract)
Max Risk: Limited to premium paid
Breakeven Points on Expiration:
Upper Breakeven: 3440 + 1.7373 = 3613.73
Lower Breakeven: 3345 – 1.7373 = 3171.27
Reward Potential: Unlimited above breakeven on the upside, substantial below breakeven on the downside
R/R Profile: Defined risk, asymmetric potential reward
This setup thrives on movement. Whether Gold rallies or plunges, the trader benefits if price breaks and sustains beyond breakeven levels by expiration.
Risk Management Matters More Than Ever
The strength of a Long Strangle lies in its predefined risk and unlimited reward potential, but that doesn’t mean the position is immune to pitfalls. Movement is key — and time decay (theta) begins to erode the premium paid with each passing day.
Here are a few key considerations:
Stop-loss is optional, as max loss is predefined.
Precise entry timing increases the likelihood of capturing breakout moves before theta becomes too damaging. Same for exit.
Strike selection should always balance affordability and distance to breakeven.
Avoid overexposure, especially in low volatility environments that can lull traders into overtrading due to the potentially “cheap” options.
Using strategies like this within a broader portfolio should always come with well-structured risk limits and position sizing protocols.
When charting futures, the data provided could be delayed. Traders working with the ticker symbols discussed in this idea may prefer to use CME Group real-time data plan on TradingView: www.tradingview.com - This consideration is particularly important for shorter-term traders, whereas it may be less critical for those focused on longer-term trading strategies.
General Disclaimer:
The trade ideas presented herein are solely for illustrative purposes forming a part of a case study intended to demonstrate key principles in risk management within the context of the specific market scenarios discussed. These ideas are not to be interpreted as investment recommendations or financial advice. They do not endorse or promote any specific trading strategies, financial products, or services. The information provided is based on data believed to be reliable; however, its accuracy or completeness cannot be guaranteed. Trading in financial markets involves risks, including the potential loss of principal. Each individual should conduct their own research and consult with professional financial advisors before making any investment decisions. The author or publisher of this content bears no responsibility for any actions taken based on the information provided or for any resultant financial or other losses.
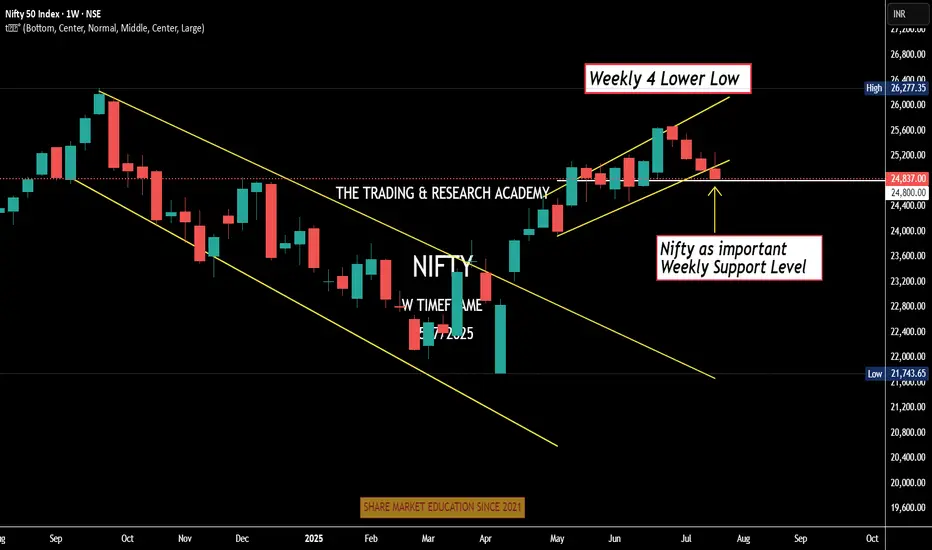
Weekly Nifty Analysis Next week, can we have a small bounce in #Nifty?
4 Lower Low
Daily channel Breakdown
Index at crucial weekly support level
Can one bullish week / Doji be expected. One news here or there & boom!
We have monthly expiry this week, let's see.
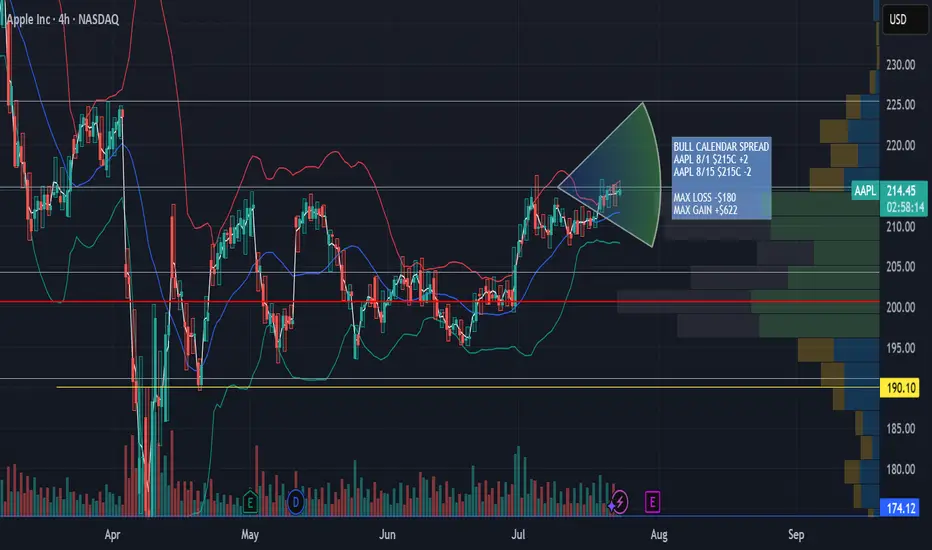
AAPL Aug 1st - Aug 8th 215 Calendar Call SpreadAAPL Aug 1st - Aug 8th 215 Calendar Call Spread
AAPL earnings after market close 7/31/25. Looking for an upward move into earnings with resistance at $225 then retesting support at $215. This zone falls between the .5 and .618 fib retracement. Great risk/ reward ratio 3.5:1
CHTR Charter Communications Options Ahead of EarningsIf you haven`t bought CHTR before the previous earnings:
Now analyzing the options chain and the chart patterns of CHTR Charter Communications prior to the earnings report this week,
I would consider purchasing the 387.5usd strike price Calls with
an expiration date of 2025-7-25,
for a premium of approximately $22.55.
If these options prove to be profitable prior to the earnings release, I would sell at least half of them.
Disclosure: I am part of Trade Nation's Influencer program and receive a monthly fee for using their TradingView charts in my analysis.
