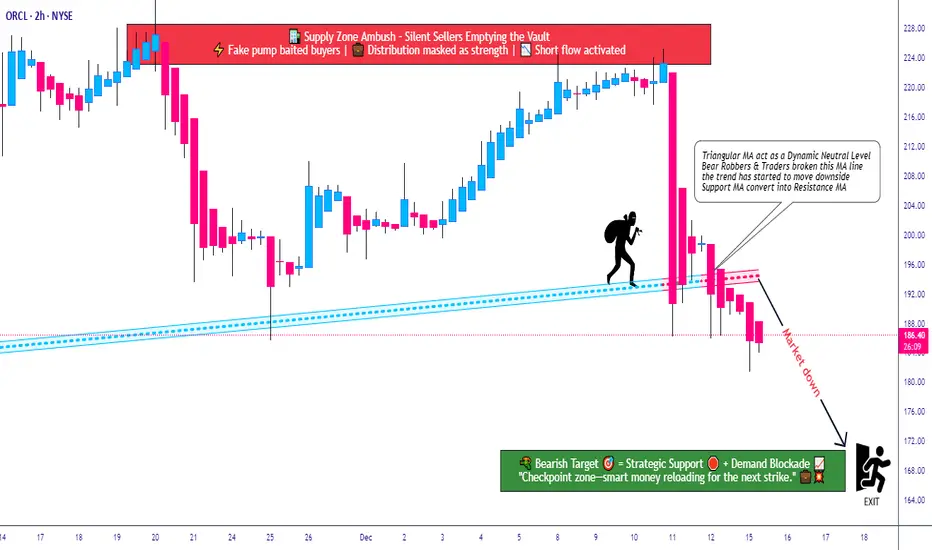
ORCL Breakdown Zone Activated — Downside Pressure Builds!🔻 ORCL Bearish Breakdown Playbook | Smart Money Trap Ahead? 🔻
📌 Asset
ORCL — Oracle Corporation
NYSE Exchange | Stock Market
Trading Style: Swing / Day Trade
📉 Market Bias
Bearish Structure Confirmed
Price action confirms a Triangular Moving Average (TMA) breakdown, signaling momentum exhaustion and increasing downside probability. Sellers remain in control as volatility expands after the structure break ⚠️📊
🎯 Trade Plan (Thief Style – Market Adaptive)
🔹 Entry:
Market-responsive entry — no fixed price level.
(Allow price to confirm direction; avoid emotional entries 🧠)
🔹 Stop Loss:
🛑 Thief SL reference: 205.00
This level is shared for educational context only. Risk management remains fully trader-dependent.
📝 Note:
Dear Ladies & Gentlemen (Thief OG’s), this is not a recommendation to use only this stop loss. You manage risk according to your own strategy and comfort.
🔹 Target Zone:
🎯 170.00
This level aligns with:
✔ Strong historical support
✔ Oversold conditions
✔ Potential liquidity trap
✔ Correlation-based confluence
⚠️ As price approaches this zone, partial or full profit protection is advised. Smart exits matter more than perfect targets.
📝 Note:
Dear Ladies & Gentlemen (Thief OG’s), this target is not mandatory. Adapt your take-profit based on live price behavior and personal risk rules.
🔗 Correlated Markets to Watch 👀
📌 NASDAQ:QQQ – Nasdaq weakness often amplifies downside pressure on ORCL due to tech sector correlation.
📌 NASDAQ:MSFT – Relative weakness here can signal broader enterprise-tech selling.
📌 NASDAQ:AAPL – Risk-off sentiment in mega-caps may accelerate momentum continuation.
📌 TVC:DXY – Dollar strength can pressure equities, supporting bearish follow-through.
➡️ If correlated assets show risk-off behavior, ORCL downside probability increases.
🧠 Key Takeaways
✔ Trend bias favors sellers
✔ Breakdown structure validated
✔ Risk management > prediction
✔ Adapt to price, don’t marry levels
⚠️ Disclaimer
This is a thief-style trading strategy, shared for fun and educational purposes only.
Trading involves risk. You are fully responsible for your decisions and outcomes.
✨ “If you find value in my analysis, a 👍 and 🚀 boost is much appreciated — it helps me share more setups with the community!”
#ORCL #Oracle #BearishSetup #StockMarket #SwingTrading
#DayTrading #TechnicalAnalysis #SmartMoney
#NYSE #TradingView #RiskManagement #ThiefStyle
Oraclestocks
Oracle (ORCL) shares surge 24% in a week, hitting all-time highOracle (ORCL) shares surge 24% in a week, hitting an all-time high
Last week, Oracle (ORCL) shares:
→ rose by approximately 24% — marking the strongest weekly gain since 2001;
→ broke through the psychological level of $200 per share;
→ reached an all-time high, with Friday’s session closing above $215. It is possible that a new record may be set this week.
What’s driving Oracle (ORCL) shares higher?
The main catalyst was the quarterly earnings report released last week:
→ Earnings per share ($1.70) exceeded analysts’ expectations ($1.64);
→ CEO Safra Catz projected revenue growth of 12–14% in upcoming quarters;
→ Company founder Larry Ellison highlighted “astronomical” demand for data centres, as well as Oracle’s competitive edge in building and servicing them.
Notably, Oracle provides infrastructure services for both OpenAI and Meta Platforms.
Technical analysis of ORCL shares
ORCL shares have shown high volatility throughout 2025, largely influenced by news surrounding Donald Trump. His promises to strengthen the US position in AI served as a bullish signal, while plans to impose international trade tariffs had a bearish impact.
As a result, a broad upward channel has formed on the chart, with the following key observations:
→ the price has repeatedly bounced sharply from the lower boundary (1), indicating strong demand;
→ by early June, the price had risen and stabilised near the channel’s median line (2).
Currently, the ORCL chart shows that the earnings-driven rally has pushed the price into the upper quartile (3) of the channel.
With the RSI indicator at extreme highs, it is reasonable to assume that ORCL may be vulnerable to a pullback. However, if a correction does occur, it is unlikely to be deep — perhaps testing the psychological $200 level — given the company’s strong fundamentals.
This article represents the opinion of the Companies operating under the FXOpen brand only. It is not to be construed as an offer, solicitation, or recommendation with respect to products and services provided by the Companies operating under the FXOpen brand, nor is it to be considered financial advice.

Oracle: Tilting Downward…After a sharp rebound from the $152.02 support following the steep drop from the peak of the beige wave II, Oracle is once again tilting downward as expected. The next step should see the price fall below $152.02 to reach the projected low of the beige wave III. After a countermovement of wave IV, the broader downward movement as part of the beige five-wave decline should extend further, ultimately driving the stock to the low of the overarching blue wave (A). If Oracle instead breaks above the $198.31 resistance in the short term, the macro-level light green wave alt. will rise to a new high. However, this alternative scenario holds only a 34% probability. Primarily, we assume that wave was completed with the December peak.

Oracle: Correction Started!Although ORCL is currently still trading above the $147.50 support level, we believe the green wave has reached its peak. This implies that the overall upward trend has concluded, and we anticipate a significant correction moving forward. This correction should unfold in five parts, with the beige wave I extending well below the $147.50 level. Afterward, we foresee a corrective counter-movement back above $147.50 during wave II before the price resumes its downward trajectory.

Oracle attacks pivotal resistance - AnalysisOracle Corporation's stock (ORCL) extended its gains and tackled the pivotal resistance of 84.50, amid the dominance of the upward correctional short-term trend, while buoyed by trading above the 50-day SMA, with positive signals from the RSI.
Therefore we expect more gains for the stock, targeting the resistance of 90.70, provided the resistance of 84.50 was breached.
