BITCOIN Institutional Levels: Buy 94.4k–92.6k → Target 98k–100k🔱 BITCOIN SMC OUTLOOK — EXECUTIVE SUMMARY M30 TF
✨ Bitcoin remains in bullish market structure with higher-timeframe continuation bias
🟢 Trend context: Accumulation → Expansion sequence still intact
🧱 Bullish Breaker Blocks:
• 94,400 (primary BB – first dip zone)
• 92,600 (secondary BB – deeper mitigation)
🟩 Bullish Order Block: 90,600 (last-defense demand)
🔺 MTF Bearish Order Block: 98,000 (HTF supply / reaction zone)
💧 Sell-Side Liquidity Pool: 98,000 → 100,000 (equal highs / psychological round number)
📈 Bias remains bullish while price holds above 90,600
🚀 Expect continuation toward overhead sell-side liquidity after mitigation
⏳ Short-term consolidations likely before expansion legs
⚠️ Invalidation: sustained acceptance below 90,600
🎯 Strategy:
Accumulate dips into Bullish Breaker Blocks, scale out into fresh sell-side liquidity above 98k
🏦 Expect profit-taking and reaction near 98k–100k before next directional decision
________________________________________
🗳️ BITCOIN M30 SCENARIOS — WHAT’S YOUR PLAY?
Which path do you see for BTC next?
🅰️ Hold 94.4k BB → continuation toward 98k–100k liquidity sweep
🅱️ Deeper mitigation into 92.6k BB, then expansion higher
🅲 Full draw into 90.6k OB, strong reaction → continuation leg
🅳 Your level: drop the BTC price you’re watching most next
All levels generated automatically with ProjectSyndicate Free Indicators.
Order Block Finder | Gold | ProjectSyndicate
Breaker Blocks Finder | Gold | ProjectSyndicate
Orderblock

EURUSD D1 Bearish Outlook After Equal Highs Sweep$FOREXCOM: EURUSD EURUSD daily timeframe, Price was bullish earlier and then moved into the premium zone.
At the top, equal highs were formed where buy-side liquidity was present.
Price moved above those highs, swept the liquidity, and faced strong rejection.
After this rejection, the market character changed.
Buyers became weak and a bearish structure was confirmed.
A downside break of structure has also occurred.
Now the expectation is that price will sell from the equal highs area
and gradually move down toward the order block and the previous low.
The upper area is a zone of resistance, which is also the weekly high, and below there is support.
If a daily candle gives a strong close above the equal highs,
this view will be invalidated.

Gold Weekly Levels: Break above 4555 → 4625/4635🔱 GOLD WEEKLY SNAPSHOT — EXECUTIVE SUMMARY
✨ Bulls remain in control as price transitions into the Wave-5 extension sequence
🟡 Key unlock level: 4555 — a clean break/acceptance above opens continuation fuel
🚀 Wave-5 extension target: 4625–4635 (primary upside objective / price discovery ceiling)
🧲 Fresh overhead sell-side liquidity: 4625–4635 = high-probability “max-out + reversal” zone
🔄 Expectation after 4625–4635: corrective rotation lower profit-taking + liquidity sweep
🛡 Bull structure remains intact while above: 4350 first major buy-side pool
⚠️ Bears’ post-extension objectives: 4350 → 4275 fresh buy-side liquidity targets
🎯 Strategy this week: trade with the trend into 4625–4635, then shift mindset to correction timing
🏦 Core play: don’t chase highs under 4625–4635; scale out into target, then stalk reversal setup
________________________________________
🗳️ Gold Weekly Scenarios — What’s Your Play?
Which path do you have for XAUUSD next week?
🅰️ Hold above 4555 → wave-5 extension triggers → 4625–4635 sweep
🅱️ Fakeout / dip under 4555 early week → reclaim → squeeze into 4625–4635
🅲 Direct drive into 4625–4635 → rejection confirms reversal → correction targets 4350/4275
🅳 Your key level: 4555
________________________________________
🔥 GOLD WEEKLY SNAPSHOT — BY PROJECTSYNDICATE
🏆 Swing Structure
Gold is still operating in a bull-controlled tape, but this week is about finishing the move:
• 4555 is the trigger level that opens the door for continuation.
• Once continuation engages, the market is likely to seek a final liquidity run into 4625–4635.
• That zone is important because it’s not just a target — it’s fresh overhead sell-side liquidity, meaning it’s where late longs get trapped and smart money sells into strength.
• After the sweep completes, the roadmap flips: correction phase begins, with bears likely targeting fresh buy-side liquidity at 4350 and 4275.
________________________________________
📈 Trend
Higher-timeframe bias
Primary bias remains bullish, with the market positioned for a Wave-5 extension.
Tactical
This week is likely to trade in two phases:
Phase 1: Continuation & Extension
• Bulls defend structure, build pressure, then break 4555
• Momentum rotates higher as stops/liquidity fuel expansion
• Price seeks the 4625–4635 magnet
Phase 2: Max-Out & Correction
• Once 4625–4635 is tagged/swept, upside becomes asymmetric risk
• Expect rejection behavior stall → wick → displacement down
• Market shifts to “where’s the next liquidity pool?” → 4350, then 4275
________________________________________
🛡 Supports — Demand / Buy-Side Liquidity Zones
4555 Pivot / Trigger
This is the most important tactical level this week:
• Above it: continuation bias stays active
• Below it: market may chop, reload, or run a dip-reclaim pattern
4350 Fresh buy-side liquidity
• This is a post-extension magnet.
• If Wave-5 completes near 4625–4635, 4350 becomes the first major “bear target”.
• Also likely to act as a reaction zone once tagged.
4275 Fresh buy-side liquidity
• Secondary downside objective once 4350 is taken.
• Often the “final grab” zone that completes the correction leg.
• Expect increased bid interest here after liquidity is swept.
________________________________________
🚧 Resistances — Upside Objectives / Wave-5 Expansion Targets
4555 Breakout gate
• Break + acceptance = green light
• Rejection + failure = delay, not necessarily reversal until 4625–4635 is visited
4625–4635 Wave-5 extension + fresh sell-side liquidity
This is the main event:
• The market is expected to run this zone because it holds fresh overhead liquidity
• This is where you expect:
o stop runs
o late FOMO entries
o liquidity sweep behavior
o reversal conditions forming
Trade mindset at 4625–4635:
✅ take profits / reduce risk
❌ don’t initiate fresh longs late into the zone (unless you’re scalping with strict rules)
________________________________________
🧭 Bias Next Week
Primary bias: bullish continuation into 4625–4635, then correction expected.
What you’re trading this week:
• Bulls: break 4555 → push extension
• Bears: wait for 4625–4635 sweep → trigger correction → target 4350/4275
________________________________________
⚖️ Base Case Scenario Most likely path
Early week: pressure + positioning
• Market holds firm and works around the pivot zone
• Any dips are likely corrective and designed to reload liquidity for the break
Mid-week: trigger + acceleration
• 4555 breaks/holds
• Momentum expands; price begins seeking the upper liquidity pool
Late week: target hit + reversal risk increases sharply
• Price reaches 4625–4635
• Expect “max-out” behavior:
o stall / compression at highs
o wick sweeps
o sharp rejection candles
• Once rejection confirms, correction leg begins targeting:
o 4350 first
o 4275 next
________________________________________
🚀 Breakout / Invalidation Triggers
✅ Bullish confirmation trigger
Clean break + acceptance above 4555
• Confirms Wave-5 continuation is active
• Increases probability of reaching 4625–4635
⚠️ “Max-out” reversal trigger (what you’re watching at the top)
Sweep into 4625–4635 + rejection
Common confirmation behaviors:
• quick spike into the zone, then close back below
• repeated failure to hold above 4630-ish
• sharp displacement down after a liquidity grab
✅ Bearish continuation trigger
Rejection confirmed from 4625–4635 + breakdown through local supports
• Opens correction flow into 4350, then 4275
________________________________________
🔓 Bull / Bear Structural Lines
🟢 Bull control line: Above 4555
🟡 Transition line: 4625–4635
🔴 Bear objective line: Below post-top breakdown correction seeks 4350 → 4275
________________________________________
🧭 Recommended Strategy Framework
1️⃣ Primary Play — Ride Wave-5 into the extension
Idea: Bulls maintain control → break 4555 → push into 4625–4635
• Build exposure only when the market proves it can hold above 4555
• Prefer entries on:
o reclaim/hold of 4555
o shallow pullbacks that respect the breakout structure
• Risk management focus: avoid chasing once price is extended and nearing 4625–4635
2️⃣ Profit-taking Plan — Scale out into 4625–4635
This is your sell-side liquidity zone:
• Reduce longs into the target
• Tighten risk aggressively
• Assume reversal risk rises the closer price gets to 4635
3️⃣ Secondary Play — Hunt the correction AFTER the sweep
Once Wave-5 extension completes:
• Bears likely target fresh buy-side liquidity:
o 4350
o 4275
Correction mindset:
• First drop often sharp (trap release)
• First bounce likely around 4350
• If 4350 breaks clean, expect continuation into 4275
________________________________________
✅ Weekly Levels
• 4555: breakout gate / continuation trigger
• 4625–4635: wave-5 extension + sell-side liquidity (reversal window)
• 4350: buy-side liquidity target #1 (post-top correction)
• 4275: buy-side liquidity target #2 (deeper correction objective)

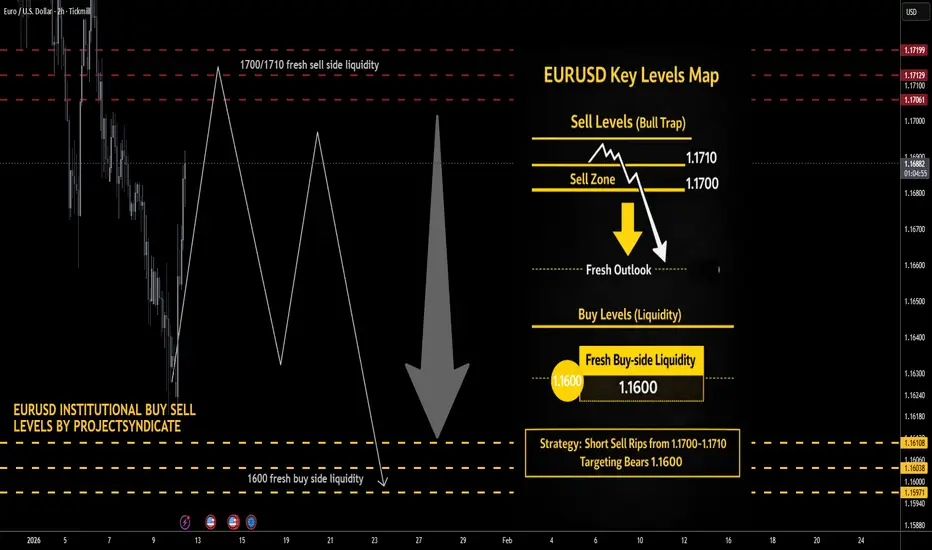
EURUSD Liquidity Trap Short: Sweep 1.1700–1.1710 → Sell the Rip🔱 EURUSD WEEKLY SNAPSHOT — EXECUTIVE SUMMARY
✨ EURUSD positioned in a sell-the-rip environment
📍 Current context: price is below your premium sell liquidity pocket, favoring corrective rallies into resistance
🧱 Fresh sell-side liquidity: 1.1700 – 1.1710
💧 Fresh buy-side liquidity: 1.1600
📉 Bias: bearish while price fails to accept above 1.1710
⏳ Expectation: rallies get capped into 1.1700–1.1710 then delivery toward 1.1600
⚠️ Invalidation: sustained acceptance above 1.1710
🎯 Downside liquidity target this week
• Primary TP and full exit: 1.1600
🎯 Strategy: short sell rips into overhead resistance
🏦 Larger accumulation is more likely only after liquidity is swept near or below 1.1600
________________________________________
🧠 EURUSD MARKET LOGIC — Institutional Read
• Sellers defend premium zones, buyers are reactive
• Upside without acceptance is distribution
• The clean narrative is premium liquidity tap then bearish shift then delivery to 1.1600
• Expect volatility spikes around scheduled macro events this week, plan entries with confirmation
________________________________________
🎯 EXECUTION PLAN — SHORT FROM OVERHEAD RESISTANCE
✅ Entry zone: 1.1700 – 1.1710
Trigger options, pick one
1. Sweep above 1.1700–1.1710 then sharp rejection and close back below 1.1700
2. Lower timeframe market structure shift bearish after tapping the zone, then sell the retest
3. Tap zone then strong bearish displacement candle, enter on pullback into that move
🛑 Risk control
• Hard invalidation: sustained acceptance above 1.1710
• Practical stop placement: above 1.1720–1.1730 to allow for stop hunts
🎯 Take profit
• Full exit: 1.1600
Optional management
• Partial de-risk at intermediate supports on the way down, then trail toward 1.1600
________________________________________
🗳️ EURUSD WEEKLY SCENARIOS — WHAT’S YOUR PLAY
Which path do you expect for EURUSD this week?
🅰️ Tags 1.1700–1.1710 then rejects cleanly then sells off to 1.1600
🅱️ Range grind below 1.1700 then liquidity builds then breakdown to 1.1600
🅲 Wick above 1.1710 bull trap then sharp rejection then impulsive drop to 1.1600
🅳 Your level: drop ONE price you’re watching most this week
________________________________________
🧩 LEVELS QUIZ — EURUSD TRADERS
1. If you’re bearish and want to short from premium, which zone is the best sell idea this week
A 1.1600
B 1.1700–1.1710
C 1.1500
2. What level is the planned full exit and liquidity draw
A 1.1710
B 1.1660
C 1.1600
3. What behavior most strongly invalidates the short idea
A Quick wick above 1.1710 then back below
B Sustained acceptance above 1.1710
C Slow drift down from 1.1680
4. True or False
A sweep into 1.1710 followed by a bearish close back under 1.1700 is a high-quality short trigger
Reply with your answers like this 1B 2C 3B 4True
Gold Tutorial : How to Trade GOLD with Syndicate Order BlockGold Tutorial : How to Trade GOLD with Syndicate Order Block
🥇 Practical Gold Tutorial (Updated): How to Trade XAUUSD with Syndicate Order Block Finder
✅1) Setup (TradingView)
Step A — Add the script
Open XAUUSD on TradingView
Indicators → search: Order Block Finder | Gold | ProjectSyndicate
Add to chart
Step B — Pick your workflow timeframe
Use this simple map (it keeps you consistent):
H4 / H1 = Zone discovery (major OBs)
M30 = Trading plan + cleaner execution
M10 / M5 = Sniper entries + tight invalidation
🛠️ 2) Recommended Settings by Timeframe
Use these presets as your “Gold defaults”:
M5: Swing Length 5–7, Displacement 1.2–1.4
M10: Swing Length 5–7, Displacement 1.2–1.4
M30: Swing Length 5–7, Displacement 1.2–1.4
H1: Swing Length 7–9, Displacement 1.3–1.6
H4: Swing Length 8–10, Displacement 1.5–2.0
💡 Quick rule:
Want more signals → reduce Swing Length
Want higher quality only → increase Displacement
3) What the boxes mean (fast + practical) 📌
Bullish OB (Demand): last bearish candle before strong bullish displacement + BOS
Bearish OB (Supply): last bullish candle before strong bearish displacement + BOS
Auto-cleanup: zones disappear when invalidated (keeps chart clean)
4) The Syndicate OB Workflow (repeatable daily) 🔁
Step 1 — Find the nearest OBs above & below price
You want two “appointment levels”:
Closest buy OB below price
Closest sell OB above price
Step 2 — Wait for price to return to the OB
No return = no trade. Gold loves fakes.
Step 3 — Use OB boundary as invalidation
Long invalidation = below buy OB
Short invalidation = above sell OB
Step 4 — Target the next opposing OB
Longs target nearest sell OB
Shorts target nearest buy OB
This is how you trade zone-to-zone, not vibes.
5) Real Example from Friday: 4466 Buy OB & 4514 Sell OB
✅ 4466 = Buy Order Block (Demand)
✅ 4514 = Sell Order Block (Supply)
Think of this as an institutional “range.” Price often reacts strongly at these zones.
📈 Sample Trade A — Long from 4466 → Target 4514
Higher timeframe plan (H1 / M30)
Identify 4466 buy OB as demand
Main target = 4514 sell OB
You only execute once price taps the zone
Execution on M10 / M5 sniper mode 🎯
When price hits 4466, drop to M10 or M5 and wait for ONE of these triggers:
✅ Trigger #1 (clean): bullish displacement candle closes away from the OB
✅ Trigger #2 (safe): price reclaims OB midpoint and prints a higher low
✅ Trigger #3 (aggressive): first tap entry at the OB (small position, strict stop)
Stop-loss: a few dollars below the OB low (zone boundary = invalidation)
Take-profit plan:
TP1: first bounce / nearby structure (partial)
TP2: 4514 sell OB (main target)
📉 Sample Trade B — Short from 4514 → Target 4466
Higher timeframe plan (H1 / M30)
Identify 4514 sell OB as supply
Main target = 4466 buy OB
Execute only after price taps 4514 and shows rejection
Execution on M10 / M5
When price hits 4514, drop to M10 or M5 and wait for:
✅ Trigger #1 (clean): bearish displacement candle closes away from the OB
✅ Trigger #2 (safe): price breaks a micro-structure low (M5 BOS down)
✅ Trigger #3 (aggressive): first touch entry at the OB with strict invalidation
Stop-loss: a few dollars above the OB high
Take-profit plan:
TP1: first drop / micro swing low (partial)
TP2: run toward 4466 buy OB (main opposing demand)
⭐ Why M5/M10 helps here:
Gold often “wicks” the OB before moving
M5 structure shift confirms the rejection without you guessing
⚠️6) The #1 Gold mistake (and the fix)
❌ Entering before price reaches the OB
✅ Fix: treat OBs like appointments, not predictions
4466 = long appointment
4514 = short appointment
You don’t trade because you “think” — you trade because price is at the level.
✅7) Quick Entry Checklist
Before clicking buy/sell:
✅ Price touched the OB
✅ You got a trigger on M5/M10
✅ You know exactly where invalidation is
✅ You have a clean target
✅ You’re in a liquid window
If you have 4/5, it’s usually a valid attempt.
🔒8) Turn this into a repeatable edge
Do this daily:
Mark nearest buy OB below + sell OB above
Only trade when price hits them
Use M5/M10 for entries, M30/H1 for targets and context
This is how you trade Gold like a sniper instead of chasing candles.

SUI M30 FVG Rejection and Continuation Setup📝 Description
On the M30 timeframe, CRYPTOCAP:SUI is pressing into a clear H1 supply / Order Block while still trading under a descending structure. The current pause under the zone looks like a controlled reaction rather than acceptance, keeping the probability of a downside continuation toward lower inefficiencies active.
________________________________________
📈 Signal / Analysis
Primary Bias: Bearish while below the 1.82 area
Preferred Setup:
• Entry: 1.8 (30m FVG rejection)
• Stop Loss: Above 1.815
• TP1: 1.784
• TP2: 1.764
• TP3: 1.745
________________________________________
🎯 ICT & SMC Notes
• Reaction inside an unmitigated H1 Order Block / supply
• Downside targets align with M30 inefficiency (FVG) and liquidity draws
• No bullish CHOCH/BOS confirmed to justify a reversal narrative
________________________________________
🧩 Summary
CRYPTOCAP:SUI is reacting at a higher-timeframe supply zone, and as long as price stays capped below the H1 OB, the move is treated as a pullback. Rejection from this area keeps TP1–TP3 in play, with 1.745 as the deeper draw.
________________________________________
🌍 Fundamental Notes / Sentiment
Stronger USD supports tighter financial conditions, reducing risk appetite. In this environment, risk assets like crypto remain vulnerable, keeping SUI biased to the downside.
________________________________________
⚠️ Risk Disclosure
Trading involves substantial risk and may result in capital loss. This analysis is for educational purposes only and does not constitute financial advice. Always apply proper risk management, predefined stop-loss levels, and disciplined position sizing aligned with your trading plan.

NVIDIA (NVDA) H4 | Bullish Continuation Setup After ATH ReversalNVIDIA (NVDA) NASDAQ H4 Timeframe Analysis NVIDIA recently showed a reaction from its All-Time High (ATH), where a clear reversal was observed. After forming the top, the price moved down and swept the sell-side liquidity, indicating that smart money has completed the downside inducement. Currently, the price is trading around a key bullish order block, which aligns with the sell-side liquidity grab. This confluence significantly strengthens the chances of a bullish momentum continuation.
Market Structure Insight
ATH formed _ short-term reversal observed
Sell-side liquidity has been taken
Price respected the bullish order block
Momentum is shifting back.
This suggests that the market is preparing for a bullish expansion phase.
Buy Trade Plan
Entry Level: 177.52
Stop Loss: 168.00
Targets:
TP1: 187.00
TP2: 199.00
Major Target: 211.00
Disclaimer
This chart is for educational purposes only and does not constitute financial advice. Trading involves high risk; always conduct your own research and use proper risk management.

EURUSD analyticsAfter the downward movement on the chart, there was an upward wave. It began with the formation of an order block at the bottom. Then we saw a return to the order-block zone with a strong bullish candle.
In addition to this, I also see potential Wyckoff accumulation here, which can also reverse the price.
I expect a move toward the upper order block during this week.

GOLD Again Buy OpperunityGold excite Point of interest area (POI) , where have Major POI ,Valid order block and also FVG , trend-line 3rd touch , Liquated Area and Fixed Volume Range

XAUUSD 15m intraday trade ideaXAUUSD key level at 4335, major demand zone + resistance becomes support + bullish engulfing orderblock. Expecting a reaction on this level

Order Block Rejection Toward Liquidity TargetsThis 4-hour USD/JPY chart shows a recent bearish shift after price rejected an identified Order Block and partially filled a Fair Value Gap (FVG) before continuing downward. The broader context includes a previously broken descending channel and a current retracement into a supply zone, suggesting bearish continuation. The chart highlights a clean inefficiency zone (FVG) serving as a potential mitigation point, from which sellers appear to be stepping in. Price is currently trading around 155.20, with projected downside continuation toward two marked liquidity levels.
Targets
1st Target: 154.058
2nd Target: 152.999

TRX / USDT PERP – 4H Trade IdeaTRX is currently trading below a bearish order block, after a clear market structure break (MSB) to the downside.
🔴 Short bias
Rejection from bearish OB
MSB confirmed
No bullish displacement yet
Short idea
Entry: rejection at current OB zone
Invalidation: clean 4H close above the OB high
Targets:
This setup only remains valid as long as price stays below the OB.
What’s your bias here?
MrC

TOTAL MARKET CAP – HTF Context / LTF PlanPrice is currently trading inside the 4H bullish order block.
This zone previously acted as strong demand and is now being respected again.
At the moment, price is still inside a no-trade zone
Liquidity is being built and structure is not yet confirmed.
Bias: cautiously bullish
Plan: patience → confirmation → execution
What I’m waiting for:
A clear AMD sequence
(Accumulation → Manipulation → Distribution)
Ideally:
Short-term sweep into the lower part of the 4H OB
Reaction + displacement to the upside
Market Structure Shift (MSS) on lower timeframes
Optional confluence:
1H / 15m FVG tap
Strong bullish candle close with volume expansion
Invalidation:
Clean breakdown and acceptance below the 4H bullish OB
Failure to reclaim internal structure after a sweep
If AMD plays out correctly, this area offers a high R:R long opportunity targeting:
Internal range highs
Higher timeframe imbalance
Potential continuation towards previous highs
Until then: no FOMO, no early entries.
Let price come to us.
MrC

TOTAL Market Cap (4H) – Structure UpdatePrice has expanded lower after failing to reclaim prior range highs and remains below HTF supply.
Key observations
Clear 4H bearish MSS
Strong rejection from the bearish order block (3.10–3.18T)
Price broke below rising channel support
Previous support now acting as resistance
No bullish displacement or acceptance back above the OB
Liquidity & targets
First downside draw: 2.83T (4H bullish OB)
If that level fails → next target around 2.74T
Any reaction at 2.83T needs confirmation, otherwise continuation lower
Bias
Bearish
As long as price stays below 3.05–3.10T, downside remains likely
Pullbacks into resistance without acceptance = sell-the-rally
Only a strong reclaim above HTF supply invalidates the bearish bias
Execution note
It’s Monday, so I’m waiting for the Monday range to fully form.
I’ll only look for trade setups after the range is set and structure confirms.
Mr C

XAGUSD (Silver) – 1-Hour Timeframe Tradertilki AnalysisMy friends, good morning,
I have prepared an XAGUSD-Silver analysis for you on the 1-hour timeframe.
My friends, if XAGUSD-Silver reaches the levels between 60.69393 and 60.11226, I will open a buy position and target the 63.16603 level.
My friends, I share these analyses thanks to each like I receive from you. Your likes increase my motivation and encourage me to support you in this way.🙏✨
Thank you to all my friends who support me with their likes.❤️

DEGEN short trade ideaDEGEN has recently broken its ascending trendline on the 1H timeframe, signaling a potential shift in short term market structure.
Price is currently trading inside a higher timeframe bearish order block on the 4H chart.
This area has previously acted as a strong reaction zone and remains an important level to monitor.
After the trendline break, price is consolidating and I am now waiting for a retest of the broken structure to assess the next move.
Key observations:
Higher timeframe bias remains bearish
Trendline on the 1H has been broken
Lower timeframe price action suggests consolidation after the break
A 4H fair value gap remains below as a potential draw on liquidity
At this stage, no trade has been taken.
I am waiting for the retest to enter this trade. No hit, no trade!
MrC

Crypto Total Market Cap HTF UpdatePrice is still ranging after a strong sell-off and trading below HTF supply.
Key observations:
Price is reacting inside a bearish order block
Range high sits around 3.18–3.22T
A push into 3.22T would likely be a buy-side liquidity grab
Many shorts are positioned below this level
No HTF acceptance above supply yet
My bias remains bearish
As long as price stays below 3.22–3.25T, downside remains likely
Any move into 3.22T without acceptance is fake breakout risk
Mid-range remains a no trade zone
If you have any questions or feedback, feel free to drop them in the comments.
Disclaimer: This is not financial advice. Just sharing my personal market view.
MrC

XAU/USD – Entry Analysis (H4)📈 XAU/USD – Entry Analysis (H4)
Our previous analysis didn’t quite reach the entry point, but the market structure is still developing nicely, and now we have a clean, rule-based long setup on the H4 timeframe.
After the CHoCH, price broke to the upside and is now expected to pull back into the FVG + Order Block zone. These two POIs align perfectly, increasing the probability that the market will collect liquidity here before continuing higher.
🎯 Entry Setup
Buy limit: 4086
Stop loss: 4062
Take profit: 4160
RRR: excellent, close to 1:3
🧠 Position Management
Once price reaches the 50% RR level (around 4123):
➡️ close 50% of the position
➡️ move the remaining stop loss to break even (4086)
This removes all risk from the trade while allowing the rest to run toward the main target at 4160.

GBP/JPY Technical OutlookMarket Bias:
Bullish bias with demand strength
Key Levels:
• Strong demand zone at lower timeframe support
• Resistance levels to monitor on higher timeframes
Reasoning:
The price shows bullish momentum supported by strong buyer interest and demand zones. Confirmation from lower timeframes will strengthen the case for upward movement. The demand from buyers creates potential for continuation higher.
Trade Idea:
Look for bullish entries upon confirmation on lower timeframes near the demand zones.
Potential Entry:
• After bullish confirmation on lower timeframes (e.g., bullish candle patterns, momentum) near demand zones

GBP/USD – 4H Technical OutlookMarket Bias:
Range (buyers holding support, sellers defending resistance)
Key Levels:
• Resistance: Major 4H zone where sellers are consistently active
• Support: Strong 4H demand + order block recently respected
• Market Structure: Price has already formed a higher high, signaling bullish intentions
Reasoning:
Price is currently trapped between a strong resistance above and a strong support/order block below.
Buyers successfully defended the support, creating a higher high — a sign of bullish strength.
However, sellers are still aggressively positioned at the resistance zone, creating a tug-of-war scenario.
Trade Idea:
Look for bullish continuation only if support continues to hold and price rejects the zone with strength.
Potential Entry:
• At/near the 4H support or after a clean bullish rejection candle
Stop Loss:
• Below the order block / support structure

Wonder Electricals Ltd Trade PlanStock has broken out and is ready for the targets mentioned in drawing as TI and T2
Pattern Observed : Symmetrical Triangle Breakout
Averaging area is also marked

WE HAVE TO READY TO SELL."After the price reacted to the H1 order block, it had a good drop, and it also formed an order block on the 2H timeframe. If it can break the bullish order block on the 2H, we can be hopeful about a trend REVELSAL!

XAUUSD-GOLD-4H / at a Crossroads: Symmetrical Triangle AnalysisDear Traders,
I’ve prepared a special XAUUSD–gold analysis for you. Gold is currently moving within a symmetrical triangle formation. If gold breaks upward within this triangle and closes a candle, the first target will be the 4160 level. If it breaks downward, the first target will be the 3800 level.
I share these insights because I truly value you. Each follower is precious to me, and together we are like a family here. Every like and show of support motivates me to continue providing these analyses. Thank you sincerely to everyone who stands by me.
With respect and affection.
-TraderTilki
