Testing a POI (Point of Interest) & Inducement FrameworkThis script is a visual aid for my personal testing of a systematic trading plan. It is designed to help me manually identify and mark key structural components on the chart. The core concepts I am testing are Trading Ranges, Inducement Levels, and Points of Interest (POI), specifically Order Flows and Order Blocks. (On this chart, an Order Flow)
This is a work in progress and represents my personal learning process. It is not intended as financial advice or a complete trading system.
Key Features I am Testing:
Trading Range Identification: The script helps mark the high and low of a defined trading range, which I identify based on a confirmed break of structure or change of character. In this case what is depicted is a change of character from Bearish to Bullish Sentiment on the EURUSD One-Hour Frame.
Inducement Visualization: It allows for the marking of key inducement levels. In my testing, an inducement is the pullback high (in a bearish move) or low (in a bullish move) immediately preceding the most recent significant low or high. A range is considered valid once its corresponding inducement is traded through.
Order Flow/Block Marking: The tool assists in highlighting potential OFs or OBs. These ranges or candles, located near range extremes, are the Points of Interest I test for potential entries.
My Testing Notes & Disclaimer:
This visual tool is part of my journaling process to build discipline and consistency. I use it to document my hypothesis for each trade setup. The market does not always respect these levels, and a key part of my testing is learning to distinguish between valid and invalid POIs.
My risk management rules are separate and non-negotiable. I always define my stop loss and position size before entering any test trade.
I am sharing this as a documentation of my own testing framework, not as a recommendation.
Orderblock
Trader Tilki | XAGUSD (Silver) 1H Analysis: Strategic Buy ZonesHello Guys,
Here’s my XAGUSD-SILVER analysis. I’ve received many requests for this, and every follower matters to me — I can’t ignore your demands.
As you know, SILVER usually moves in positive correlation with GOLD and often reacts the same way to news events.
The buy levels I’ll be watching:
🔵 BUY level: 44.66118
🔵 BUY level: 44.02180
🟢 Target level: 46.64801
🔴 Set your stop level according to your own margin.
If price reaches these zones, I’ll definitely open a buy position and take my shot.
Let’s see together how this analysis plays out.
Every like is my biggest motivation to keep sharing these analyses.
Thanks to everyone supporting and following me!

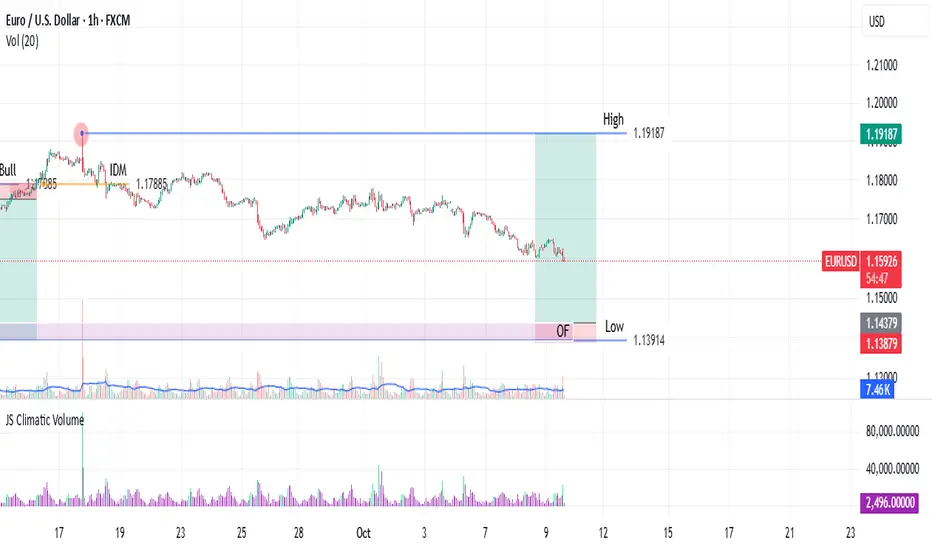
EURUSD: Big Liquidity Trap in Play – Smart Money Short AheadLiquidity sweep is done. Refined 1H supply zone above price is where Smart Money is waiting. Here’s the full breakdown 👇
🔎 Market Context
Weekly CHoCH confirmed bullish rally from 1.1608 lows.
Price swept the H Week of 1–5 → H Week of 8–12, tapping into liquidity.
Now consolidating mid-range, showing signs of distribution.
---------------------------------------------------------------------------------------------------
📌 Key Observations
Liquidity Grab above prior highs into supply.
Refined 1H POI overhead (purple zone) = high-probability short trigger.
BOS confirms bearish intent after rejection.
Multiple downside liquidity targets remain untested.
---------------------------------------------------------------------------------------------------
🎯 Trade Plan
Entry: Wait for mitigation + rejection inside 1H POI (confirmation on lower TFs).
Stops: Above 1.1784 liquidity sweep.
Targets:
TP1 → 1.1700 (first liquidity shelf)
TP2 → 1.1661 (Weekly Low 8–12)
TP3 → 1.1608 (major demand zone)
------------------------------------------------------------------------------------------------------
⚖️ Risk–Reward
Setup offers 3R–5R potential.
Bias remains bearish unless price reclaims & closes above 1.1779.
-------------------------------------------------------------------------------------------------------
📢 Final Note
This idea highlights how liquidity sweeps + POI refinement create low-risk, high-reward setups. Patience pays — don’t chase inside chop.
💬 What’s your bias on EURUSD? Do we reject the supply zone or break higher? Drop your thoughts 👇

Critical Moment for Tether Dominance – Will Wave (D) Crash the MThe chart shows that Tether Dominance is moving inside a descending channel. Based on the wave count, it seems that wave (C) has just been completed, and now we may expect a sharp wave (D) rally. Such a move could trigger a fast market downturn, as rising USDT dominance usually pressures crypto assets.
⚠️ The key condition is whether the channel bottom, which also aligns with a major order block, holds.
• If it holds → wave (D) up, strong bearish pressure on crypto.
• If it breaks → continuation of the downtrend in dominance, allowing altcoins to recover.
📊 Summary:
• Wave (C) completed
• Potential strong wave (D) up → bearish for crypto
• Condition: channel bottom must hold

Gold Analysis – 15-Minute Timeframe (September 10 , 2025)Has gold formed a Quasimodo (QM) pattern? We’re not certain yet. If price reacts from the current zone, it may retrace toward the blue area. Otherwise, one more chance for a pullback remains — a rejection from the previous high.
If that level fails to hold, gold has potential to rally toward the 3720 zone.
⛔ No entry without confirmation.
✅ Risk management is essential.
📈 Wishing you profitable and disciplined trading.

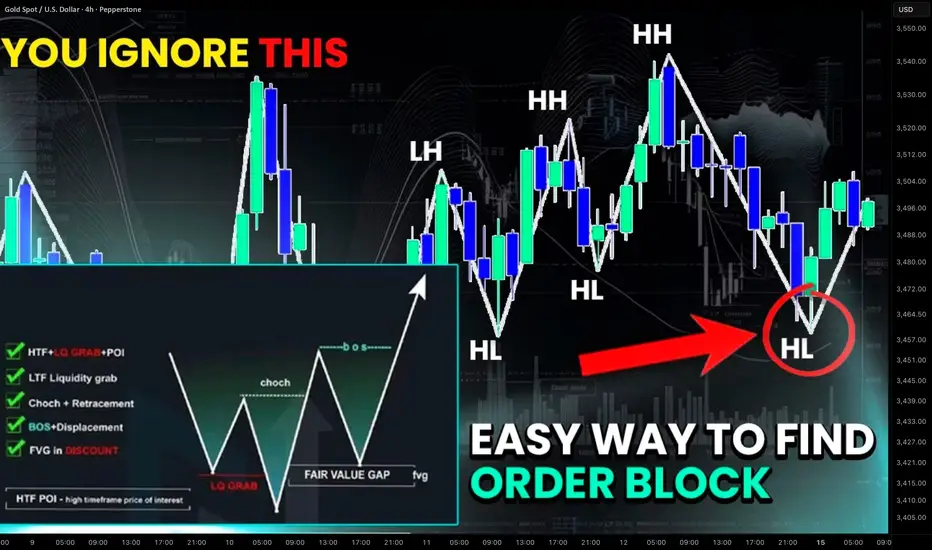
How to Find Order Block on Any Forex Pair & Gold (SMC Basics)
Order block is easier to find than you think.
I am going to reveal 2 simple price models that will help you find strong bullish and bearish order block zones on any Forex pair.
Discover how to identify OB and how to draw it properly in Smart Money Concepts SMC trading.
To effectively spot Order Block, you will need to learn basic Structure Mapping.
To find a bullish order block, you will need to learn by heart a classic bullish trend model.
According to the rules, that market is trading in a bullish trend if the price consistently updates Higher High HH and Higher Lows HL.
Such a price action confirms an uptrend .
The last higher low in that will be your Bullish Order Block.
Let me share with you a definition of a bullish order block so you could better understand its deep meaning.
Bullish order block is a significant price zone or a level where large market players (banks, institutions, hedge funds) have previously placed a high volume of buy orders, creating a strong imbalance in demand.
And what is a proof of this strong demand?
A consequent break of structure and a formation of a new higher high demonstrate a clear strength of a bullish wave that was initiated because of the activity of Smart Money.
As the market continues updating Higher Highs , remember to update Order Block. It will strictly be based on the LAST Higher Low.
Examine a price action on NZDUSD forex pair on a daily time frame.
The trend is bullish and our Order Block will be based on the last Higher Low.
To properly draw Order Block zone, its low should be based on the lowest low of a Higher Low. Its high should be based on the lowest daily candle close above a low of a Higher Low.
We will assume that huge volumes of buying orders will accumulate within that zone.
That area will provide a safe zone for us to buy the market from.
Alternatively, its violation will signify an important shift in a market sentiment.
To find a bearish order block, you will need to understand a classic bearish trend model.
According to the rules, that market is trading in a bearish trend if the price consistently updates Lower Lows LL and Lower Highs LH.
Such a price action confirms a downtrend .
The last lower high in that will be your Bearish Order Block.
And here is what exactly is a bearish order block.
Bearish order block is a significant price zone or a level where large market players - Smart Money have previously placed a high volume of sell orders, creating a strong imbalance in supply.
And what is a proof of this strong supply?
A consequent break of structure and a formation of a new lower low demonstrate a clear strength of a bearish wave that was initiated because of the activity of Smart Money.
As the market continues updating Lower Lows, remember to update Order Block. It will strictly be based on the LAST Lower High.
Please, check a price action on NZDCHF forex pair.
The market is trading in a downtrend.
Our bearish order block will be based on the last lower high .
The high of this zone will be the highest high of the last lower high.
Its low will be the highest daily candle close below the last lower high.
That zone will be a critical resistance.
Large selling volumes will be distributed within.
Once that area is tested, we can sell the market from that.
Alternatively, its bullish violation will signify a significant shift in the market sentiment.
Of course, these 2 models will not reveal all the order block on a price chart, BUT it will show you one of the most significant ones that you can rely on for safe entries for your trades.
Just learn a structure mapping in smart money concepts and use that you find powerful order block zones on any forex pair.
❤️Please, support my work with like, thank you!❤️
I am part of Trade Nation's Influencer program and receive a monthly fee for using their TradingView charts in my analysis.
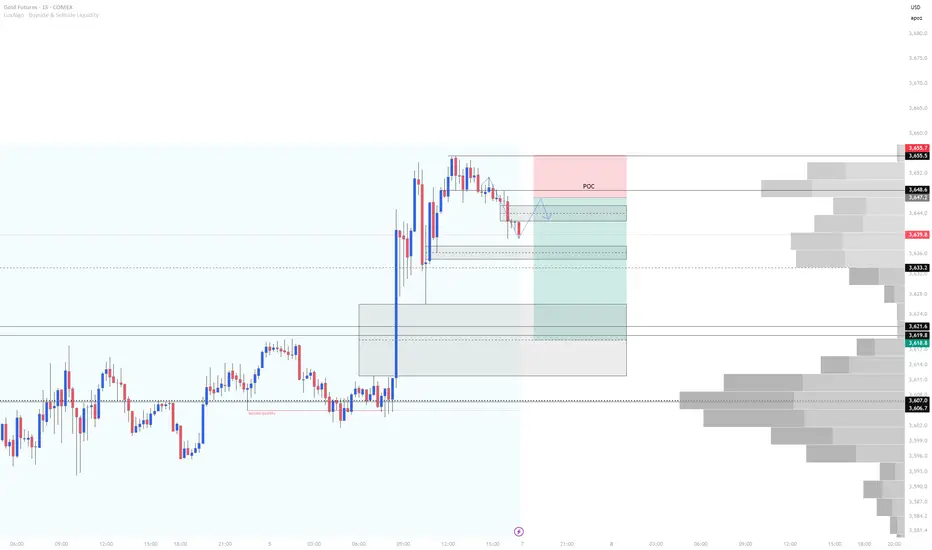
Gold Futures Short Into Asia 9/7/25Based on the current Fair Value Gap (FVG), Order Block (OB), and the liquidity resting below, I anticipate gold will retrace toward the Point of Control (POC) identified on the volume profile. This would provide an ideal setup for short-term selling opportunities during tonight’s PM session.
My expectation is for price to open lower, push into the 3658 range, and present a bearish entry signal. From there, I’ll be targeting shorts toward the equilibrium of the FVG around 3619, which also aligns closely with previous session highs and lows—adding confluence to the setup.
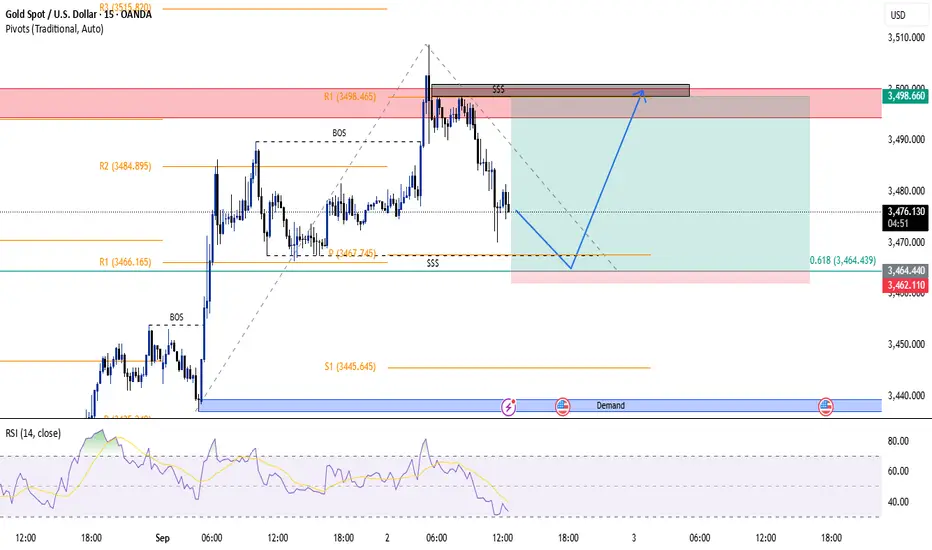
Gold Analysis – 15-Minute Timeframe (September 2, 2025)Based on a combination of my personal intuition and Smart Money Concepts (SMC), I expect the price to touch 3464 and then move upward.
✅ Reasons for this scenario:
Presence of a standard pivot around the 3464 level, which may act as a key support or resistance.
Liquidity buildup in that area, increasing the likelihood of inducement, which could fuel the upward move.
The magic Fibonacci ratio of 0.618 aligns perfectly with the last swing move, adding confluence to the setup.
📌 Entry Strategy: I plan to enter a long position upon spotting a rejection candle on the 1-minute timeframe.
Good luck and stay profitable
Gold Analysis – 15-Minute Timeframe (August 30, 2025)Considering the RSI is in overbought territory and a clear bearish divergence is present, it seems inevitable for gold to react to the highlighted resistance zone (red area).
✅ While the suggested take-profit (TP) target might be slightly ambitious—and geopolitical developments could prevent price from reaching the blue order block—technically, it's not unlikely for price to resume its bullish movement from that zone.
📌 If a valid setup forms, I’ll definitely enter a short (Sell) position.
Good luck and happy trading! 🌟

QQQ: REVERSION TO 20WK.EMA? 544-542 Zone? Upcoming seasonality is right on-time. Saw a stat which read 25 of 27 times, the market sold after Jackson Hole, Wy event with FED speaker.

XAUUSD 15m buying potentialMalaysian SNR + SMC concept with engulfing orderblock.
Entry: 3384
SL: 3380
TP: 3393

Bitcoin (BTCUSDT) – Smart Money Update🔔 Following our previous analysis predicting BTC drop to ~112k, we now update the market scenario using Smart Money & Price Action concepts.
📉 As expected, BTC entered a bearish phase after a Break of Structure (BOS) and distribution phase, currently approaching the key liquidity zone 108k–110k. This zone is a strong area for liquidity grab and institutional buy orders.
📌 Probable Scenario:
• BTC may touch 108k and then perform a corrective move to 113k–114k.
• A breakout above this range (e.g., towards 120k) is not guaranteed and requires reassessment of Price Action at that time.
🔑 Key Points (Smart Money Concepts):
• Liquidity below recent lows is still unfilled.
• The 108k–110k range acts as a higher timeframe Order Block.
• Pullback to 113k–114k could simply be a retracement to the Supply Zone.
📍 Summary:
Short-term: higher probability of BTC drop to 108k, followed by a limited recovery to 113k–114k. Further upside continuation or breakout needs reevaluation at that time.

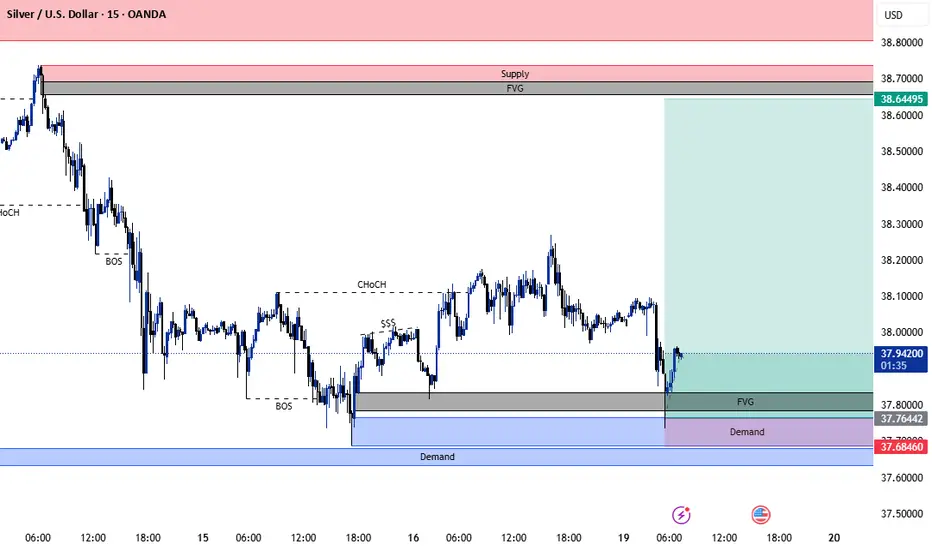
Silver Analysis – 15-Minute Timeframe (August 19, 2025)Unfortunately, TradingView doesn’t allow us to share analysis in the 1-minute timeframe. However, if you switch to the 1-minute chart yourself, you’ll be able to spot both zones clearly.
A clear structure shift has occurred, giving us two potential entry setups:
Flip Setup at the upper zone
CHoCH Setup at the lower zone
Both setups are confirmed by RSI divergence, adding strength to our entry signals.
⚠️ Risk management is essential—never trade without it. Wishing you profitable and successful trades!

Silver Analysis – 15-Minute Timeframe (August 19, 2025)As shown in the chart, price reacted to our marked zone. If we had opted for a more aggressive entry strategy, our buy order would have been triggered. This setup offered a potential opportunity for a risky long position.
🔍 In the next analysis, we’ll dive into the 1-minute timeframe to identify areas where confirmation-based entries could be considered. This will help refine our strategy and reduce exposure to unnecessary risk.
Wishing you profitable trades 💰
Is GBPUSD Setting up for a Long Swing?Hi Traders!
I've been watching this pair. It seems like it could be setting up for a long swing. I would like to see a retest around 1.34900/800, and how it reacts to that area. That'd hit a Daily Order Block. In addition, the weekly made a break of structure, and dipped into a weekly breaker OB, then pushed up. However, the only thing I don't like is it's at a weekly resistance. But, IMO the monthly looks bullish.
So, over all I'm bullish on this pair and will plan to swing, I just need my confluences to match up fully before taking this trade.
*DISCLAIMER: I am not a financial advisor. The ideas and trades I take on my page are for educational and entertainment purposes only. I'm just showing you guys how I trade. Remember, trading of any kind involves risk. Your investments are solely your responsibility and not mine.*

Gold Analysis – 15-Minute Timeframe (August 18, 2025)Currently, the first order block in the path of gold’s price action is located in the 3362–3365 range. We’re waiting for a reaction and confirmation before considering any entry.
If this zone gets invalidated, we’ll shift our focus to the next order block positioned above it. I’ll update the chart with a fresh analysis once that happens.
📌 Stay tuned for the next update.
Wishing you successful trades! 💰

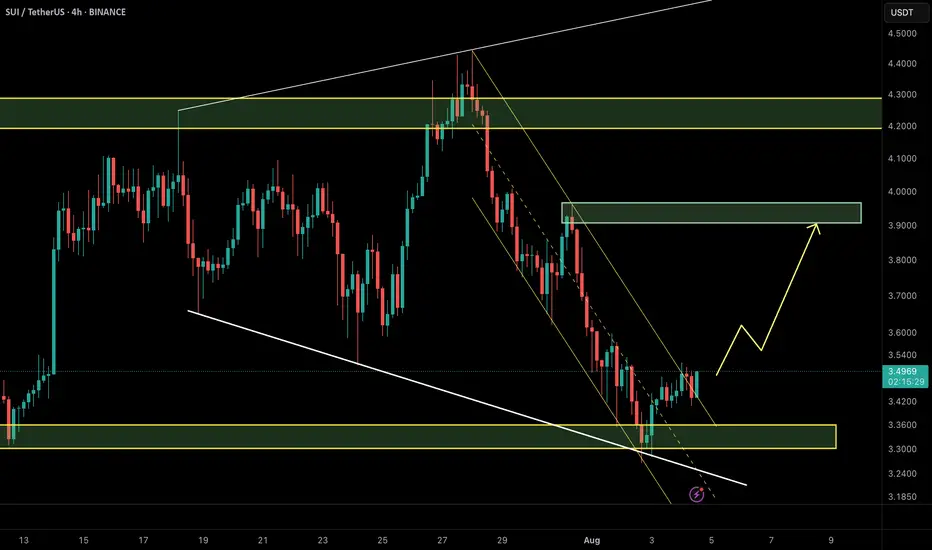
SUI – Ready to Drop from the $3.96 Supply WallSUI has rallied right into a key confluence area — the strong supply zone & bearish order block at $3.90–$4.00, which also aligns perfectly with the descending channel’s upper boundary.
📌 Bearish Scenario (preferred):
If price shows rejection at this zone and breaks below $3.85, a corrective move toward $3.55–$3.60 is highly probable, with potential extension toward $3.35 demand zone.
📌 Invalidation:
A 4H candle close above $4.05 would invalidate the short setup and open the door for a continuation toward $4.25+.
💡 Note: Confluence of channel resistance + supply OB + psychological $4 level makes this a high-probability short area. Watch for lower-timeframe BOS or liquidity sweep before entering.

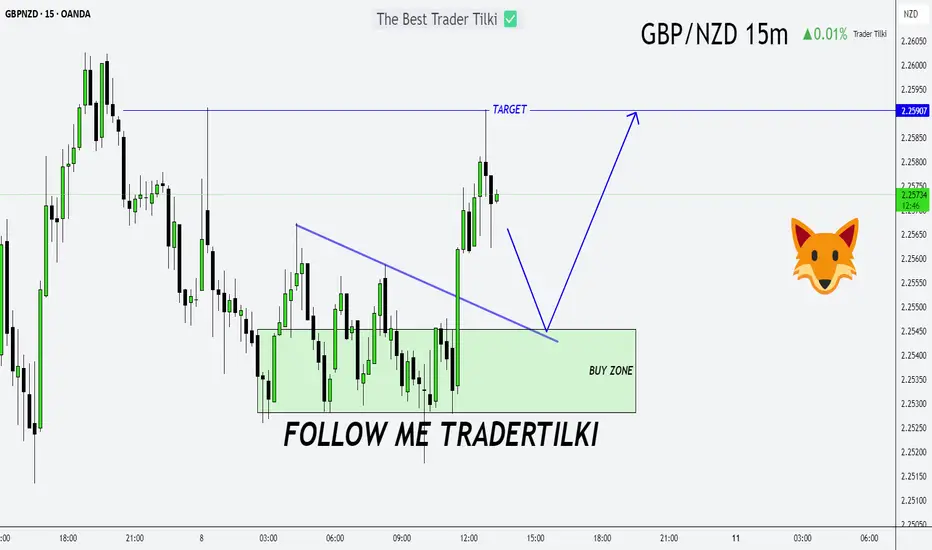
Forecast in, Profits Out: GBPNZD Entry & Target RevealedHello my dear friends,
I’ve prepared an analysis for the GBPNZD pair. I share these insights to help you earn money from the markets.
First and foremost, let’s remember this: as traders, we only forecast market structure. We prepare our analysis and trade based on predictions. But in the end, whatever the whales want—*that’s* what happens. Never forget that.
From time to time, we may be wrong in our analysis, and that’s perfectly okay. What truly matters is that our losses never exceed our gains.
Now, let’s get to the point:
I plan to open a buy position on GBPNZD around the 2.25455 or 2.25282 levels. After entering the trade, my target will be 2.25907.
Every single like you send is my biggest source of motivation to keep sharing these analyses. Thank you so much to everyone who supports me with a like!
USDCAD's Opportunity Bell Is Ringing — Don’t Miss Out!Hey there, my valued friends!
I’ve prepared a fresh USDCAD analysis just for you.
📌 If the 1.37245 level breaks, the next target will be 1.38000.
Every single like you send my way is the biggest motivation behind sharing these analyses.
🙌 Huge thanks to each and every one of you who supports me!
Would you like to add a visual or a catchy headline to boost engagement even more? I can help with that too.

Volatile Times for GBPJPY: What’s Going On Behind the Moves?Good morning, Guys,
I’m anticipating a new short opportunity on GBPJPY once the pair reaches my sell zone level. From there, my target is set at 197.934.
Every like from you is what truly motivates me to keep sharing these insights.
Massive thanks to everyone who shows love and support!

SUI/USDT – Price Outlook (2H TF)🔍 Updated Aug 4, 2025 | SMC + NeoWave
SUI has broken out of the descending channel and is currently holding above the strong demand zone around $3.35–$3.40. This zone overlaps with a bullish order block and prior trendline support.
📌 Bullish Scenario (preferred):
Price confirms support → Push toward $3.90–$4.00 supply zone.
📌 Invalidation:
A close below $3.35 invalidates the setup and suggests continuation of the correction.
💡 Tip: A breakout of structure (BOS) + mitigation of OB = solid confluence for long setups.
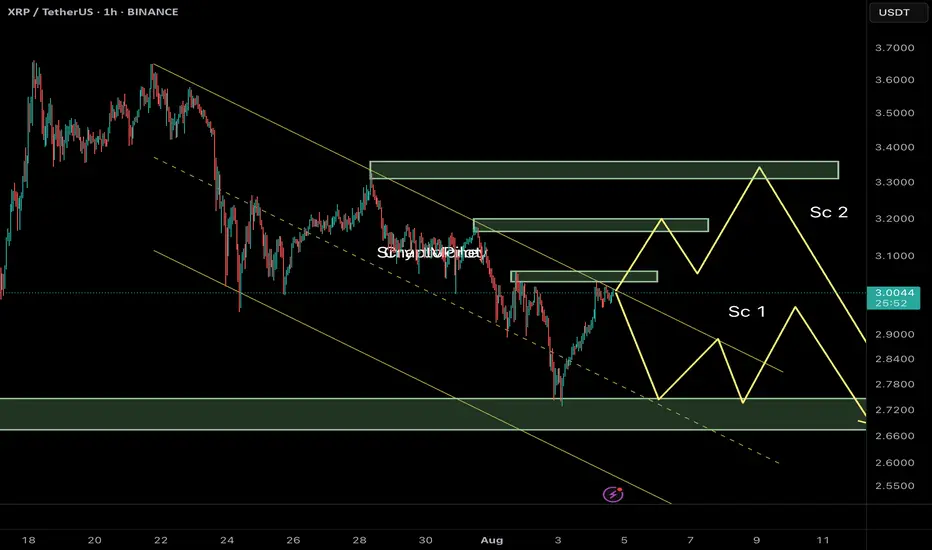
Ripple (XRP/USDT) Technical Analysis – 1H Timeframe🔰 Current Market Context:
After breaking below the ascending channel near $3.50, XRP has entered a corrective phase within a descending channel. Price is now hovering around a mid-range resistance zone, and we can outline two key potential scenarios from here:
⸻
📌 Scenario 1 (Sc1) – Immediate Rejection and Bearish Continuation
In this case:
• Price gets rejected from the current resistance zone ($3.05–$3.10).
• A quick corrective pattern (likely a Zigzag or Flat) plays out.
• XRP moves down to test the next demand zone near $2.70–$2.65, breaking below recent swing lows.
✅ This scenario aligns with the current weak structure and visible sell-side pressure. Liquidity above recent highs has likely been swept, creating a setup for continuation downward.
⸻
📌 Scenario 2 (Sc2) – Extended Correction with a Final Bull Trap
In this case:
• Price pushes higher toward a deeper resistance zone near $3.30–$3.40.
• A liquidity grab above the prior highs triggers a sharper reversal afterward.
• The overall structure could form a Diametric or Complex Correction, suggesting a deeper and more time-consuming wave before resuming the bearish trend.
⛔ This scenario requires strength and acceptance above $3.15, and should be treated as an alternative unless proven by price action.
⸻
🎯 Summary & Trade Strategy:
Scenario 1 is currently more probable unless we see a strong break and close above $3.10. Expectation: XRP may head toward the $2.70–$2.65 demand zone if resistance holds.
⚠️ Avoid entering early. Wait for confirmation via internal BOS (Break of Structure), bearish engulfing near OB zones, or signs of rejection with volume at resistance.
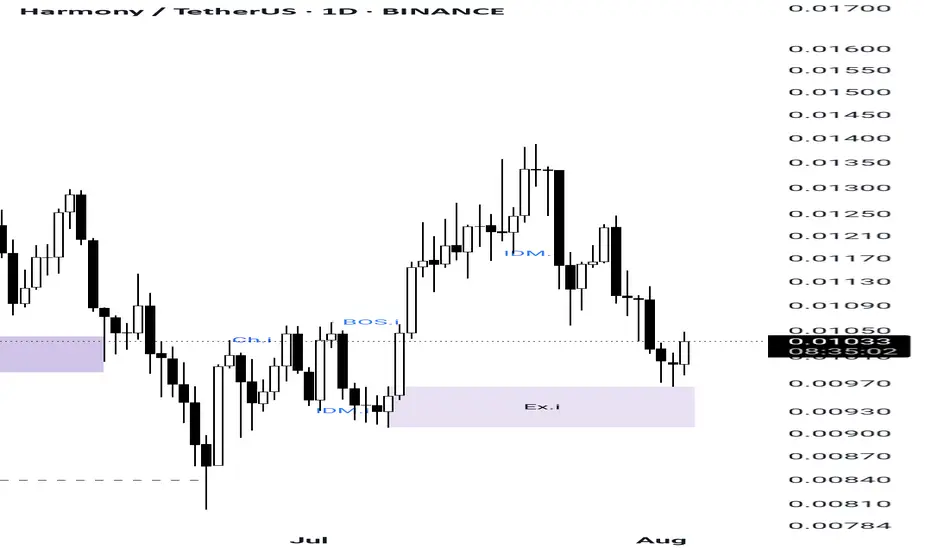
Harmony(ONE) is going to pump...As you can see in ONE Structure it made a minor structure and price touched its minor EX orderblock and for sure it made a SCOB confirmation
So now its ready to pump...
It's my own analysis and it's not investment advise , so DYOR