APPL Breakdown: BOS & CHoCH NASDAQ:AAPL On the H1 timeframe, the market structure has already produced a downside BOS, followed by a confirmed CHoCH. This clearly indicates that bullish momentum has ended and the market has shifted into a bearish trend.
Price has rejected from a bearish Order Block and FVG zone on the upside, highlighting strong institutional selling pressure. As long as price remains below this resistance, selling pressure is expected to remain active.
MACD also supports this analysis, with the MACD line below the signal line and the histogram in the negative zone, confirming momentum weakness and bearish continuation.
Bias:
As long as price stays below 274.00, sell continuation is expected.
Current Price / Sell: 270.78
Stop Loss: 274.00
Targets:
TP1: 265.50
TP2: 260.00
Disclaimer
This chart is for educational purposes only and does not constitute financial advice. Trading involves high risk; always conduct your own research and use proper risk management.
Orderblocks


GOLD Buy Near at POI Now at time gold have a selling pressure price is 4508.235 But its will be come Down at 4464.833 round about +-, and that point have a clear Order Block , Fixed Volume Range that mean Showing Clear BUY Pressure also we another conformation is 3rd Time Trend-Line Touch and Volume at time Time is Down. Now let's see what gold does.

BTC H4 OTE Play - Short Term Bullish Reversion Toward Liquidity📝 Description
BTC on H4 is trading inside a corrective leg after a clear sell-side liquidity grab (SSL) into H4 OB. Price is now pulling back into H4 OTE (0.618–0.786) within discount, and a short-term bullish move is expected as part of a mean-reversion push toward nearby liquidity. The broader structure remains corrective unless premium is reclaimed with acceptance.
________________________________________
📈 Signal / Analysis
Primary Bias: Bullish pullback from discount. short-term upside, then decision at premium
Long::
• Entry (Buy): 86,300
• Stop Loss: Below 85,750 (OB invalidation)
• TP1: 88,940
• TP2: 90,127 (BSL)
• TP3: 91,370 (H4/H1 FVG)
________________________________________
🎯 ICT & SMC Notes
• Clean SSL sweep into H4 OB
• Price respecting OTE (0.618–0.786) in discount
• H4/H1 FVG overhead as upside magnet
• BSL resting above recent highs
________________________________________
🧩 Summary
This is a discount buy and premium sell environment. Long from OTE makes sense for a liquidity run, but expect reactions at BSL/FVG. Acceptance above 91.3k needed for continuation; otherwise, watch for rejection and rotation back down.
________________________________________
🌍 Fundamental Notes / Sentiment
With USD Unemployment Claims coming up, this data can act as a short-term catalyst. If the release prints above the forecast (224k), it would weaken USD and support the bullish setup. If it comes in below expectations, upside momentum may be limited—trade with tight risk management and secure profits on lower targets.
________________________________________
⚠️ Risk Disclosure
Trading involves substantial risk and may result in capital loss. This analysis is for educational purposes only and does not constitute financial advice. Always apply proper risk management, predefined stop-loss levels, and disciplined position sizing aligned with your trading plan.

EURUSD Buy After Few Conformation Now at This Time Price 1.1774 Area. at time point price goes up near 1.1780 its a Internal High Level then price come to down at 1.1756 (its a Order Block area, Golden zone and also fixed Volume range)as par technical analysis May be possible Price Liquated sweep 1.1747 Then Find Clear up side Buy Conformation be carefully take all entry as per yourself .that is our analysis

GBPUSD 1H Buy Direction , Find Buy Entry Now at this time Price Moving at 1.33950 , Price Struggling to move Down Possible at 1.33704 where have Fibonacci GOLDEN ZONE Area ,1H Order Block that , up side Trend-Line also showing Clear Buy Direction But one more you must to be know 1.33566 is SUPPORT Area May be Possible hit and goes down and hits ALL SL Because this is a Liquated area and then Price GOES UP a BUY Side ,these all possible points where you want to BUY

ZEC — Another -50% Drop AheadZEC has had one of the wildest runs this year, a +2000% explosion from August to November, all in just 80 days, before topping out at $750. Moves that go vertical like this tend to unwind just as aggressively, and ZEC did exactly that: a sharp –60% correction back into the $300 support zone.
That reaction wasn’t random, $300 was a major confluence level:
0.618 Fib retracement of the entire +2000% move
Weekly level lining up cleanly
0.786 Fib of the smaller impulsive wave
Altogether, an ideal spot for a bounce and that’s exactly what we saw. Looking at the current structure, here’s what I’d like to see next:
1. A move toward $500 → Short opportunity
$500 should now act as a psychological resistance level and would be the perfect area for a rejection.
2. A drop into the $250 region → Long opportunity
This zone is stacked with confluence:
0.702 Fib sweet-spot entry of the entire move
0.886 Fib retracement (deep retrace zone)
Weekly order block
Anchored VWAP
Monthly level
POC
This makes $250 a very attractive long-entry, with a simple target back toward $300.
Educational Insight
Parabolic moves like ZEC’s +2000% rally in such a short time almost never resolve sideways. When price accelerates this fast, the market typically needs time to rebalance value. This usually happens through deep retracements and distribution structures.
The first major retrace to the 0.618 Fib often acts as a relief bounce, which we already saw around $300. This bounce doesn’t mean the trend is healthy again it usually represents short covering and dip-buyers stepping in early. Structurally, these bounces often lead to lower highs, forming patterns like Head & Shoulders or broader distribution ranges.
Deeper retracement levels such as the 0.786 and 0.886 Fib tend to be where strong hands accumulate, especially when they align with:
Anchored VWAPs (fair value over time)
High-volume nodes (POC)
Higher-timeframe order blocks
Monthly or weekly levels
This is why the $250 zone stands out. It’s not just “another support”, it’s where multiple market participants agree on value, which increases the probability of a meaningful reaction.
On the flip side, psychological levels like $500 often attract late buyers and breakout traders during corrective rallies. When momentum fades into these areas, they frequently become ideal zones for short entries, especially if volume dries up or rejection wicks form.
Key takeaway:
Instead of chasing fast moves, focus on where value is likely to be defended or rejected. High-probability trades are built where structure, Fibonacci, volume, and VWAP all align.
In summary:
ZEC is offering two solid setups → one on the short side near $500, and one long near $250. Set alerts on both levels and wait for the reaction.
_________________________________
💬 If you found this helpful, drop a like and comment!

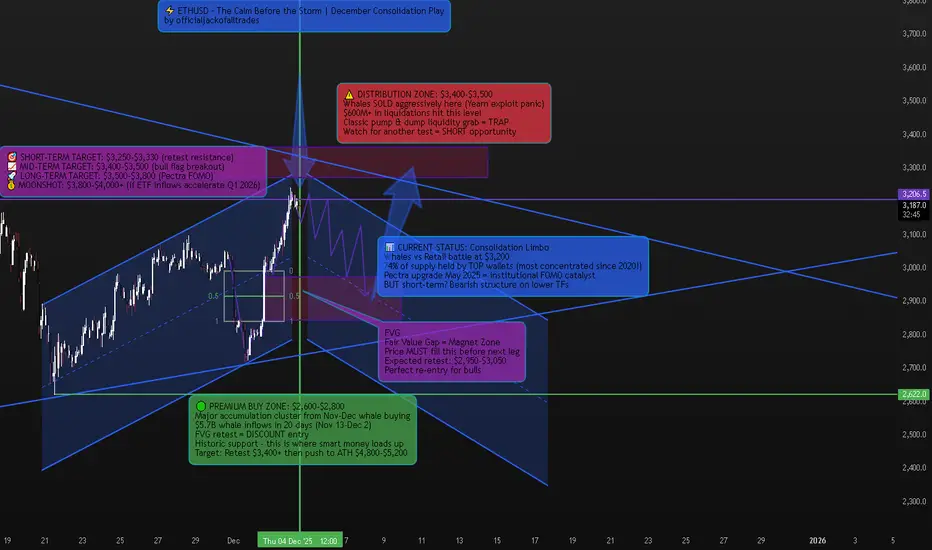
ETHUSD – The Calm Before the Storm | December's Most Misundersto📈 Market Context – Why Everyone's Wrong About ETH Right Now
Ethereum is sitting at one of the most deceptive price levels in crypto right now. Most traders see the recent dump from $3,762 on December 2 and think "it's over." Others see the consolidation around $3,208 and think "dead cat bounce."
They're both missing the bigger picture.
Here's what ACTUALLY happened: A 2015 Ethereum ICO wallet that had been inactive for a long time moved 40,000 ETH suddenly, worth around $120 million. Crypto Twitter panicked. But then Lookonchain verified that it was for internal transfer, and not a liquidation. Classic FUD.
What REALLY tanked ETH? A Yearn Finance exploit that happened at the worst possible time, when the market was stretched by leverage and rising speculative positioning. More than $600 million in crypto liquidations hit the market. This wasn't an organic selloff—this was a leveraged washout.
But here's the kicker: While retail was panic-selling, whales were accumulating like it's 2020 all over again.
🔎 Technical Framework – The Deceptive Calm
Current State:
Ascending broadening wedge inside rising channel—classic volatility compression before explosive move
Key Liquidity Zones:
🔴 Distribution Liquidity Zone (SHORT Opportunity):
$3,550 - $3,650 (recent spike high + whale distribution cluster)
This is where whales moved 40,000 ETH at $120 million valuation before the "transfer" narrative
Since December 2024, aggressive selling by whales has been evident in the rise of average market order sizes
🟢 Accumulation Liquidity Zone (BUY ORIGIN):
$2,900 - $3,000 (FVG retest + November-December whale buy zone)
From November 13 to December 2, whales acquired a total of 1,702,835.5 ETH at an average price of $5.7 billion
In early 2025, large holders acquired over 330,000 ETH, valued at approximately $1.08 billion
⚖️ Chop Zone (NO TRADE ZONE):
$3,100 - $3,400 (current consolidation limbo)
This struggle between institutional investors and retail traders could define Ethereum's price action in the coming weeks
🐋 WHALE ACTIVITY – The REAL Story Nobody's Talking About
While everyone's focused on the dump, let me show you what the ACTUAL data says:
The Accumulation Phase (That Everyone Missed):
Ethereum whale wallets have recorded positive netflows in each of the last 20 trading days, dating back to November 13
The highest single-day inflows of 2570 ETH came on November 14 when Gensler's exit was confirmed
Ethereum ETFs attracted $2.63 billion in inflows in December 2024, led by the Fidelity Ethereum Trust
The Concentration Effect (This is MASSIVE):
Over the past four months, Ethereum's Gini coefficient increased from 0.7563 in September to 0.7630 in December 2024—a clear sign of growing ownership concentration. Translation? Whales are consolidating control.
Even crazier: Addresses holding 10,000+ ETH now control 74.47% of Ethereum's circulating supply. Compare that to Bitcoin where large holders control only about 15%—ETH is FIVE TIMES more whale-controlled than BTC.
This is why ETH moves are so violent and why large transfers or sales by a tiny fraction of holders can rapidly sway Ethereum's price and sentiment.
The Distribution Signal:
But here's where it gets interesting: Since December 2024, there has been an increase in aggressive sell orders, particularly from whales, with rising average market order sizes suggesting they are offloading holdings.
So what gives? Are whales accumulating or distributing?
BOTH. They're accumulating at discount levels ($2,900-$3,050) and distributing at premium levels ($3,550-$3,650). This is classic smart money behavior—they're range-trading the volatility while retail gets chopped.
🚨 Recent Developments – The Catalyst Stack
Pectra Upgrade – May 7, 2025 (GAME CHANGER)
The Pectra upgrade went live in May 2025, introducing batch transactions, gas payment in any token, and doubling blob capacity for Layer 2s.
Key improvements:
Account Abstraction enables gas payments using multiple tokens like USDC and DAI, with third-party fee sponsorship
EIP-7691 doubles Ethereum's blob throughput from three blobs with a maximum of six to six with a maximum of nine
With the Pectra upgrade, Ethereum's data capacity significantly increases to about 420 TPS from 210 TPS
Translation: ETH just became TWICE as fast for Layer 2s. This is MASSIVE for scalability and will drive institutional adoption.
ETF Inflows – The Silent Accumulation
Ethereum ETFs attracted substantial institutional interest, with inflows reaching $2.63 billion in December 2024. This is institutional money positioning for the next leg up—they don't buy at tops, they buy at bottoms.
Gary Gensler Exit – Regulatory Tailwind
The impending exit of SEC chairman Gary Gensler enhanced investor confidence in the altcoin sector, putting Ethereum in prime position to deliver superior performance relative to BTC.
Staking Explosion
Staking activity reached near-all-time highs, with 36.19 million ETH locked in validators—a 4.5% increase since October 2024. That's $115+ BILLION locked away, reducing circulating supply.
DeFi TVL At $90 Billion
Total Value Locked in Ethereum protocols surged to $90 billion, driven by renewed interest in yield-bearing DeFi products. Institutional money is FLOODING into ETH DeFi.
🎯 Trade Plans – High-Probability Setups
🟢 BUY ETHUSD: $2,900 - $3,000 | SL $2,820
Thesis: FVG retest at proven whale accumulation zone + November-December $5.7B whale buying cluster = institutional re-entry point
Entry Rules (MUST WAIT FOR CONFIRMATION):
Price dips into $2,900-$3,000 FVG zone
Bullish CHoCH (Change of Character) + BOS (Break of Structure) on H1-H4
Strong bullish rejection wick with volume spike (100K+ ETH volume on 4H)
Ideally on Order Block retest after initial bounce
BONUS CONFIRMATION: Check whale netflow data on IntoTheBlock—if showing positive inflows, ADD to conviction
Targets:
$3,350 - $3,400 (mid-channel retest, quick 12-15% gain)
$3,600 - $3,750 (previous high retest + distribution zone, 23-28% gain)
$4,200 - $4,500 (bull flag breakout + Pectra FOMO begins, 42-50% gain)
$5,200 - $5,800 (ATH retest + full bull market confirmation, 75-95% gain)
Moonshot: $6,500+ (if ETF inflows accelerate post-Pectra like BTC did)
Risk Management:
Position size: 3-5% of portfolio (this is a HIGH-CONVICTION setup)
Scale in 40% at $3,000, 30% at $2,950, 30% at $2,900
Trail stop to breakeven after hitting Target 1
Take 30% profit at Target 2, let rest ride with trailing stop
🔴 SELL ETHUSD: $3,550 - $3,650 | SL $3,750
Thesis: Premium liquidity retest at proven whale distribution zone—classic "return to scene of crime" before deeper correction
Entry Rules (WAIT FOR CONFIRMATION):
Price pumps into $3,550-$3,650 zone (previous spike high)
Bearish CHoCH + MSS (Market Structure Shift) + BOS down on H1-H4
CRITICAL: Check CryptoQuant whale-to-exchange flow—if showing HIGH exchange inflows (whales moving ETH to exchanges to sell), this is your GO signal
Heavy volume spike on bearish candle (150K+ ETH on 4H)
Entry after FVG fill or Order Block retest post-initial rejection
Targets:
$3,200 - $3,250 (first support retest, quick 8-12% gain)
$3,050 - $3,100 (mid-channel support)
$2,900 - $3,000 (FVG zone—BUY setup reactivates here!)
Risk Management:
This is a COUNTER-TREND trade—use tighter stops
Position size: 2-3% max (smaller than long setup due to higher risk)
Take 50% profit at Target 1, move SL to breakeven
Exit FULLY at Target 3 and flip to LONG setup
⚠️ Risk Management & Critical Notes
The #1 Mistake: Trading inside the $3,100-$3,400 chop zone without confirmation. The struggle between institutional investors and retail traders in this range creates whipsaw conditions this is where retail accounts get DESTROYED.
Whale Flow Monitoring is NON-NEGOTIABLE: High leverage remains with funding rates indicating very high risk-taking activities and markets still inclined towards speculative long positions. Use Glassnode or IntoTheBlock to monitor whale exchange inflows BEFORE entering trades.
Volatility Warning: This concentrated ownership structure means large transfers or sales by a tiny fraction of holders can rapidly sway Ethereum's price. Set alerts for 10,000+ ETH whale movements on Whale Alert.
Macro Headwind: Japan has indicated tightening, and U.S. real interest rates remain high. Under low liquidity conditions, even minor shocks can trigger significant price changes. If SPX dumps 5%+, ETH follows—be ready to cut positions.
Position Sizing: Given the extreme whale concentration, never go all-in. Scale positions at key levels. This isn't a casino—it's warfare against billion-dollar players.
📊 The Bottom Line – Why This Time Is Different (Or Isn't)
Let me give it to you straight: ETH is at a crossroads.
The Bull Case (What I'm Leaning Toward):
✅ $5.7 billion in whale accumulation over 20 days since November 13
✅ $2.63 billion in ETF inflows in December 2024
✅ $90 billion TVL in DeFi protocols institutions are building
✅ Pectra upgrade doubled transaction throughput to 420 TPS
✅ 36.19 million ETH staked = reduced supply
✅ Gary Gensler gone = regulatory tailwind
✅ Technical structure: Rising channel still intact, FVG below = perfect retest setup
The Bear Case (What Keeps Me Up at Night):
⚠️ Aggressive whale selling since December with rising average market order sizes
⚠️ Even as Bitcoin and Solana hit all-time highs after Trump's election, Ether topped out at $4,000 in December, well short of its 2021 high of $4,800
⚠️ High leverage with funding rates indicating very high-risk speculative long positions
⚠️ Global liquidity tightening from Japan and high U.S. real interest rates
⚠️ 74.47% of supply controlled by whales = extreme manipulation risk
⚠️ Price underperforming BTC and SOL = capital rotation away from ETH
My Take:
The $5.7 billion whale accumulation since November 13 tells me smart money is positioning for a move. But the aggressive whale selling at premium levels tells me they're range-trading, not accumulating for a straight pump to $10K.
Here's the play:
Short-term (Dec-Jan): Expect consolidation with violent swings. Trade the range: buy $2,900-$3,000, sell $3,550-$3,650.
Medium-term (Feb-April): After Pectra hype builds + ETF inflows accelerate, we get the push to $4,200-$4,800.
Long-term (Mid-2025+): If ETH breaks $4,800 ATH with volume, we're going to $5,800-$7,000+.
BUT: If ETH breaks below $2,850 with volume, the bull case is dead and we're heading to $2,600-$2,400 to fill lower FVGs.
🔥 Strategy Summary – How I'm Trading This
Phase 1 (NOW - January):
Wait for dip to $2,900-$3,000 FVG zone
Scale in long position (3-5% of portfolio)
Target: $3,600-$3,750 for 25-30% gain
Take 30% profit, trail stop on rest
Phase 2 (If we hit $3,600+):
Watch whale exchange inflows
If HIGH inflows (distribution signal) → SHORT at $3,550-$3,650
If LOW inflows (holding) → add to longs, target $4,200-$4,500
Phase 3 (Post-Pectra Hype, March-May):
If ETH holds above $3,600 and Pectra adoption is strong → go HEAVY long
Target: ATH breakout to $5,200-$5,800
This is the "generational wealth" move IF it plays out
Invalidation:
Close ALL longs if ETH closes below $2,850 on daily
Flip bearish, target $2,600-$2,400
💡 Final Word – The Truth About ETH Right Now
ETH isn't "dead." But it's not "mooning tomorrow" either.
Critics have blasted developers' decision to focus on Layer 2 blockchains, arguing those chains siphon value from ETH. That's a real concern. ETH isn't pumping like BTC or SOL because value is flowing to L2s.
But here's the counterargument: With the Pectra upgrade, this will double L2 performance out of the gate, leading to lower costs and faster transaction times. If L2s explode in adoption, ETH benefits as the base layer. It's like owning the toll road, not the cars.
The Question: Will the $2.63 billion in ETF inflows and $5.7 billion in whale accumulation be enough to push ETH to new ATHs? Or will whale distribution at premium levels and high leverage markets cause another violent shakeout first?
My bet: One more shakeout to $2,900-$3,000 (FVG retest), THEN the real pump begins. But I'm not holding through a breakdown below $2,850. That's where I cut and flip bearish.
Trade the structure. Follow the whales. Protect your capital.
Drop a 🔥 if you're watching that $2,900-$3,000 FVG like a hawk. This is where fortunes are made or lost.
EURUSD Ready for Reversal Smart Money Sell SetupAfter a strong intraday correction, EURUSD is now moving inside a rising channel, showing clear signs of bullish exhaustion. Price tapped into the premium zone / supply area, where sellers previously dominated, and is now forming a corrective wave structure.
🔍 What the Chart Shows
Price created a sharp bullish leg but failed to break cleanly above the key resistance.
Multiple rejections inside the upper supply zone signal weakening buyers.
Market is building a liquidity trap with higher-high attempts inside a rising structure.
Once liquidity is taken from the top, price is expected to reverse aggressively.
📉 My Expectation
I’m anticipating one more liquidity grab into the supply zone…
Then a clean bearish reversal targeting the discount area shown in the chart.
🎯 Key Levels
Rejection Zone (Sell Area): 1.16600 – 1.16720
Bearish Target Zone: 1.16180 – 1.16220
Invalidation: Clear breakout above 1.16720
🧠 Why This Setup is High Probability
✔ Liquidity buildup above recent highs
✔ Clear supply zone reaction
✔ Weak corrective bullish structure
✔ Smart money price behavior
This is a classic “grab liquidity & drop” setup — ideal for swing/ intraday traders.


Most Realistic (Yet Profitable) Trading Strategy Signals in 2026CRAZY RESULTS. Setting up and checking the performance reports of one of the most realistic strategy signals on TradingView.
This is what I personally use on all my trades, newly upgraded and refined with new features.

Eureka Forbes LimitedStock has broken out and is ready for the targets mentioned in drawing as TI and T2
Pattern Identified : Symmetrical Triangle breakout on the higher side
CPR Verification : Stock above monthly CPR and R1

GBPUSD Retracement Idea for a new Lower HighHi Traders!
Since my last idea GU reached my short target around 1.30000. I'm now looking for price to retrace to a previous bearish BOS area around 1.32500-1.33000. If price can create a new lower high in that area we could possibly see more bearish movement. In addition, if DXY can hold around 99.000-99.500, and continue reversing to the upside I'd have a new swing target for GU at the next Daily OB around 1.29000-1.28500.
1st alert set just below 1.32500 in case price doesn't make it to my target.
*DISCLAIMER: I am not a financial advisor. The ideas and trades I take on my page are for educational and entertainment purposes only. I'm just showing you guys how I trade. Remember, trading of any kind involves risk. Your investments are solely your responsibility and not mine.*

USDJPY Sell PositionPrice bounced from a resistance confluence, aligning with:
Previous swing highs (horizontal resistance) 157.80
Bearish order block from earlier session 157-158
Price dropped to 156, and made a bullish flag pattern up to 157. Price has broken the flag support line at.
Trade Details
Entry: 156.72
Stop Loss: 157.25
Take Profit: 155.20 (supply zone)
Risk: 53 pips
Reward: 152 pips
Risk/Reward Ratio: 2.8 x
⚠️ Disclaimer ⚠️This journal entry is for educational and documentation purposes only. It does not constitute financial advice or a recommendation to trade. All trading involves risk, and past performance does not guarantee future results. Always conduct your own analysis and consult with a licensed financial professional before making trading decisions.

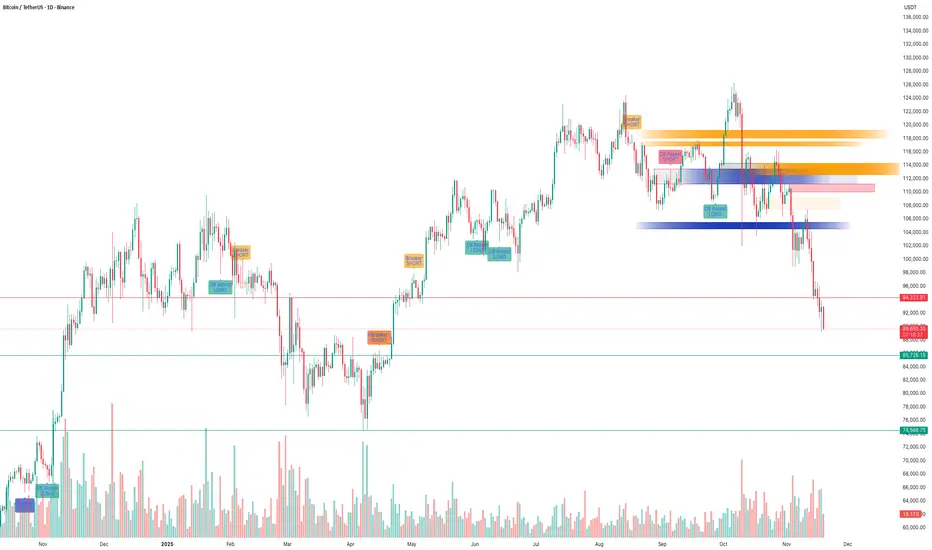
BTC – SMC Suite Follow-Up: Liquidity Grab at 116K and the Drop!!BTC – SMC Suite Follow-Up: Liquidity Grab at 116K and the Drop That Followed
This is a follow-up to my earlier idea “ BTC – Liquidity Grab at $116K Before Deep Correction? ” where I highlighted the danger of price trading into stacked SMC levels on the 1D chart.
1️⃣ Quick recap of the original idea
In the previous post, price was trading around the $112K–$116K zone.
Using the SMC Suite on the 1D chart, I highlighted:
• A high-timeframe supply / OB cluster around 116K.
• A liquidity grab above prior highs – price spiked into fresh liquidity sitting above the range.
• A confluence of Breaker + OB Re-test + FVG acting as a “danger zone” for fresh longs.
• The idea that this move could be a distribution / liquidity grab before a deeper correction.
The key message was: this is not a safe place to be aggressive long; watch for rejection and potential downside.
2️⃣ How price reacted afterwards
Since that post:
• Price respected the 116K zone as supply – every attempt to hold above it failed.
• The highlighted OB + Breaker block acted as a ceiling; price consolidated there and then rolled over.
• After losing the mid-range structure, BTC started a trend of lower highs and lower lows , confirming distribution.
• We have now traded all the way down into the d emand / support zones below 92K and then lower , which were also plotted in advance by the same SMC levels.
In simple terms, the area we marked as a “ danger zone for longs ” turned out to be the top of the move before this large downside leg.
3️⃣ What the SMC levels showed well
This move is a nice case study of how the SMC concepts aligned:
• Liquidity Sweep : Price ran above previous highs into fresh liquidity, then failed to hold.
• Breaker + OB Re-test : Former demand became supply; retest of this breaker block rejected price.
• FVG + Imbalance Zones : Upside imbalances got filled and then flipped into resistance.
• Structure Shift : After the rejection, market structure shifted bearish with clean breaks of prior swing lows.
None of this is about “perfect prediction”, but about reading where smart money might be offloading risk and where retail is most vulnerable.
4️⃣ Takeaways & what I’m watching next
• HTF SMC levels matter. When multiple concepts cluster (Breaker, OB, FVG, previous highs), treat that zone with respect.
• Liquidity grabs at highs are great warning signals – especially when followed by a clear structure shift.
• For now, I’m watching how price behaves around the current demand zones and whether we see:
• Strong rejection + reclaim of broken levels (potential swing-long areas), or
• Continuation of lower highs pointing to further downside.
This post is for educational purposes only, not financial advice.
XAUUSD - REJECTING THE DAILY ORDER BLOCK, BULLISH CONFIRMATION Gold is forming a bullish structure after rejecting the daily Order Block, which is acting as strong support.
🟢 1st Scenario:
Gold may continue pushing up toward 4200 , which is the H4 Order Block acting as resistance.
From this level, price may either reject or break through the area.
🟢 2nd Scenario:
If Gold can break above 4200 and form a clear break-and-retest structure, the trend is likely to continue.
The next important level to watch is 4340 .

WE CAN HOLD OUR POSITIONEUR/USD has remained in a downtrend and is using bullish order blocks only for short-term corrections. However, its downward movement isn't very stable due to the low number of sell orders. This week, the EUR/USD and GBP/USD pairs are stuck in a temporary correction, so we need to be cautious about corrective moves.
If you've been in the downtrend from the beginning, you can secure part of your profit here and set the rest of your position to risk-free

GBPJPY – Targeting the Green WCL After BC RetracementPrice completed a clean green impulse and started a corrective red sequence.
The plan: wait for a retracement into the red BC zone, which overlaps a bearish order block. If price reacts from that region, I’ll ride the next leg down toward the red C target and the green wave’s Whole Correction Level (WCL).
However, note the developing bullish flag pattern — if price breaks above red B, that flag activates and the bearish setup becomes invalid. A breakout there could extend the larger bullish trend.
Strengths:
– BC retracement aligns with a strong order block.
– WCL and C-target overlap, creating a high-probability draw on liquidity.
– Clear invalidation above red B protects the setup.
Weaknesses:
– GBPJPY volatility could trigger premature sweeps.
– A confirmed flag breakout would fully invalidate this setup.
Narrative:
Trading the correction inside a possible flag — shorting structure, not emotion. If the flag fires, I’ll flip bias with it.

GBPJPY | Institutional Sell Setup – D1 & W1 Sweeps AlignGBPJPY has completed a multi-timeframe liquidity sweep, with both W1 and D1 sweeps aligning inside a premium price zone.
The structure has shifted bearish following a clear CHOCH and a rejection from the FVG imbalance area, confirming potential downside continuation.
🔹 Execution Bias: Instant Sell
🔹 Entry Zone: 202.60–202.80
🔹 Stop-Loss: Above 203.40 (protected high)
🔹 Target: 199.00 (liquidity zone)
🔹 Bias: Bearish
Technical Breakdown:
• Weekly sweep confirms distribution.
• Daily sweep adds confluence of liquidity grab.
• CHOCH at discount confirms bearish intent.
• FVG + refined OB = smart-money entry zone.
• Targeting inefficiency and old liquidity lows.

Fertilizers & Chemicals Travancore LtdStock Price is well inside Accumulation Zone and also RSI Divergence can be seen on the daily time frame, Stock has very good fundamentals, Price may reverse from here to hit the Targets as shown in the diagram.
Fundamentals Snap Shot :-
Short Overall View on These Metrics
Sales / Revenue growth:
Long-term revenues have grown strongly from ~₹2,000 cr to a 6,000+ cr peak,
But last two years show clear decline, and 3-year sales CAGR is now negative.
OPM %:
Peaked around 13–17% (FY20–22); now down to 2–4%.
Indicates margin pressure (costs, pricing, or mix issues).
EPS:
Boosted historically by large “Other Income”;
Recent EPS is weak and volatile, far below earlier peaks.
Cash reserves:
Big positive: cash & bank balances of nearly ₹2,800 cr, growing every year;
With borrowings ~₹1,800 cr, FACT now appears net-cash positive.

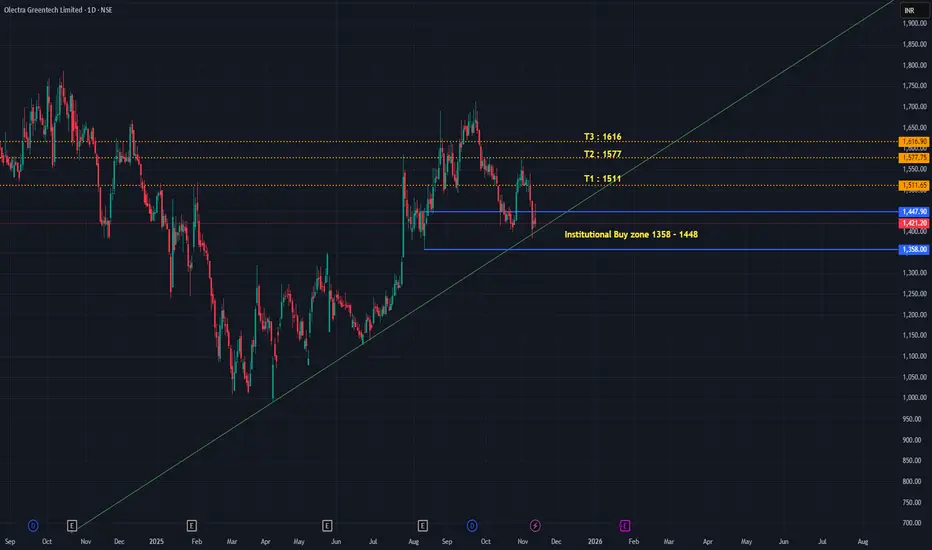
OLECTRA Trade PlanStock Price is well inside Accumulation Zone and also taking support from the Trend Line, Stock has very good fundamentals, Price may reverse from here to hit the Targets as shown in the diagram
Fundamentals Snap Shot :-
Very Short Overall Take (On Just These Metrics)
Sales/Revenue growth: ⭐⭐⭐⭐⭐ – Very strong 5-year ramp, big FY25 jump.
OPM%: ⭐⭐⭐⭐☆ – Stable ~15%, good for a tender-driven manufacturing business.
EPS growth: ⭐⭐⭐⭐⭐ – EPS has multiplied sharply with improving scale.
Cash reserves: ⭐⭐⭐☆ – Adequate but not “cash-rich”; significant money stuck in receivables & inventory.
AUD/USD – Looking for buys off the 4H BC zoneAfter completing a clean bearish correction, price shifted bullish on the 4H.
I’m waiting for a retrace into the BC + Order Block zone (0.6490) to go long.
Targeting 0.6560 , stop below 0.6463 .
If 0.6460 breaks cleanly, setup’s invalid.
R:R ≈ 1:2.6 — let’s see if demand holds 👀
Disclaimer: This post is for educational purposes only and does not constitute financial advice.

Voltamp Transformers LtdStock has broken out and is ready for the targets mentioned in drawing as TI and T2
