CHWY in ConsolidationHi Traders!
In my previous post, I mapped out my long plan, and took profits around resistance at $42. Since then, CHWY has returned back to my entry area I am re-adjusting myself for another set up. Right now it is retesting the Daily CHOCH area again, and seems to be in consolidation. If the Daily CHOCH is valid, I would like to see a bullish engulfing, or a strong bounce to act as support.
If the CHOCH area fails, I will look for a re-entry around $36. That will bring price towards a Daily order block. Therefore, a bearish sentiment would be a close below $39, retests from below turning into resistance. No trade if it just chops between $39 & $40 with weak candles. This will avoid me getting caught in consolidation and chopping up my contracts.
*DISCLAIMER: I am not a financial advisor. The ideas and trades I take on my page are for educational and entertainment purposes only. I'm just showing you guys how I trade. Remember, trading of any kind involves risk. Your investments are solely your responsibility and not mine.*
Orderblocks

Bearish Momentum for Bitcoin!Looking at the Daily Time-frame, we can see that the market structure has been broken. The high formed in the 14th of July, where liquidity was resting, was taken out and immediately price began its down-ward spiral! Within a period of 9 days, the low formed on the 2nd of August was taken out, qualifying that level as a breaker, but a more decisive move took place on the 25th.
Thus we can see, by the unwillingness of price to go above the breaker level, that the market is bearish! Right now, I am waiting for price to reach the 111,855 level to see how price will react.
All the best with your trading.

DXY - OTE + SD Long TradeThis was my trade in TVC:DXY
This is the example of an absolute perfect entry and exit.
Entry at Optimal Trade Entry (OTE) level 0.5 .
Stoploss below swing low.
Exit half lots at Standard Deviation TP 1 and rest of the lots at Standard Deviation TP 2.
They say the perfect trade doesn't exist. But here is something to change your mind :)
Share your thoughts and analysis in the comments! I'd love to learn more.

Is the Retracement Over?Hi Traders!
GJ dipped in the 50% fib this past week, and bounced off the previous weekly OB again at 198.500. The retracement might be over, and I'm looking to enter a long swing trade. However, I'd like to see it bounce off the 4HR OB sitting at 199.500/.600 and make a return to the 4HR CHOCH around 199.000/.200 to determine my entry. If so, based on the Daily, I'd be swinging this trade to around 202 and 203. That'd also hit around a Weekly bearish OB.
*DISCLAIMER: I am not a financial advisor. The ideas and trades I take on my page are for educational and entertainment purposes only. I'm just showing you guys how I trade. Remember, trading of any kind involves risk. Your investments are solely your responsibility and not mine.*

Setting up for a Long Swing TradeHi Traders!
I've been keeping an eye on CHEWY for a few weeks now. Chewy dipped into the 78% fib, and set up for a reversal. I'd like to see a possible retest at a Daily Breaker Order Block at around $39.50. If that can verify that the Daily CHOCH is valid, I'm planning to swing this Options trade for a few weeks. My first target would be around $42. In addition, the monthly IMO is bullish and could give us another long term swing.
Alerts are set for now.
*DISCLAIMER: I am not a financial advisor. The ideas and trades I take on my page are for educational and entertainment purposes only. I'm just showing you guys how I trade. Remember, trading of any kind involves risk. Your investments are solely your responsibility and not mine.*

Trading Imbalances: How to Use Fair Value GapsDifficulty: 🐳🐳🐋🐋🐋 (Novice+)
This article is designed for traders who want to understand Fair Value Gaps (FVGs) in a simple, practical way — without drowning in complex Smart Money Concepts terminology.
🔵 INTRODUCTION
If you’ve studied Smart Money Concepts (SMC), you’ve likely come across Fair Value Gaps (FVGs). For many, the concept feels overcomplicated. In reality, an FVG is just an imbalance in price — a spot where the market moved so fast that it didn’t fully trade both sides.
🔑When price leaves a gap behind, it often comes back later to “rebalance.” This gives traders powerful zones for entries, exits, and target setting.
🔵 WHAT IS A FAIR VALUE GAP?
A Fair Value Gap is formed over three candles :
Candle 1: The first move (anchor).
Candle 2: The big impulsive candle (the imbalance).
Candle 3: The follow-up candle.
The gap exists when the high of Candle 1 is below the low of Candle 3 (in a bullish case). This leaves an “untraded zone” inside Candle 2.
Think of it as a skipped step. Price rushed through so quickly, there wasn’t enough time to trade at fair value.
🔵 WHY DOES PRICE RETURN TO FVGs?
Markets seek balance. When an imbalance forms, algorithms and institutional flows often revisit the gap to collect liquidity and rebalance orders.
This doesn’t mean every FVG gets filled instantly — some remain open for days or even weeks. But many serve as magnets for price.
🔑Key point: An FVG is not a magic level. It’s a clue about where inefficiency sits.
🔵 HOW TO TRADE FVGS SIMPLY
1️⃣ Mark the Zone
Identify the three-candle imbalance. Highlight the gap inside Candle 2.
2️⃣ Wait for Return
Don’t chase the impulsive candle. Instead, wait for price to retrace into the FVG zone.
3️⃣ Trade the Reaction
Bullish FVG → wait for price to dip into the zone and show bullish reaction
Bearish FVG → wait for price to retest zone and reject downward
Stops are usually placed beyond the gap, targets set toward the next liquidity pool or swing level.
🔵 EXAMPLE SCENARIO
A strong bullish candle leaves an imbalance.
Price continues higher, but a day later revisits the gap.
At bullish rejection candles form with increasing volume.
Entry taken, stop below gap, target at next swing high.
🔵 TIPS FOR ADVANCED TRADERS
Higher timeframe FVGs are stronger and attract price longer.
Not every gap fills — filter with trend direction.
Combine with OBs (Order Blocks) or liquidity zones for more precision.
Ignore small random gaps in low-volume markets.
🔵 CONCLUSION
Fair Value Gaps don’t need to be mysterious. They’re simply imbalances in the auction process. By waiting for price to return and react, traders can build structured entries with defined risk.
🔑Instead of overcomplicating SMC concepts, think of FVGs as footprints of urgency — and opportunities for balance.
Do you already trade FVGs, or is this your first time hearing about them? Share your setups below!
Gold 15M OB Reaction – Targeting 3355Price is currently trading around the $3,333 level after reacting to the M15 and M5 Order Blocks (OB). The market is showing signs of a potential reversal from this demand zone, supported by the break of the descending trendline.
Entry Zone: Price is mitigating the M5 OB within the larger M15 OB.
Targets:
TP1: $3,339 – aligned with local liquidity ($$$) and previous highs.
Final TP: $3,357 – a major liquidity zone and supply area.
If price holds above the OB, we can expect bullish continuation towards TP levels. However, a break below $3,323 would invalidate this setup and signal deeper downside.
📊 Bias: Bullish (as long as OB holds).

Is this where GJ starts making its big move?Hi Traders,
After breaking out of a failed swing tapping 200.000, GJ came down to retest the failed swing area at 199.000, bounced and reversed. Around 199.500 could be another retest/entry area before continuation. The weekly looks really good IMO, so I am planning to swing trade. My first target would be around 201.500, and then 203.000. 203.000 would hit an area of a weekly bearish OB.
*DISCLAIMER: I am not a financial advisor. The ideas and trades I take on my page are for educational and entertainment purposes only. I'm just showing you guys how I trade. Remember, trading of any kind involves risk. Your investments are solely your responsibility and not mine.*

Is GBPUSD Setting up for a Long Swing?Hi Traders!
I've been watching this pair. It seems like it could be setting up for a long swing. I would like to see a retest around 1.34900/800, and how it reacts to that area. That'd hit a Daily Order Block. In addition, the weekly made a break of structure, and dipped into a weekly breaker OB, then pushed up. However, the only thing I don't like is it's at a weekly resistance. But, IMO the monthly looks bullish.
So, over all I'm bullish on this pair and will plan to swing, I just need my confluences to match up fully before taking this trade.
*DISCLAIMER: I am not a financial advisor. The ideas and trades I take on my page are for educational and entertainment purposes only. I'm just showing you guys how I trade. Remember, trading of any kind involves risk. Your investments are solely your responsibility and not mine.*

Gold (XAU/USD) 15m Chart AnalysisGold is currently holding above the 3,345 support zone, aligned with the 200 EMA (blue line). Price tested this support area and showed a bullish reaction, indicating potential demand.
🔑 Key Levels:
Support: 3,344 – 3,345 zone
Resistance: 3,357
📈 Bias:
If price sustains above the highlighted demand zone, we may see a bullish continuation toward the 3,357 resistance level. The projection suggests a possible pullback before continuing higher.
⚠️ Watch out:
A clean break below 3,344 could invalidate this setup and open the way for further downside.

Gold 1H | ICT SMC Analysis (OB + FVG Roadmap)This analysis is based on ICT / Smart Money Concepts.
•Key Order Blocks ( OB ) and Fair Value Gaps ( FVG ) highlighted.
•Current price is testing a bullish OB on the 1H timeframe after a CHoCH .
• Possible scenarios:
1. Bullish case → if demand (green OB) holds, price may target 3,390 – 3,410 (upper OB).
2. Bearish case → failure to hold may drive price towards 3,280 – 3,300 demand zone.
Methodology : ICT / SMC
⚠️ This is for educational purposes only, not financial advice.

GBP/NZD POTENTIONAL SHORT OPPORTUNITYThis is an idea for GBPNZD's potential short opportunity based on what the technicals indicate.
The trend has been emphasising its bullish approach for almost three years.
Price respected almost 11 times due to the strong resistance within 150 days between 2.265 & 2.275 and bounced off bullish OB on the daily chart and FVG on the weekly chart.
An institutional sharp decline on the weekly chart, followed by a clear wedge, can support a further drop once swept by bearish daily OB. A breakout to the micro wedge (orange) within a macro wedge can also help further down move.
Given that a bearish pin bar followed by a bearish doji is a strong warning signal of potential reversal or bearish continuation that appears inside the micro wedge.
TP1 is considered the first support at the bottom, where the daily OB and the weekly FVG meet at around 2.22000 or the area close to the trendline. If the price breaks through the trendline, TP2 and TP3 will be expected to be achieved.
TP2 may be located at the micro accumulation around 2.20000, and TP3 at the following major support around 2.15000-2.17000 that previously acted as both support and resistance.
Good luck and have a great weekend.

GBP/USD Forecast – Bullish Continuation SetupGBP/USD has broken out of the descending channel and is maintaining bullish momentum. I expect the price to move toward the 1.3725–1.3807 resistance zone, where we may see a corrective pullback. If this zone holds and structure remains bullish, the next target sits at the weekly order block near 1.4230, aligning with higher-timeframe supply.
Bias remains bullish unless price closes back below recent lows and re-enters the channel, which would invalidate the setup. For now, market structure favours continuation to the upside.
Targets:
Short-term: 1.3725–1.3807
Long-term: 1.4230
Invalidation: Break and close back below channel lows.

$TDUP - Bullish Before Earnings TodayNASDAQ:TDUP was a pick from my August 3rd, 2025 newsletter, along with NYSE:HWM , NYSE:RBC , and $AMSC. These picks all have the following in common:
Performance 10Y > Performance 5Y - No long term dips in performance
Performance 5Y > Performance 1Y - No short term dips in performance
SMA(300) < Price - Price above moving average
SMA(200) < Price - Price above moving average
Avg Volume 10D > 100K - No lightly traded stocks. Liquidity needed
SMA(200) >= SMA(300) - Stacked long-term simple moving averages
SMA(50 >= SMA(200) - Stacked mid-term simple moving averages
ROE, Trailing 12 Months > 0% - Improving ROE (Return on Equity)
PE increasing quarter-over-quarter
NASDAQ:TDUP has an earnings event after hours on Monday, August 4th - today. On a fundamental note, earlier this year they exited the European market and have gotten a big growth benefit from some of the AI tools, like Style Chat, that they’ve introduced to their ecommerce platform.
With their entire focus being redirected to the US market, and their numbers showing the benefits of this new focus, they have a fighting chance to be a solid pick for the next few years.
EPS and ROE have gained in the last quarter, but there is some overhead resistance right now based on the free TradingView Indicator Magic Order Blocks .
Oh, and they’ve been winning a lot of awards and recognition on the technology front, including a nod for their Chief Product and Technology Officer, Dan DeMeyer, being named a 2024 Vanguard at the beginning of the year, by Modern Retail.
My analysis shows that there is an expected 23% move because of the earnings events based on implied volatility. But the IV is so large, the movement over the last few trading days might take the wind out of the sails of today's announcement. Unless, of course, there's a miss. In which case, bulls might get smashed.
This is a slightly riskier play, considering the IV going into earnings, but could be a big winner if NASDAQ:TDUP stays on their current trajectory.
Or, I could be wrong. 😕🤔

XAUUSD – Channel Breakdown & Order Block ReactionPrice has broken below the ascending channel 📈 after failing to hold higher highs. A strong bearish drop has pushed price toward the 15M Order Block (OB) 📦 around 3,335–3,345, which may act as a demand zone.
🔍 Scenarios:
1️⃣ Bullish Reversal 🐂 – Buyers defend the OB, pushing price back above 3,360 and possibly toward 3,380+.
2️⃣ Further Drop 🐻 – If the OB fails, sellers could target lower liquidity zones.
⚡ Volume spikes during the breakdown show strong selling pressure, but the OB zone remains the key battleground for the next move.

SUIUSDT BuyPrice has broken structure to the upside (MSS 4H) after an impulsive rally. Liquidity sits above recent highs, with a bullish order block below as a potential retracement zone. Plan is to wait for price to mitigate the OB at price of 3.5249.

XAUUSD Weekly Plan a Liquidity Clean-Up?XAUUSD Weekly Plan – The Final Bullish Push Before a Liquidity Clean-Up?
Are you ready for a high-volatility week?
Last week, Gold continued to move steadily inside its bullish channel, reaching the FVG High Zone and pushing towards the strong resistance cluster at 3426–3428 (OBS Sell Zone).
The bullish structure on H2–H4 remains intact, but as price enters the distribution zone, candles are tightening, and volume is fading — a clear sign that buying pressure is weakening.
Macro Backdrop – What’s on the Calendar?
This week is packed with high-impact USD data:
CPI (Aug 12) – Major inflation reading, key driver for USD & Gold.
PPI (Aug 14) – Producer inflation, often a leading indicator for CPI trends.
Unemployment Claims (Aug 14) – Short-term labour market indicator.
💡 Expectations:
CPI & PPI are forecast to improve compared to last month.
If confirmed, this could trigger a sharp Gold pullback as USD strengthens.
However, a weak CPI/PPI could give Gold one last bullish spike before reversal.
Technical Outlook
The H2 bullish channel is well-defined.
The top of the channel aligns with the FVG High Zone — a key area for big player sell limits and profit-taking.
Likely scenario:
Price extends to test 3426–3428 Sell Zone.
Bearish reaction → Channel breakdown.
Retest VPOC 3395–3400 → Drop towards liquidity pools below.
Key Trading Levels
SELL Zone: 3426 – 3428
SL: 3434
TP: 3420 → 3415 → 3410 → 3405 → 3400 → 3395 → 3390 → 3380 → 3370 → 3360
BUY Zone: 3330 – 3328
SL: 3322
TP: 3335 → 3340 → 3350 → 3360 → 3370 → 3380
Risk Management Notes
⚠️ This is a high-risk news week — false breaks are highly possible before & after CPI/PPI.
Avoid holding heavy positions during key data releases.
If price breaks above 3434 with strong volume, bearish scenarios are invalid → wait for a new structure.
📌 Summary:
Primary bias → Sell from 3426–3428, target downside liquidity pools.
Secondary play → Buy from 3330–3328 if liquidity sweep occurs.
Stay disciplined. Manage risk. Don’t get caught in the volatility trap.
— MMFlow Trading

EURUSD – Watching Trendline + Resistance Zone for Short🧩 Setup Overview :
Price recently broke below a well-respected ascending trendline
It’s now approaching that same trendline from underneath
The area also aligns with a prior resistance zone and potential lower high
If price retests this zone and shows clear rejection, I’ll consider a short entry
🎯 Trade Plan (If Triggered) :
Short on confirmed rejection (not entering blindly)
Stop Loss: Above the recent high / invalidation point
Target: Next support level — clean structure, favorable R:R
💬 How are you approaching EURUSD here?
Always open to hearing different views. Drop your thoughts below 👇

Gold Price Setup – Liquidity Grab Before Bullish Rally?Price is currently hovering above the 15M Order Block (OB) and testing the ascending trendline, aligned with the 200 EMA support.
📌 Key Points:
Price rejected from the higher channel boundary and entered the Rejection Area near 3,405 – 3,409 ($$$ liquidity zone).
Expecting a possible dip into the 15M OB for liquidity grab and trendline retest.
If bullish confirmation forms, a potential rally toward 3,405 and possibly 3,409 is on the table.
A break below 3,385 would invalidate the setup and could shift sentiment bearish.
🎯 Bullish Target: 3,405 – 3,409
🛡 Invalidation: Break below 3,385

Gold 15-Min Breakout: Eyes on M30 Supply Zone & FVG RetestPrice is currently approaching a key M30 Supply Zone after a strong bullish impulse from the ascending trendline support.
🔹 Key Observations:
The price broke above a previous short-term resistance zone and is now retesting the Fair Value Gap (FVG) area marked in pink.
The 200 EMA acted as dynamic support, further fueling bullish momentum.
Structure shows a series of higher lows, confirming buyers in control on intraday timeframes.
🔹 Potential Scenarios:
✅ Bullish Continuation:
If the price respects the FVG as demand and forms bullish confirmation, continuation toward the M30 Supply Zone and the 3,399–3,400 region is likely.
⚠️ Pullback Risk:
A deeper retracement below FVG could retest the trendline or the 3,371 support near the 200 EMA before any further upside.
🔹 Trade Plan:
Watching for price action reaction inside the FVG. A clean rejection could offer entries targeting the upper supply zone.

Gold Price Setup – Potential Rejection & Long ScenariosPrice is currently consolidating below the H4 Supply Zone after rejecting the ascending trendline twice.
Two key scenarios are in focus:
✅ Scenario 1 – Deeper Pullback to Demand Zone
A retracement into the 1H + 30M Order Block (OB) and liquidity zone near 3,341–3,355 (marked with $$$) could attract buyers.
If bullish momentum confirms, look for a continuation toward 3,388 and possibly the upper trendline near 3,400+.
✅ Scenario 2 – Immediate Push Higher
If price holds above the moving average and fails to break below 3,355, bulls could step in earlier, driving price back to test the trendline resistance.
Breakout of the trendline could target the higher supply region.
🔍 Key Levels to Watch:
H4 Supply Zone (3,440 area) for potential reversal.
3,341 OB Zone for liquidity sweep and reaction.
Trendline Resistance capping the upside.

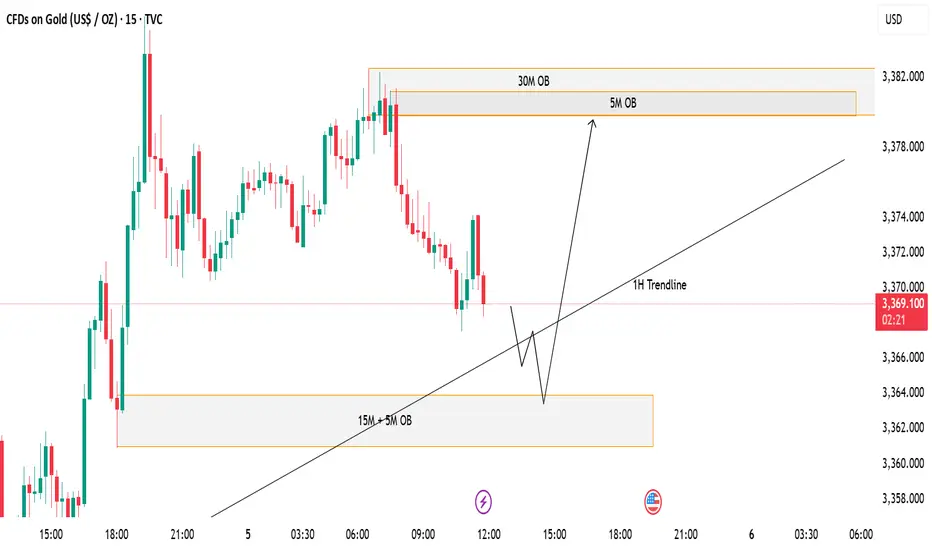
GOLD (XAUUSD) - Potential Bullish Reversal from Demand ZonePrice is currently trading around the 3,368–3,370 area after a steady decline. I’m watching two key zones for a potential reaction:
✅ Demand Zone (15M + 5M OB) – This confluence zone sits near 3,360–3,364. If price taps into this area and shows bullish rejection, I expect a bounce in line with the 1H Trendline support.
📈 Scenario:
A liquidity sweep into the 15M/5M Order Block zone followed by a bullish reaction.
Continuation to the upside targeting the 5M and 30M Order Blocks around 3,380.
⚠️ Invalidation:
If price closes strongly below the demand zone, this bullish setup will be invalidated and further downside could follow.
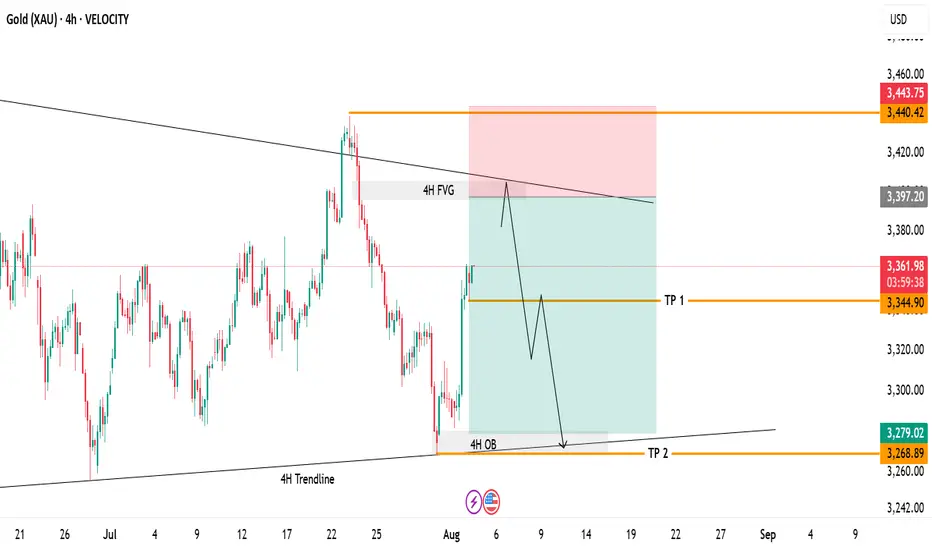
Gold 4H Swing Trade Setup!Currently watching price action as it approaches the 4H Fair Value Gap and descending trendline resistance. Price has not tapped this zone yet, and a move higher into this area could set up a potential reversal.
Setup Highlights:
4H FVG: 3,397–3,400 – Main area of interest.
Trendline Resistance: Confluence zone to watch for rejection.
Plan: Waiting for price to fill the imbalance and test the resistance before considering short entries.
Targets if Rejection Occurs:
TP1: 3,344 – First partial target.
TP2: 3,268 – 4H OB retest.
Invalidation:
A clear breakout and hold above 3,440 would invalidate the bearish scenario.