XRP — Mapping Out the Next High-Probability Long SetupXRP continues to respect key levels, delivering clean setups and strong technical reactions.
📉 Recent Price Action Recap
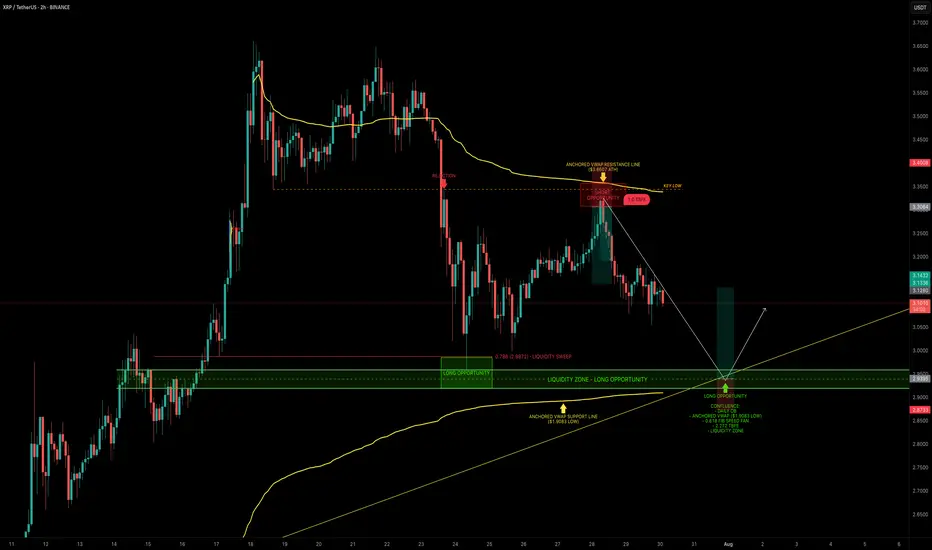
After the flush from $3.65 into the $3.00 support zone, XRP printed a solid bounce back toward the $3.30 resistance area, forming a clean short setup between $3.30–$3.35.
Price is now trading mid-range within the 6-day consolidation.
🟢 Next High-Probability Long Setup
A prime long opportunity lies between $2.96 and $2.9175 sitting within a key daily order block.
Confluence at this zone includes:
Liquidity pool just below the $2.9555 swing low
Anchored VWAP from the $1.9083 swing low resting just under the block
0.618 Fib Speed Fan lining up as dynamic support (July 30 – Aug 2)
2.272 Trend-Based Fib Extension at $2.9297
📈 Long Trade Setup
Entry Zone: $2.96 – $2.9175
Stop Loss: Below anchored VWAP (clear invalidation)
Target: $3.1/$3.13+
R:R: ~1:3+
💡 Educational Insight
This setup is a great example of how multiple tools layered together (like Fibonacci levels, VWAPs, order blocks and liquidity zones) can significantly increase the probability of a trade playing out.
When structure, volume-based tools and time alignment all point to the same area, it creates a high-confluence trade zone. These are the areas where risk is most defined and reward is most favourable, a principle every technical trader should anchor their strategy around.
_________________________________
💬 If you found this helpful, drop a like and comment!
Want breakdowns of other charts? Leave your requests below.
Orderblocks
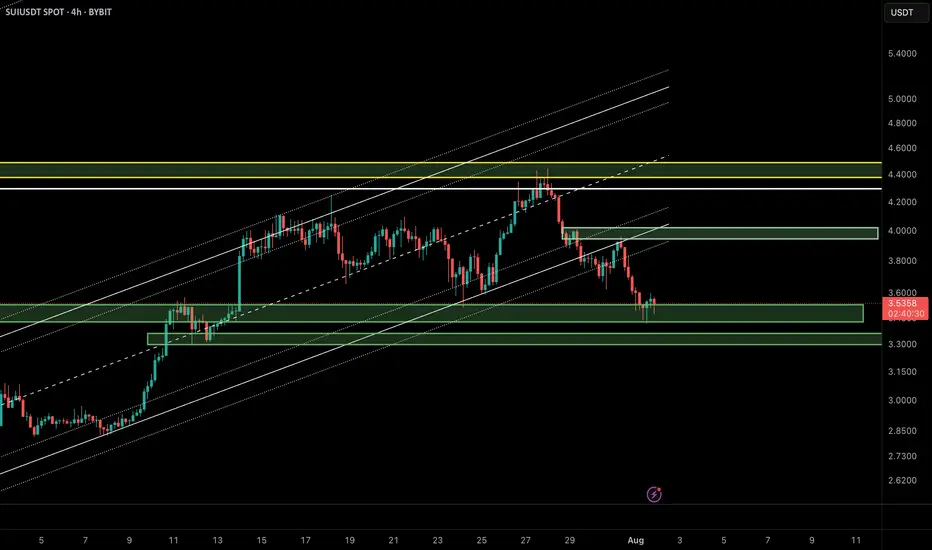
SUI/USDT Update – Bounce Setup from Demand Zone?In the previous analysis, we highlighted a short opportunity near $4.20, which played out perfectly. Now, SUI has reached a key demand zone around $3.40–$3.55, overlapping with the lower boundary of the ascending channel and a previously defined bullish order block.
🔹 Market Structure:
After breaking the bullish structure, price is now revisiting a major liquidity zone between $3.40 and $3.55.
🔹 Price Behavior:
Wicks to the downside suggest buy-side absorption and potential for short-term reversal.
🔹 Possible Scenario:
If the $3.40 zone holds, we could see a corrective move up to the supply zone around $3.90–$4.00.
📌 Key Levels:
• Support: $3.40–$3.55
• Resistance: $3.90–$4.00
❗️If the $3.40 support fails, bullish momentum will likely be invalidated in the short term.
🧠 Pro Tip (SMC-based):
When a demand zone aligns with liquidity sweep and channel support, it often becomes a high-probability area for institutional re-entries. Wait for a clear confirmation like BOS or bullish engulfing candle before entering.
⸻
🔗 Like, share, and follow for more Smart Money & Elliott Wave-based insights!
XAUUSD Price at Decision Point – Bounce or Breakdown?Gold (XAUUSD) is currently trading between two significant zones — a ⏫ 1H Order Block above and a 🛑 Major Support level at 3268.
At this stage, price action remains undecided, and we have a few key scenarios to monitor:
🔄 Potential Scenarios:
📌 Price taps into the 1H OB, then shows signs of rejection — this could trigger a move back down toward support.
⬇️ Price drops directly to 3268, where buyers may step in for a potential bounce.
🚀 If the price breaks through the OB, it may continue pushing up toward the liquidity area around 3248.
⚠️ If support fails, we could see a deeper bearish continuation.
These zones are crucial for both intraday and swing setups. Be patient and wait for a clean reaction to catch a high-probability move.

Gold Market Update: Major Support at and Supply atGold is recovering after a strong drop from the previous range high. Price is approaching a 4H Order Block near the 3300–3310 zone, which may act as a supply area. A minor liquidity zone has just been tapped, suggesting a potential short-term rejection.
The major support lies at 3269, which sparked the recent bullish move. If price rejects from the OB zone, a pullback toward this support is likely. However, a clean break and hold above the OB may signal further upside.
📌 Key Levels:
Supply Zone: 3300–3310
Support: 3269
🧠 Wait for clear confirmation before executing trades.

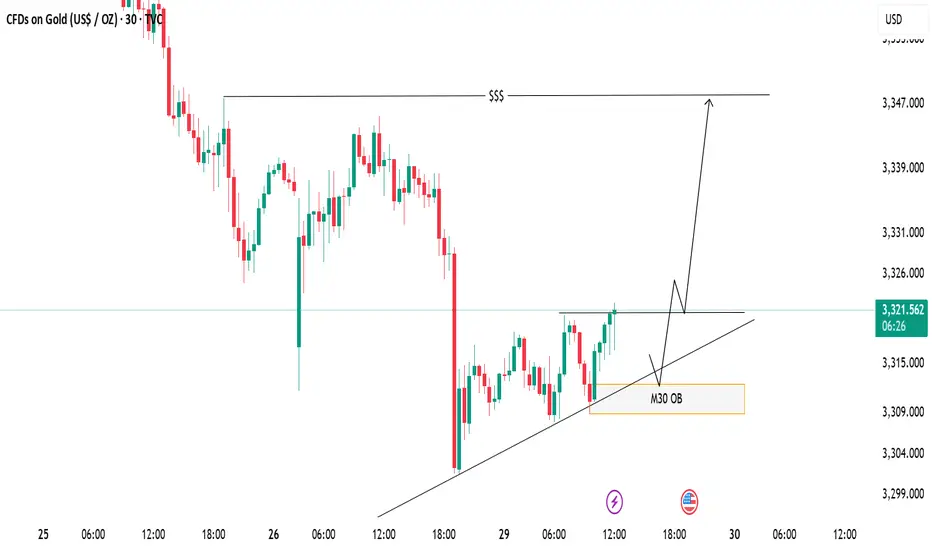
XAUUSD Eyeing Liquidity Grab – M30 OB Zone in PlayPrice is respecting the ascending trendline and consolidating near a key resistance level. A bullish breakout is expected, with a potential retest of the trendline and the M30 Order Block (OB) zone acting as a key demand area.
📈 Trade Plan:
Wait for a minor pullback into the OB and trendline confluence
Look for bullish confirmation to go long
Target the liquidity zone above (around 3347)
📌 A clean structure and bullish order flow hint at a continuation to the upside.
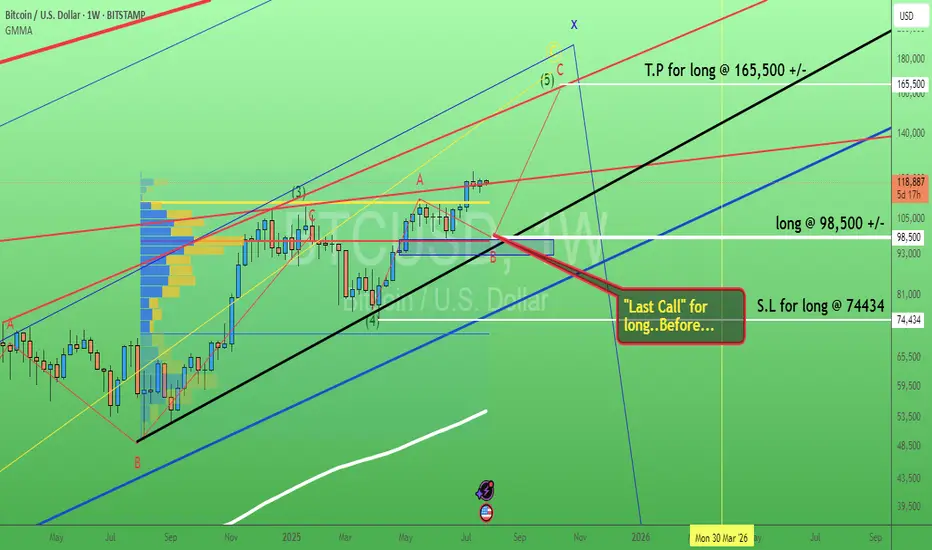
Bitcoin. Last call buy level? 29/July/25BTCUSD probably will have pullback toward confluence zone of 1) Trendline Support 2) Order Block 3) POC of volume before hitting ATH again
NZDUSDT Long Looking to enter NZD/USD around 0.59250 at the Order Block due to a liquidity inducement zone and potential Market Structure Shift (MSS).

EURUSD - Next Buy Zone? This one has some nice potential
We will see how it plays out if we get tagged in

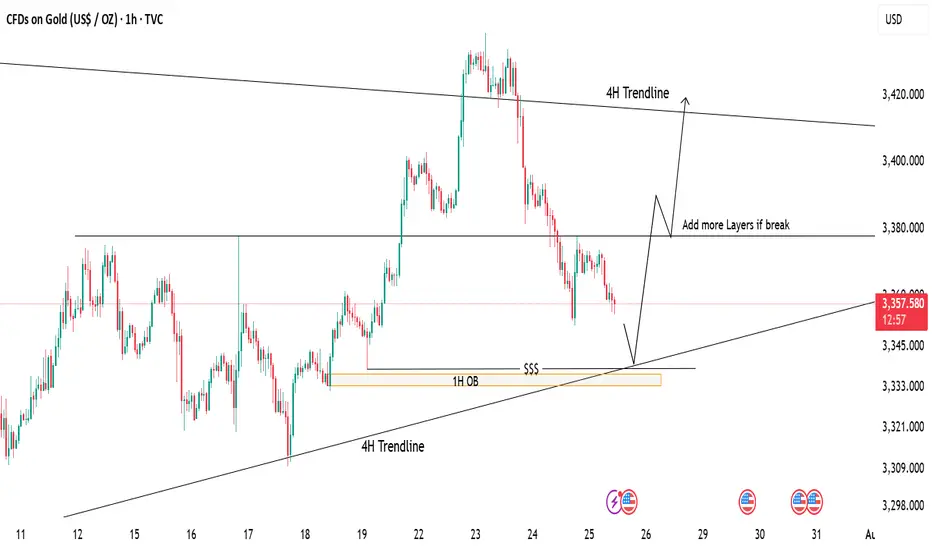
Gold Tapping Into Major Support – Eyes on Bullish ReversalPrice is currently retracing after a strong drop from recent highs. We're now approaching a key demand zone, aligning with:
📍 1H Order Block (OB)
📍 4H Trendline Support
📍 Liquidity Zone ($$$)
📉 If price taps into this area, it may offer a high-probability long setup.
📈 First target: 3380 (mid-range resistance)
🧱 If this breaks, we can look to scale in/add more positions, targeting the 4H trendline zone near 3420.
⚠️ Waiting for price reaction at support – patience is key!
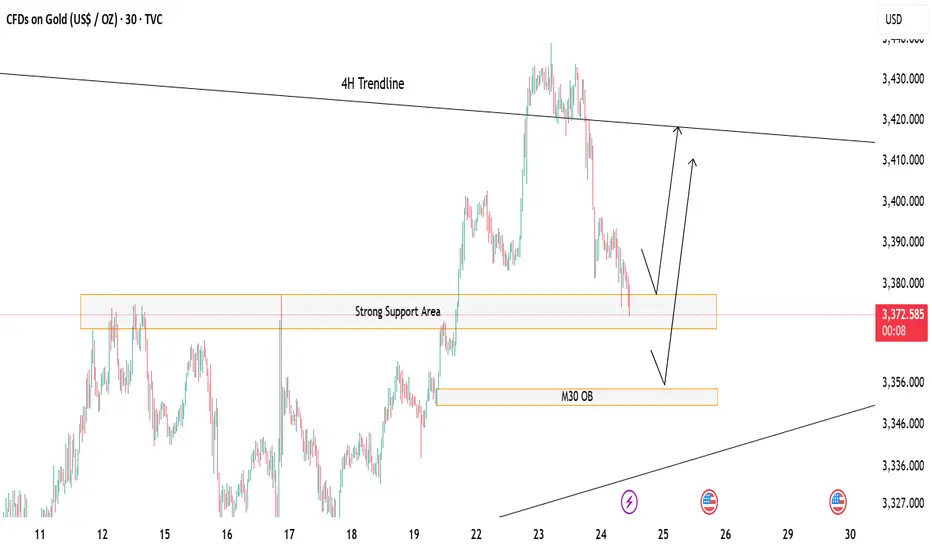
Gold at Key Decision Zone – Bounce or Break?Price is currently hovering above a strong support zone, showing potential for a short-term bounce. 🔁
If this zone holds, we could see a bullish reaction toward the 4H trendline resistance above. 📈
However, a break below may lead price to drop and tap into the M30 Order Block (OB) for a deeper mitigation before any move up. ⚠️
If this happen we could look for potential sell till the OB test otherwise the buying opportunity should focused more
🎯 Watch these key zones carefully – market is at a decision point!
Both buy and sell setups possible depending on how price reacts at these levels.
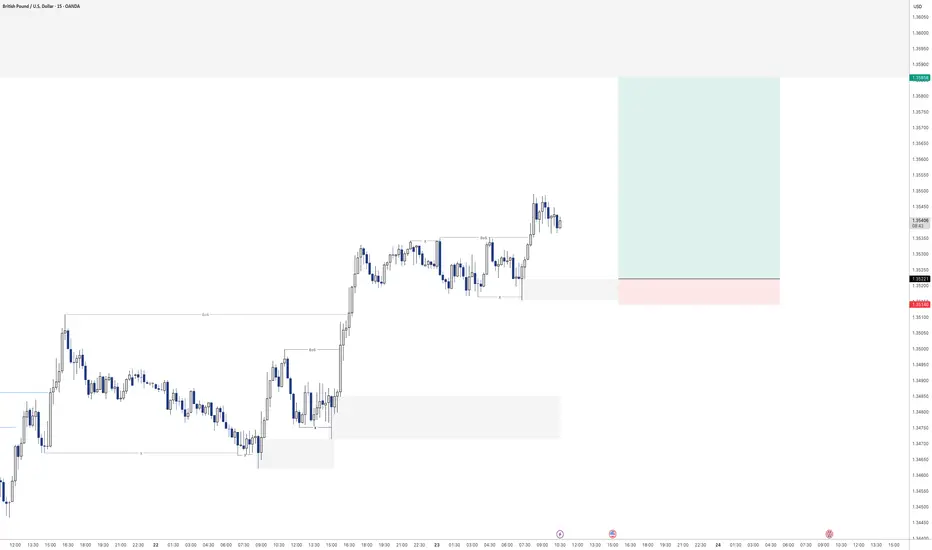
GBPUSD - Next buy from demandLooking here for potential further buying momentum to the upside.
Will see how this plays out tomorrow

GBPUSD - Buying continuationLooking to keep buying the bullish orderflow on the 15min.
Had a nice sweep of liquidity before creating a new high. Will see how this one plays out over the day
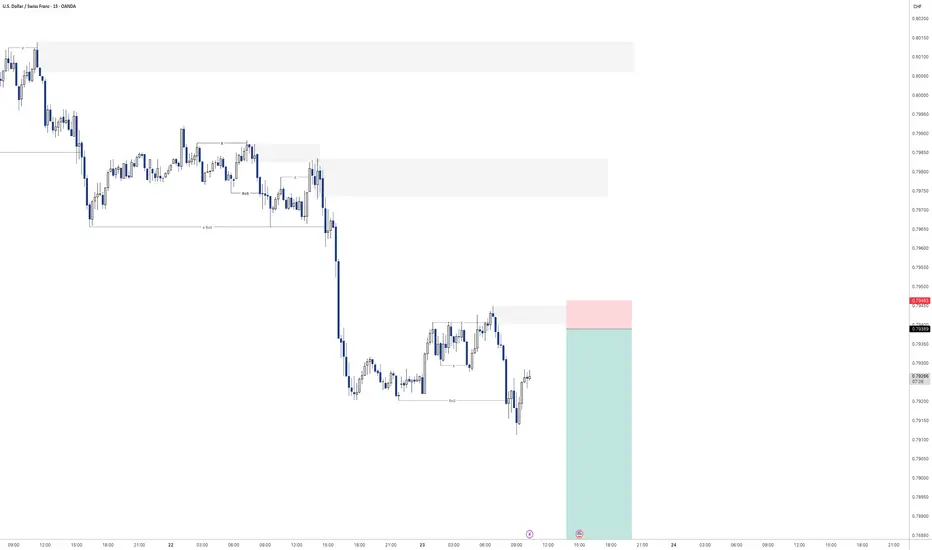
USDCHF - Sell off continuation?Looking for continuation of the selling pressure here on USDCHF
Will see how we play out for the rest of the day
NZDUSD Is a Short-Term Rebound on the Table?NZD/USD is down nearly 0.4% in Tuesday’s European session, trading near the key support area of 0.5940 — a confluence of the 0.5 Fibonacci retracement and the midline of a descending channel. The pair is pressured by rising expectations that the RBNZ may cut rates in August, while the USD remains volatile amid uncertainty surrounding trade talks between the US and its key partners.
🔍 Technical Overview – Structure & Momentum
✅ Overall Trend: Bearish short-term (descending channel)
✅ Current Structure: Price is testing key technical support at 0.5940
✅ Volume Profile: VPOC and upper supply zones remain key targets on a bounce
NZD/USD continues to respect the bearish channel structure. However, the support zone at 0.5940 (Fibo 0.5 + recent demand) is showing signs of holding. If price sustains above this level, a bullish correction toward the 0.6006 and 0.6040 supply zones is a valid scenario.
🧭 Trade Scenarios
🔸 Bullish Short-Term Scenario (if 0.5940 holds):
Entry: Buy around 0.5940
TP1: 0.60064 (VPOC + supply zone)
TP2: 0.60400 (OBS sell zone)
SL: Below 0.5905 (sell-side liquidity break)
🔹 Bearish Continuation (if support breaks):
A clean break below 0.5905 confirms downside continuation
Look for retest and short entries targeting deeper channel lows (0.586x–0.583x)
⚠️ Macro Risk Drivers
Growing expectations of an RBNZ rate cut in August
Ongoing US trade negotiation uncertainty with key partners
Potential USD volatility around upcoming macroeconomic releases
📌 Key Price Levels to Watch
Technical Support 0.5940 Fibo 0.5 + mid-channel
Sell-Side Liquidity 0.5905 Bearish confirmation if broken
VPOC + Supply Zone 0.60064 First upside target
OBS Sell Zone 0.60400 Final bullish target / resistance
💬 The descending channel remains in control, but 0.5940 could be the key pivot. Wait for confirmation before entering, and watch volume closely.

USDJPY Correction Complete, Is the Bullish Trend Back in play?After pulling back from the recent high near 149.17, USDJPY has shown signs of strength again, rebounding off the confluence support at the ascending trendline. The bullish narrative is supported by a hawkish FOMC tone and news that a U.S. federal court temporarily blocked Trump-era tariffs. The pair now awaits upcoming U.S. economic data for further directional clarity.
🔍 Technical Outlook – Structure & Momentum
✅ Primary trend: Bullish
✅ Correction phase: Completed near CP zone and trendline
✅ Key structural areas: FVG Zone, CP Zone, and trendline remain intact
Price has responded positively from the CP Zone + OBS Buy Zone around 147.438, aligning with the uptrend line. As long as this structure holds, buyers may push the market toward the next resistance zones.
🧭 Trade Scenarios
🔸 Bullish Bias (preferred scenario):
As long as price holds above 147.438, we expect continuation toward the FVG zone, with immediate targets at the GAP + OBS Sell Zone (148.703) and extended potential to the Buy-side Liquidity zone at 149.122.
A clean breakout above 149.122 opens the door to Fibonacci extensions: 149.72 and 150.05.
🔹 Bearish Scenario (if invalidated):
If price breaks below 147.438 and loses the trendline, we may see a deeper drop toward the Liquidity Buy Zone at 146.825, where strong buying interest is expected to re-enter the market.
⚠️ Macro Risk Drivers
Hawkish FOMC minutes continue to support USD strength
Paused trade tariffs reduce political headwinds, improving risk sentiment
Upcoming U.S. economic data could trigger sharp intraday moves → watch closely
📌 Key Price Zones
Liquidity Buy Zone 146.825 Major long re-entry zone
CP + OBS Buy Zone 147.438 Current active support
FVG Zone 148.20 – 148.68 Intraday bullish target
GAP + OBS Sell Zone 148.703 Short-term resistance
Buy-side Liquidity Zone 149.122 Final bullish objective
💬 Structure remains bullish unless the trendline breaks. Stay patient, wait for confirmations at key zones, and follow your plan with disciplined risk management.

EURJPY: MSS on H4 Signals Bearish Shift Toward Weekly FVGGreetings Traders,
In today’s analysis of EURJPY, we observe that a Market Structure Shift (MSS) has recently occurred on the H4 timeframe, indicating a potential change in directional bias. This suggests that price may begin to draw toward the Weekly Fair Value Gap (FVG), presenting a favorable opportunity to align with bearish order flow.
Higher Timeframe Context:
The weekly timeframe currently shows an unfilled Fair Value Gap (FVG) to the downside, acting as the primary draw on liquidity. This macro bearish draw adds weight to the idea of shorting the pair from premium levels. On the H4—our intermediate timeframe—we now have structural confirmation via a bearish MSS, aligning the two timeframes toward downside targets.
Key Observations on H4:
Bearish Order Block in Premium: Price has recently retraced into an H4 bearish order block situated within premium pricing. This zone acts as institutional resistance and is currently showing signs of rejection.
Confirmation Zone: This H4 bearish order block is being monitored for M15 confirmation entries, as we look for price to break lower from this key institutional level.
Engineered Support & Resting Liquidity: Just above the weekly FVG lies an engineered support zone—characterized by equal lows—suggesting that liquidity has been pooled there. This area serves as a high-probability draw for institutional price delivery.
Trading Plan:
Entry Strategy: Seek lower timeframe (M15) confirmation around the H4 bearish order block before initiating short positions.
Targets: The first target lies at the H4 internal liquidity pool within discounted pricing. The longer-term objective is the weekly FVG, where liquidity is likely to be delivered next.
For a detailed analysis, please watch this weeks Forex Outlook:https://www.tradingview.com/chart/EURNZD/BZC9xW1L-July-21-Forex-Outlook-Don-t-Miss-These-High-Reward-Setups/
Maintain patience, follow your confirmation rules, and always adhere to sound risk management principles.
Kind Regards,
The_Architect 🏛️📉

Gold Rejection & Retest Zones AnalysisGold has recently broken out of the 1H ascending trendline with a strong bullish push 🚀. After this breakout, we are now watching key supply and demand zones for the next move.
🔴 Bearish OB (3398-3404):
Price is currently hovering around the bearish order block, which could trigger some short-term rejection or pullback from this zone.
🟢 Bullish OB Zones (3350 & 3330):
If gold decides to correct lower, we have two important bullish OBs below, perfectly lining up with the previous trendline retest ✅. These zones can offer high-probability buy setups if price respects them.
🎯 Focus is on watching for possible rejections from the top OB, or waiting for a deeper retracement towards the bullish zones for buy confirmations

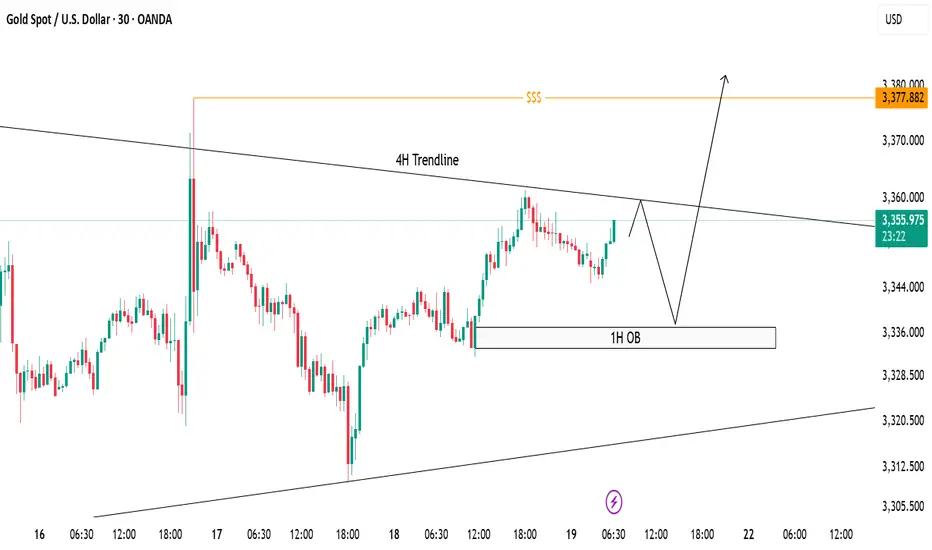
XAUUSD Trade Idea - 30m Structure with 4H ConfluenceCurrently, price is trading below the 4H descending trendline, respecting bearish structure on lower timeframe (30m).
✅ 1H Order Block (OB) marked between 3335-3340 remains a strong demand zone where price can bounce break the trendline to sweep liquidity above around 3377 to form bullish continuation.
📌 Scenarios I'm Watching:
Short-term rejection from the 4H trendline.
Potential reversal towards 1H OB.
Bullish reaction from OB could trigger a breakout above the 4H trendline.
Final upside target remains at the liquidity pool around 3377 zone ($$$).
🟣 Overall Bias: Bullish after liquidity sweep. Watching for bullish confirmation at OB before executing buys.
July 21, Forex Outlook : Don’t Miss These High-Reward Setups!Welcome back, traders!
In today’s video, we’ll be conducting a Forex Weekly Outlook, analyzing multiple currency pairs from a top-down perspective—starting from the higher timeframes and working our way down to the lower timeframes.
Pairs to focus on this Week:
EURUSD
USDJPY
AUDJPY
CADJPY
EURJPY
GBPCHF
USDCHF
NZDCHF
EURNZD
Our focus will be on identifying high-probability price action scenarios using clear market structure, institutional order flow, and key confirmation levels. This detailed breakdown is designed to give you a strategic edge and help you navigate this week’s trading opportunities with confidence.
📊 What to Expect in This Video:
1. Higher timeframe trend analysis
2. Key zones of interest and potential setups
3. High-precision confirmations on lower timeframes
4. Institutional insight into where price is likely to go next
Stay tuned, take notes, and be sure to like, comment, and subscribe so you don’t miss future trading insights!
Have a great week ahead, God bless you!
The Architect 🏛️📉

I'm currently long on EUR/GBPPrice is currently reacting to a retest of an order block located within the discount zone, following a Shift in Market Structure (SMS).
Additionally, on the weekly timeframe, price is also positioned in the discount zone, aligning with a weekly order block at the same level.
Disclaimer: This is not financial advice—just my personal analysis.

GBPUSD: Bearish > Bullish Order FlowAlright, we are approaching some Higher Timeframe Points of Interests. We got a Potential Bullish Bat Pattern Pattern this align with this Bullish H4 Order Block, that's right in the middle of an whole number 1.34. We could expect some spikes around the area, some complex pullbacks, but we must remain steady.

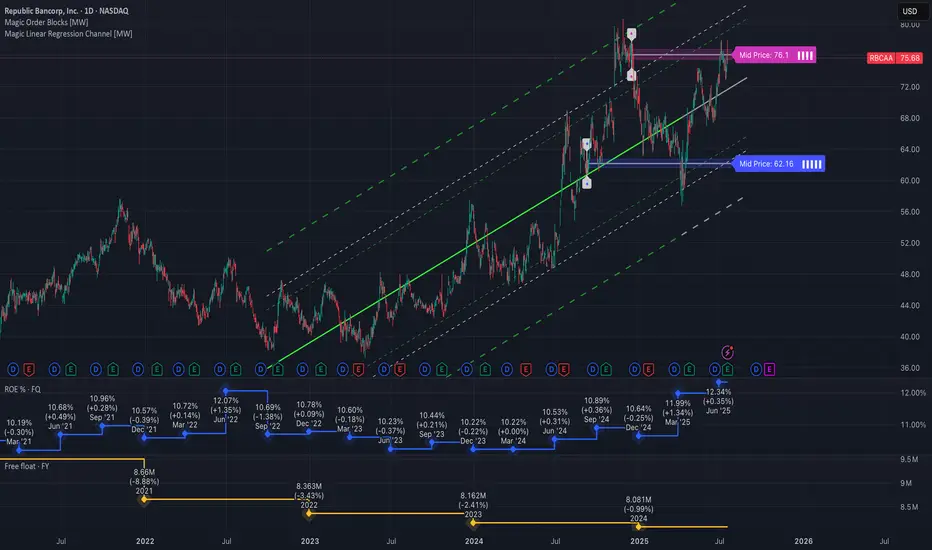
$RBCAA Looking to MoveNASDAQ:RBCAA was a pick from my July 1st, 2025 newsletter, along with $MCRI. They both had similar charts, and were both relatively flat since then. However, NASDAQ:MCRI had a single day 20% jump last week. I guess other folks are catching on. Its 50 day SMA has just recently crossed its 200 day SMA, giving us a golden cross. ROE has been increasing for 4 of the last the last 5 quarters, and the price seems to be bouncing off of it’s 50 day SMA and the baseline of its 3 year channel. Also, float has been decreasing since 2019.
Will it get a big bounce like NASDAQ:MCRI did last week? That remains to be seen, but I might be adding a little bit more to my current position.
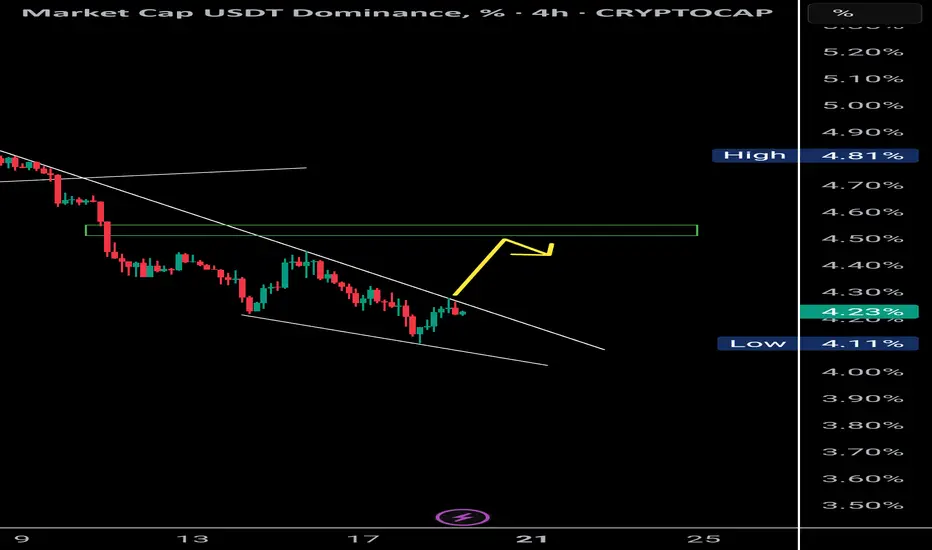
USDT Dominance Forming Bullish Divergence | Altcoins May Retest 📉 USDT Dominance (4H):
Currently forming a bullish divergence with RSI, supported by a falling wedge structure. Price is respecting a clear supply OB (resistance zone) and might retest the 4.55% level.
🔁 Historically, a rise in USDT.D signals short-term corrections in BTC and altcoins, creating opportunities for OB/supply fills and long setups.
📊 This could be the retest phase for major crypto assets before resuming upward momentum.
🧠 Use this phase wisely — it’s where strong setups begin to form.